

Abstract
Fat in the renal sinus (RS), a region of the kidney in which low pressure venous and lymphatic vessels are present, may indirectly influence blood pressure (BP). The purpose of this study was to assess the association between RS fat and control of BP upon receipt of antihypertensive medications.
Two hundred-five (205) participants aged 55 to 85 years at risk for cardiovascular (CV) events underwent magnetic resonance imaging assessments of abdominal and RS fat, measurement of blood pressure, and determination of the number of prescribed antihypertensive medications. Multivariable linear regression was used to determine associations between RS fat, blood pressure, and the number of prescribed antihypertensive medications.
Abdominal fat averaged (416 ± 160 cm3, median and interquartile range (IQR) of 396 cm3 and 308 to 518 cm3); intraperitoneal (IP) fat averaged (141 ± 73 cm3, median and IQR of 129 cm3 and 86 to 194 cm3); and RS fat averaged (4.6 ± 3.2 cm3, median and IQR of 4.2 cm3 and 2.2 to 6.6 cm3). After accounting for age, gender, height, body mass index (BMI), and IP fat, RS fat correlated with the number of prescribed antihypertensive medications (p=0.010), stage II hypertension (p=0.02), and renal size (p=<0.001).
In conclusion, after accounting for other body fat depots and risk factors for hypertension, renal sinus fat volume is associated with the number of prescribed antihypertensive medications and stage II hypertension. These results indicate that further studies are warranted to determine if fat accumulation in the renal sinus promotes hypertension.
Keywords: Renal sinus, intraperitoneal fat, hypertension, blood pressure, body mass index
Introduction
In the last 2 decades in the United States, the prevalence of overweight middle-aged and elderly adults has increased from 57% to 73%, and the prevalence of obesity has increased from 18% to 36%.1 The accumulation of intraperitoneal (IP) fat due to obesity is associated with adverse cardiovascular (CV) outcomes.2,3 Understanding mechanisms by which IP fat (namely abdominal or visceral fat) promotes CV events would enable practitioners to target therapies to reduce CV events in individuals with high IP fat.
A potential mechanism by which obesity and IP fat could promote CV events is through accumulation of fat in the renal sinus (RS). The RS is a peri-renal area bounded from the hilum of the kidney to the edge of the renal parenchyma.4,5 It is physically separated from the renal parenchyma by a reflection of the external capsule. The major branches of the renal artery and vein, along with the major and minor calices of the collecting system and ureters, are located within the RS. The remainder of the RS normally contains small amounts of adipose tissue and lymphatic channels.4,5
In animal models, excessive accumulation of fat within the RS displaces and compresses the low pressure renal lymphatics and veins as well as the ureters.6,7 Compression of these structures increases renal hydrostatic pressure (providing a stimulus to increase renal size) and activates the renin angiotensin aldosterone system (RAAS).6,7 Activation of the RAAS promotes hypertension, insulin resistance, atherosclerosis, and other adverse physiological effects related to obesity.6,7 Thus, excessive adipose tissue in the RS could compress low pressure conduits and serve as a stimulus to medical conditions (e.g. hypertension) that have been associated with CV events.
Despite this rationale, to date, no study has assessed the association between RS fat and hypertension in humans. We hypothesized that RS fat was associated with the severity of hypertension in middle aged and older adults at risk for CV events. To address this hypothesis, we measured the association between RS fat and both antihypertensive medication use, and systolic blood pressure. In addition, we examined the strength of these associations after accounting for fat depots in other body compartments as well as other factors associated with hypertension.
Methods
Study Population
This study is performed in accordance with the National Institutes of Health R01HL076438 entitled, “Pulmonary Edema and Stiffness of the Vascular System (PREDICT).” The purpose of PREDICT is to identify abnormalities of the CV system that forecast a first episode of congestive heart failure (CHF) in middle aged and elderly individuals. To accomplish this, PREDICT investigators plan to recruit 560 middle-aged and elderly individuals (aged 55 to 85 years) with CV risk factors for a first episode of CHF. Participants receive magnetic resonance imaging (MRI) measures of body composition and then 4-years of longitudinal ascertainment for CV events. At present, PREDICT is in the early stages of enrollment and longitudinal follow-up has yet to be performed. The present study utilizes data from the first 205 individuals consecutively enrolled in the first year into the PREDICT study with images acceptable for analysis. The study is approved by the Institutional Review Board of the Wake Forest University School of Medicine, is registered with clinicaltrials.gov (NCT00542503), and each participant provides witnessed informed consent.
Study Design
Medical history, physical exam, laboratory, and MRI data were collected upon participants enrollment into the study. Anthropometric measurements including weight and height were performed in loose clothing without shoes. Blood pressure and heart rate were measured by a trained nurse between 0800 and 1000 hours with the patient in a sitting position for a period of 10 minutes. Brachial blood pressure was determined manually. Laboratory assessments including fasting serum electrolytes, creatinine, glucose, lipids, and C-reactive protein were acquired according to previously published techniques in the fasting state.8–10 Information regarding the use of antihypertensive therapy was derived from personal face to face interviews with study participants. Questions related to these therapies were reconciled after review of the participants medical records. Antihypertensive agents were classified in the following categories: beta-adrenergic blockers (B-BI), angiotensin converting enzyme (ACE) inhibitors, angiotensin receptor blockers (ARB), diuretics, calcium channel blockers (CCB), and others. Patients were classified receiving 1, 2, or 3 antihypertensive agents. Afterward, each participant underwent a cardiac MR exam at a field strength of 1.5T (Siemens Medical Solution, Erlangen, Germany). During the MRI exam, images were acquired for the purpose of determining abdominal fat according to previously published techniques (Figure 1).11–13
Figure 1. Magnetic resonance imaging of abdominal fat compartments at the level of the 2nd lumbar vertebra.

The renal sinus (RS) was identified by using anatomical landmarks. In the top panel, axial image acquired from 1 of the participants in the study at the 2nd lumbar vertebral body. In the lower panel, the same image is color coded according to tissue type. The viscera, musculature, and vertebral bodies are color coded red. The kidneys are color coded brown; RS fat is colored yellow. We defined RS as a space within the concavity of kidney surrounded laterally by the kidney parenchyma. When measuring RS fat, we excluded major branches of the renal artery, renal vein, and any visible branches of the renal collecting system. Segmentation of abdominal fat is color coded as purple for intraperitoneal (IP) fat, blue for retroperitoneal (RP) fat, and green for subcutaneous fat. We defined IP fat as fat contained within the mesentery and omentum that was bounded anteriorly and laterally by the abdominal wall, and posteriorly by a line passing in front of the kidneys, descending aorta and inferior vena cava. Remaining fat within the abdomen was defined as RP fat (using boundaries of IP fat anteriorly and abdominal wall posteriorly). Subcutaneous fat was defined as fat lying outside of muscular abdominal wall.
For the purpose of this study, hypertension was defined according to “seventh report of the Joint National Committee on Prevention, Detection, Evaluation, and Treatment of High Blood Pressure” (JNC VII) as a systolic blood pressure (SBP) of ≥140 mmHg, a diastolic blood pressure (DBP) ≥ 90mmHg, or the concurrent use of antihypertensive medications.14 Furthermore, for those with hypertension, we used these same JNC VII criteria to define stage 1 hypertension as a SBP 140–159 mmHg or a DBP 90–99 mmHg, and stage 2 hypertension as a SBP ≥160 mmHg, or a DBP ≥100 mmHg. We also defined coronary artery disease (CAD) in accordance with American College of Cardiology/American Heart Association guidelines.15 Each component of the data that was acquired was accomplished by personnel blinded to other components of the study. For example, those acquiring and documenting medical history, physical exam, and laboratory data were blinded to the results of MRI; those analyzing abdominal fat were blinded to all other test results from the participants.
Measurement of abdominal and renal sinus fat
According to previously published techniques, MRI measurements of total abdominal fat were accomplished in a single axial slice positioned at the level of the second lumbar vertebra;12 abdominal fat was segmented into subcutaneous (SC), retroperitoneal (RP), and IP compartments as shown in Figure 1.11–13 Renal sinus fat was collected from this same image slice. Prior studies have shown an excellent correlation between the fat in a single abdominal slice and total fat in the abdomen.11–12
The cross-sectional area of both kidneys (cm2) was measured in the same slice used to determine IP and RS fat depots. Both kidneys were measured and RS fat from each kidney was summed and averaged to produce a single value. Patients with hydronephrosis or congenital renal anomalies were excluded. The Slice-O-Matic 4.2 Rev-10 (TomoVision; Montreal, Canada) software analysis program was used for all measurements.16 Regions of interest (ROIs) were drawn on each slice and their areas were determined by multiplying the number of pixels within the ROI by the size of each pixel.17 To obtain the volume of fat for each territory (SC, IP, RP, RS) in cm3, the area was multiplied by slice thickness. To determine the interobserver variability of the measurements of fat within each compartment, images from 20 randomly selected participants were redrawn by a different observer blinded to all other study results.
Statistical Analysis
Due to skewness in distribution of many of the variables, the distributions were summarized by the median and interquartile range. Statistical tests to determine if the continually increasing levels of RS fat were associated with increasing or decreasing levels of each variable were based on Spearman's rank correlation coefficients. Multiple tests of correlation coefficients were deemed significant at the 5% level of significance controlling for an overall 5% false discovery rate. Groups were separated by quartiles of RS fat only in order to illustrate trends for tables and not for hypothesis testing. The primary aim of the study was to see if RS fat was associated with measures of blood pressure (SBP and DBP), the number of prescribed hypertensive medications, and renal function (renal size and serum creatinine); therefore, tests of association between RS fat with these five primary outcome measures were adjusted for five multiple comparisons using the Bonferroni technique. Partial rank correlation was used to adjust the association between fat subtypes and CV risk factors after accounting for other potentially confounding variables such as age, gender, body mass index (BMI), and height. To compare dichotomous variables with amounts of RS fat, Wilcoxon rank sum tests were used. Data were analyzed using SPSS (Chicago, IL) and SAS (Cary, NC). Unless stated otherwise, all data were presented as mean ± standard deviation; a two-sided p-value < 0.05 was considered significant. The authors had full access to the data and take responsibility for its integrity.
Results
The baseline and clinical characteristics of the study participants are shown in Table 1. The mean age of the participants was 69 ± 7 years (median and interquartile range of 69 and 63 to 75 years); 51% were men. Renal sinus fat averaged 4.6 ± 3.2 cm3 (range 0.0 to 16.6 cm3, median and interquartile range of 4.2 and 2.2 to 6.6 cm3); IP fat averaged 141 ± 73 cm3 (range 12 to 368 cm3, median and interquartile range of 129 and 86 to 194 cm3); RP fat averaged 58 ± 30 cm3 (range 11 to 168 cm3, median and interquartile range of 55 and 35 to 78 cm3); and SC fat averaged 216 ± 114 cm3 (range 23 to 716 cm3, median and interquartile range of 195 and 137 to 274 cm3). Fifty-six percent, 45%, 42%, 27%, and 17%, respectively received diuretics, B-BI's, ACE inhibitors, CCBs, or ARB's; 43% patients received ≥ 2 antihypertensive medications. Associations of RS fat with participant demographics are shown in Table 2.
Table 1.
Characteristics of 205 study participants (median and interquartile range of renal sinus fat)
| Variables | Overall | 1st Q | 2nd Q | 3rd Q | 4th Q |
|---|---|---|---|---|---|
| Age (yrs) | 69 | 68 | 67 | 67 | 71 |
| Men (%) | 51 | 33 | 35 | 52 | 82 |
| Caucasian/Black/Others (n) | 169 /32/4 | 33/15/1 | 39/13/1 | 47/3/1 | 50/1/1 |
| Weight (kg) | 86 | 81 | 83 | 87 | 94 |
| Height (cm) | 170 | 165 | 167 | 168 | 175 |
| Body mass index (kg/m2) | 30 | 30 | 29 | 30 | 29 |
| Systolic blood pressure (mmHg) | 142 | 141 | 143 | 142 | 142 |
| Diastolic blood pressure (mmHg) | 77 | 76 | 78 | 77 | 77 |
| Heart rate (beats/min) | 66 | 66 | 65 | 67 | 65 |
| Diabetes (%) | 41 | 42 | 37 | 41 | 43 |
| Hypertension (%) | 93 | 90 | 96 | 92 | 92 |
| Hypercholesterolemia (%) | 77 | 71 | 76 | 76 | 86 |
| Prior myocardial infarction (%) | 15 | 10 | 16 | 10 | 24 |
| Current smokers (%) | 5 | 0 | 8 | 10 | 6 |
| Coronary artery disease (%) | 34 | 22 | 29 | 33 | 51 |
| Creatinine (mg/dl) | 0.90 | 0.90 | 0.90 | 0.90 | 1.0 |
| Fasting glucose (mg/dl) | 109 | 114 | 106 | 106 | 114 |
| Fasting total cholesterol (mg/dl) | 163 | 175 | 163 | 174 | 151 |
| Fasting low-density lipoprotein-C (mg/dl) | 90 | 99 | 90 | 93 | 85 |
| Fasting high-density lipoprotein-C(mg/dl) | 46 | 52 | 47 | 43 | 42 |
| Fasting triglycerides (mg/dl) | 110 | 100 | 110 | 125 | 128 |
| Renal sinus fat (cm3) | 4.2 | 0.7 | 3.0 | 5.5 | 8.5 |
| Subcutaneous fat (cm3) | 195 | 208 | 213 | 198 | 180 |
| Retroperitoneal fat (cm3) | 55 | 40 | 44 | 57 | 80 |
| Intraperitoneal fat (cm3) | 129 | 95 | 116 | 129 | 185 |
Table 2.
Univariate association of variables with renal sinus fat
| Variables | Correlation* | p-value |
|---|---|---|
| Age | 0.06 | 0.43 |
| Men (%) | 0.37 | <0.001 |
| Body mass index | 0.10 | 0.17 |
| Diabetes | 0.01 | 0.85 |
| Coronary artery disease | 0.22 | 0.001 |
| Prior myocardial infarction | 0.11 | 0.10 |
| Hyperlipidemia | 0.18 | 0.01 |
| Triglycerides (mg/dl) | 0.17 | 0.02 |
| High-density lipoprotein (mg/dl) | −0.16 | 0.02 |
| C-reactive protein | 0.03 | 0.67 |
| Potassium | −0.02 | 0.76 |
| Subcutaneous fat (cm3) | −0.08 | 0.24 |
| Retroperitoneal fat (cm3) | 0.47 | <0.001 |
| Intraperitoneal fat (cm3) | 0.41 | <0.001 |
Spearman's correlation
Renal sinus fat volume correlated with both RP and IP fat volume (r=0.47, p≤0.001; and r=0.41, p≤0.001, respectively), but not with SC fat volume (r=−0.08, p=0.24)(Table 2). The interobserver reliability was assessed by the intraclass correlation coefficients, which were 0.976, 0.944, 0.996, and 0.825 for IP, RP, SC, and RS depots, respectively.
Renal sinus fat correlated with the number of prescribed antihypertensive medications (p=0.01). The volume of RS fat increased as the number of antihypertensive medications increased (3.9, 4.9, and 6.3 cm3, for 1, 2, and 3 prescribed antihypertensive medications, respectively, p=0.006). Renal sinus fat was associated with serum creatinine (r=0.28, p<0.001), but the correlation of RS fat with creatinine clearance, performed using Cockroft-Gault formula,18 did not reach statistical significance (p=0.25).
There was a trend for an association between higher pulse pressure and RS fat (r=0.13, p=0.07). The amount of RS fat was higher in those with stage I hypertension; however this association was lost after accounting for the number of prescribed hypertensive medications. The amount of RS fat was significantly higher in those with stage II hypertension (6.0 cm3 versus 4.4 cm3; p=0.021, respectively), both before (p=0.02) and after (p=0.03) accounting for the number of prescribed antihypertensive medications (Figure 2). After accounting for multiple comparisons, RS fat remained associated with renal size, serum creatinine, and the number of prescribed antihypertensive medications (Table 3).
Figure 2. Line graph demonstrating the relationship between renal sinus fat, number of antihypertensive medications and control of blood pressure.
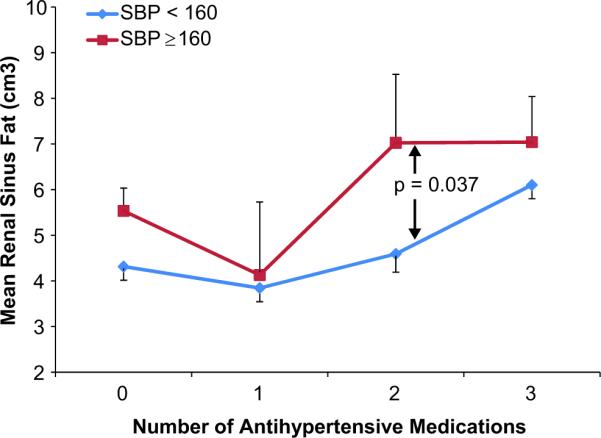
Line graph showing amount of renal sinus (RS) fat on the y-axis and number of antihypertensive medications (0–3) on the x-axis for those with (red) and without (blue) stage II hypertension (a systolic blood pressure [SBP] ≥ or < 160mmHg). For all participants, renal sinus fat was greater in those with a SBP ≥ as opposed to < 160mmHg.
Table 3.
Univariate association of variables with renal sinus fat
| Variables | Correlation* | p-value | p-value† |
|---|---|---|---|
| Systolic blood pressure-(mmHg) | 0.08 | 0.28 | 0.81 |
| Diastolic blood pressure-(mmHg) | 0.04 | 0.54 | 0.98 |
| Renal size (cm2) | 0.42 | <0.001 | <0.001 |
| Creatinine (mg/dl) | 0.28 | <0.001 | <0.001 |
| Number of antihypertensive medications | 0.18 | 0.01 | 0.048 |
Spearman's correlation
Bonferroni corrected p-values adjusting for 5 comparisons
Patients with and without diabetes had similar amounts of RS fat (4.6 vs. 4.5 cm3 (p= 0.85). Renal sinus fat was not associated with or fasting glucose levels (p=0.24). Those with (5.6 cm3) versus without (4.0 cm3) CAD exhibited more RS fat, p= 0.001. Partial correlation was performed for the association of variables with RS fat after adjusting for age, gender, body mass index (BMI), and height. Renal sinus fat remained independently associated with the number of antihypertensive medications, IP fat volume, RP fat volume, and renal size after accounting for all of these variables (Table 4).
Table 4.
Multivariable associations of renal sinus fat with cardiovascular risk factors using partial correlation
| Variables | Correlation Coefficient (r) | p-value* |
|---|---|---|
| No. of hypertensive medications | 0.18 | 0.01 |
| Systolic blood pressure | 0.10 | 0.19 |
| Subcutaneous fat | 0.14 | 0.07 |
| Retroperitoneal fat | 0.34 | <0.001 |
| Intraperitoneal fat | 0.28 | <0.001 |
| Total renal size | 0.31 | <0.001 |
Controlling for age, gender, body mass index and height
We also performed a multivariable linear regression using the number of prescribed antihypertensive medications as a dependant variable and SC, IP, and RS fat as covariates. The significant association of IP fat with the number of prescribed antihypertensive medications was lost (β=0.026, p=0.75), but importantly, there remained a persistent association between the number of antihypertensive medications used by study participants and the volume of RS fat (β=0.193, p=0.01) present in these same participants (Table 5).
Table 5.
Multiple regression using number of antihypertensive medications as a dependant variable
| Variables | Beta (95% CI) | p-value |
|---|---|---|
| Intraperitoneal Fat | 0.026 (−.130, 0.181) | 0.75 |
| Renal Sinus Fat | 0.193 (0.039, 0.346) | 0.01 |
| Subcutaneous Fat | 0.042 (−0.100, 0.183) | 0.56 |
Discussion
The results of this study indicate that RS fat is associated with (1) intraperitoneal and retroperitoneal (IP and RP, respectively) fat, (2) an increase in the number of antihypertensive medications used to treat blood pressure (Tables 3 and 4), and (3) metrics of “control” of hypertension, classified as JNC VII stage II hypertension (a brachial cuff pressure ≥ versus < 160/100 mmHg [Figure 2]). All of these associations remain after accounting for age, gender, BMI, and height (Table 4). Additionally, RS fat volume is associated with the number of antihypertensive medications used by study participants after accounting for age, gender, BMI, and height in addition to accounting for IP fat (Table 5). To the best of our knowledge, this is the first study in human subjects to address the association of RS fat with hypertension after accounting for patient demographics.
Many classifications have been proposed for the subdivision of body fat to different compartments; most commonly, abdominal fat depots are classified into IP (or visceral) and SC fat compartments.13 Previous studies have described differences in the metabolic and endocrine profiles of individuals with larger amounts of IP versus SC fat.13 Unlike SC fat, IP fat is associated with adverse CV events including myocardial infarction and stroke.19 Also IP fat is associated with insulin resistance20–22 and higher incidences of obesity related hypertension.23
In this study, we sought to address the association between RS fat and hypertension because (1) in general, those with higher amounts of IP fat also exhibit more RS fat; (2) mild elevation of compressive forces within the RS could constrict several relatively low pressure conduits (renal veins and ureters) that could adversely impact blood pressure; and (3) in animal models, increased amounts of RS fat have been associated with larger kidney size and reduced kidney function.
In our study, after introducing RS fat into a multivariable regression model, the association between IP fat and the number of prescribed antihypertensive medications was lost, but the association of RS fat with these metrics persisted (Table 5). This finding suggests that some of the relationship between the number of medications used to treat BP elevations is dependent on RS fat and is independent of IP fat. Also, these data suggest that further studies are warranted to determine if increased RS fat causes or contributes to poor control of hypertension in humans.
Renal sinus fat may exert influence on hypertension and CV risk through one of several mechanisms. Compression of blood vessels, lymph vessels, and ureters in the RS (sinus lipomatosis)24 may obstruct the renal outflow tract and increase intrarenal hydrostatic pressure.25 As a result, kidney size may increase. This observation has been previously shown in animal studies,26 in which obese rabbits exhibited larger kidneys (30%) with larger fat deposits within the RS. This occurred due to renal lymphatic compression, despite an absence of detectable fat accumulation within the renal parenchyma.26 Our study results demonstrated as association between RS fat and kidney size after accounting for age, gender, and body size (Table 3 and 4).
While the results of the study did demonstrate an association of RS fat with serum creatinine (Table 3), they did not demonstrate an association of RS fat with estimated creatinine clearance. This latter observation may be related to the fact that we did not perform power analyses to determine a sample size necessary to identify differences in creatinine clearance in this study population. Importantly however, the results of this study along with those from prior studies in animals suggest that further studies are warranted to determine mechanisms by which RS fat could promote hypertension.
Our study has limitations. First, our results are associative and observational, therefore we cannot establish causal relationships between RS fat and hypertension. In addition, our association may be related to unrecognized potentially confounding variables that are present in our study population. To account for this possibility, we performed multivariable regression analyses that accounted for factors known to influence hypertension as well as CV risk (e.g., age, gender, BMI, and height). Our association between RS fat and both CV risk factors and the number of medications used to treat high blood pressure persisted. Second, our study population was composed primarily of Caucasians. Larger studies are needed to determine if the observations in this study are present in individuals of various race and ethnicity. Third, many of our variables exhibited a skewed distribution. Accordingly, we provided the median and interquartile range (Table 1), and both parametric and non-parametric statistical tests, where appropriate. Fourth, many of our study participants received antihypertensive medications, and we did not stop these medications to determine blood pressure after an extended wash-out period. While measures of medications reflect absolute blood pressure, this was not possible to accomplish in our cohort because many participants had CAD and were at risk for CV events. However, we were able to demonstrate important associations between RS fat and the number of medications needed to control blood pressure as well as direct measures of BP upon receipt of antihypertensive therapy (Figure 2). Fifth, we used a single abdominal slice at the level of second lumbar vertebra to measure various compartments of fat. Although prior studies have correlated fat volumes in a single slice with total abdominal fat,11–12 the studies measuring total fat in abdomen may provide more detailed assessments of different subgroups of fat including RS fat. Sixth, we did not directly assess activity of RAAS or measure laboratory values associated with insulin resistance. Future studies should be directed towards direct assessment of the functionality of the RAAS and its association with RS fat.
In conclusion, our results demonstrate an association between RS fat accumulation and metrics of hypertension control including the number of medications needed to treat hypertension and blood pressure after receipt of these medications. These associations are independent of body size, age, gender, and importantly intraperitoneal or visceral fat. These observations combined with data from prior animal studies suggest further studies are warranted to investigate whether a causal relationships exists between RS fat accumulation and hypertension in middle-aged and elderly individuals at risk for cardiovascular events.
Perspectives
This paper demonstrates an association between fat accumulation in the renal sinus and the number of medications necessary to treat hypertension as well as systolic blood pressure after receipt of antihypertensive therapy. In animals, RS fat plays an important role in the pathophysiology of resistant hypertension. By compressing low pressure structures in the renal hilum (veins, lymphatics), RS fat increases intracapsular pressure which leads to enhanced activation of the renin-angiotensin system that can promote resistant hypertension despite receipt of multiple antihypertensive medications. The results of this and other studies in animals indicate research is needed to determine if RS fat promotes resistant hypertension.
Acknowledgments
In preparation of this manuscript, we appreciate the assistance of Deanna Carr, BA and Paul Biggers, PhD.
Sources of Funding: Research supported in part by the following grants from the National Institute of Health: RO1HL076438, R33CA1219601, P30AG21332 and MO1-RR07122.
Footnotes
Conflicts of Interest: None
This is a PDF file of an unedited manuscript that has been accepted for publication. As a service to our customers we are providing this early version of the manuscript. The manuscript will undergo copyediting, typesetting, and review of the resulting proof before it is published in its final citable form. Please note that during the production process errors may be discovered which could affect the content, and all legal disclaimers that apply to the journal pertain.
References
- 1.2008 Older Americans: Key Indicators of Well-Being. Federal Interagency Forum on Aging Related Statistics, National Center for Health Statistics; Aging stats.gov. [Google Scholar]
- 2.Marques MD, Santos RD, Parga JR, Rocha-Filho JA, Quaglia LA, Miname MH, Avila LF. Relation between visceral fat and coronary artery disease evaluated by multidetector computed tomography. Atherosclerosis. 2010;209:481–486. doi: 10.1016/j.atherosclerosis.2009.10.023. [DOI] [PubMed] [Google Scholar]
- 3.Sutton-Tyrrell K, Newman A, Simonsick EM, Havlik R, Pahor M, Lakatta E, Spurgeon H, Vaitkevicius P. Aortic stiffness is associated with visceral adiposity in older adults enrolled in the study of health, aging, and body composition. Hypertension. 2001;38:429–433. doi: 10.1161/01.hyp.38.3.429. [DOI] [PubMed] [Google Scholar]
- 4.Zagoria RJ, Tung GA. The renal sinus, pelvocalyceal system and ureter. Genitourinary Radiology: the Requisites. Mosby; St. Louis, Mo: 1997. pp. 152–191. [Google Scholar]
- 5.Davidson AJ, Hartman DS, Choyke PL, Wagner BJ. Renal sinus and periureteral abnormalities. 3rd ed. Davidson's Radiology of the Kidney and Genitourinary Tract; Philadelphia: 1999. pp. 431–455. [Google Scholar]
- 6.Ott CE, Navar LG, Guyton AC. Pressures in static and dynamic states from capsules implanted in the kidney. Am J Physiol. 1971;221:394–400. doi: 10.1152/ajplegacy.1971.221.2.394. [DOI] [PubMed] [Google Scholar]
- 7.Dwyer TM, Mizelle HL, Cockrell K, Buhner P. Renal sinus lipomatosis and body composition in hypertensive, obese rabbits. Int J Obes Relat Metab Disord. 1995;19:869–874. [PubMed] [Google Scholar]
- 8.Tietz NW. Clinical Guide to Laboratory Tests. 3rd Edition W.B. Saunders; Philadelphia, PA: 1995. [Google Scholar]
- 9.National Committee for Clinical Laboratory Standards . Procedures for the Handling and Processing of Blood Specimens, Approved Guideline, NCCLA publication H18-A. Villanova, PA: 1990. [Google Scholar]
- 10.National Committee for Clinical Laboratory Standards . Method Comparison and Bias Estimation Using Patient Samples, Approved Guideline, NCCLS publication EP9-A. Villanova, PA: 1995. [Google Scholar]
- 11.Abate N, Garg A, Coleman R, Grundy SM, Peshock RM. Prediction of total subcutaneous abdominal, intraperitoneal, and retroperitoneal adipose tissue masses in men by a single axial magnetic resonance imaging slice. Am J Clin Nutr. 1997;65:403–408. doi: 10.1093/ajcn/65.2.403. [DOI] [PubMed] [Google Scholar]
- 12.Demerath EW, Shen W, Lee M, Choh AC, Czerwinski SA, Siervogel RM, Towne B. Approximation of total visceral adipose tissue with a single magnetic resonance image. Am J Clin Nutr. 2007;85:362–368. doi: 10.1093/ajcn/85.2.362. [DOI] [PMC free article] [PubMed] [Google Scholar]
- 13.Shen W, Wang Z, Punyanita M, Lei J, Sinav A, Kral JG, Imielinska C, Ross R, Heymsfield SB. Adipose tissue quantification by imaging methods: A proposed classification. Obes Res. 2003;11:5–16. doi: 10.1038/oby.2003.3. [DOI] [PMC free article] [PubMed] [Google Scholar]
- 14.Chobanian AV, Bakris GL, Black HR, Cushman WC, Green LA, Izzo JL, Jr, Jones DW, Materson BJ, Oparil S, Wright JT, Jr, Roccella EJ. Seventh report of the Joint National Committee on Prevention, Detection, Evaluation, and Treatment of High Blood Pressure. Hypertension. 2003;42:1206–1252. doi: 10.1161/01.HYP.0000107251.49515.c2. [DOI] [PubMed] [Google Scholar]
- 15.Fraker TD, Jr, Fihn SD, Gibbons RJ, Gibbons RJ, Abrams J, Chatterjee K, Daley J, Deedwania PC, Douglas JS, Ferguson TB, Jr, Gardin JM, O'Rourke RA, Williams SV, Smith SC, Jr, Jacobs AK, Adams CD, Anderson JL, Buller CE, Creager MA, Ettinger SM, Halperin JL, Hunt SA, Krumholz HM, Kushner FG, Lytle BW, Nishimura R, Page RL, Riegel B, Tarkington LG, Yancy CW. 2007 chronic angina focused update of the ACC/AHA 2002 guidelines for the management of patients with chronic stable angina: A report of the American College of Cardiology/American Heart Association Task Force on Practice Guidelines Writing Group to develop the focused update of the 2002 guidelines for the management of patients with chronic stable angina. J Am Coll Cardiol. 2007;50:2264–2274. doi: 10.1016/j.jacc.2007.08.002. [DOI] [PubMed] [Google Scholar]
- 16.Potretzke AM, Schmitz KH, Jensen MD. Preventing overestimation of pixels in computed tomography assessment of visceral fat. Obes Res. 2004;12:1698–1701. doi: 10.1038/oby.2004.210. [DOI] [PubMed] [Google Scholar]
- 17.Mitsiopoulos N, Baumgartner RN, Heymsfield SB, Lyons W, Gallagher D, Ross R. Cadaver validation of skeletal muscle measurement by magnetic resonance imaging and computerized tomography. J Appl Physiol. 1998;85:115–122. doi: 10.1152/jappl.1998.85.1.115. [DOI] [PubMed] [Google Scholar]
- 18.Cockcroft DW, Gault MH. Prediction of creatinine clearance from serum creatinine. Nephron. 1976;16:31–41. doi: 10.1159/000180580. [DOI] [PubMed] [Google Scholar]
- 19.Nicklas BJ, Penninx BW, Cesari M, Kritchevsky SB, Newman AB, Kanaya AM, Pahor M, Jingzhong D, Harris TB. Health, Aging and Body Composition Study. Association of visceral adipose tissue with incident myocardial infarction in older men and women: The health, aging and body composition study. Am J Epidemiology. 2004;160:741–749. doi: 10.1093/aje/kwh281. [DOI] [PubMed] [Google Scholar]
- 20.Bonadonna RC, Groop L, Kraemer N, Ferrannini E, Del Prato S, DeFronzo RA. Obesity and insulin resistance in humans: A dose-response study. Metabolism. 1990;39:452–459. doi: 10.1016/0026-0495(90)90002-t. [DOI] [PubMed] [Google Scholar]
- 21.Young JB. Effect of experimental hyperinsulinemia on sympathetic nervous system activity in the rat. Life Sci. 1988;43:193–200. doi: 10.1016/0024-3205(88)90297-4. [DOI] [PubMed] [Google Scholar]
- 22.Stenvinkel P, Bolinder J, Alvestrand A. Effects of insulin on renal haemodynamics and the proximal and distal tubular sodium handling in healthy subjects. Diabetologia. 1992;35:1042–1048. doi: 10.1007/BF02221679. [DOI] [PubMed] [Google Scholar]
- 23.Hall JE. Mechanisms of abnormal renal sodium handling in obesity hypertension. Am J Hypertens. 1997;10:49S–55S. [PubMed] [Google Scholar]
- 24.Dwyer TM, Mizelle HL, Cockrell K, Buhner P. Renal sinus lipomatosis and body composition in hypertensive, obese rabbits. Int J Obes Relat Metab Disord. 1995;19:869–874. [PubMed] [Google Scholar]
- 25.Dwyer TM, Bigler SA, Moore NA, Carroll JF, Hall The altered structure of renal papillary outflow tracts in obesity. Ultrastruct Pathol. 2000;24:251–257. doi: 10.1080/01913120050176707. [DOI] [PubMed] [Google Scholar]
- 26.Dwyer TM, Banks SA, Alonso-Galicia M, Cockrell K, Carroll JF, Bigler SA, Hall JE. Distribution of renal medullary hyaluronan in lean and obese rabbits. Kidney Int. 2000;58:721–729. doi: 10.1046/j.1523-1755.2000.00218.x. [DOI] [PubMed] [Google Scholar]