

Among various molecular imaging techniques, magnetic resonance imaging (MRI) is one of the most powerful and non-invasive diagnostic tools because MRI can provide images with excellent anatomical details based on the interaction of protons with the surrounding molecules of tissues.[1] MRI contrast agents, generally in the form of T1 positive contrast agents and T2 negative contrast agents, can greatly improve the sensitivity of MRI by increasing the contrast of the target from the background. For example, superparamagnetic iron oxide (SPIO) nanoparticles with strong magnetic moments are the prevailing T2 contrast agents, especially in the imaging and detection of lesions from normal tissues.[2] The significant drawbacks of SPIO nanoparticles as T2 contrast agents are, however, magnetic susceptibility artifacts and negative contrast effects (i.e., dark MR images),[3] which may limit their clinical applications. On the contrary, T1 imaging, typically using paramagnetic materials as contrast agents, has excellent resolution between tissues due to its high signal intensity (bright and positive MR images).[4] Although ultrasmall (~3 nm in diameter) iron oxide nanoparticles can be used as T1 contrast agents,[5] the gadolinium species possessing seven unpaired electrons are still the prevailing T1 contrast agents in clinical use.[4]
The combination of multiple imaging modalities can yield complementary diagnostic information and offer synergistic advantages over the single modality.[6] The T1–T2 dual-modal strategy for MRI has attracted considerable interest because it can give highly accurate diagnostic information by the beneficial contrast effects in both T1 imaging with high tissue resolution and T2 imaging with high feasibility on detection of a lesion. [7] Moreover, considering the different penetration depths and spatial/time resolutions of various imaging techniques, the multimodal imaging within one instrumental device is more applicable and superior. The urgent demand of T1–T2 dual-modal MRI techniques is the development of new and excellent dual-modal contrast agents (DMCAs). The integration of iron oxide (magnetite and maghemite) nanoparticles and Gd species in a “core–shell” format has been developed as DMCAs recently.[8] However, the magnetic field generated by a superparamagnetic nanoparticle perturbs the relaxation process of the paramagnetic species outside the iron oxide nanoparticle (Figure 1a) because of the strong magnetic coupling and high susceptibility effect of T1 contrast materials, which induces an undesirable decrease of the T1 signal.[8c] In general, the superparamagnetic T2 contrast material easily generates an induced magnetic field by an external magnetic field and may affect the electronic spins of paramagnetic T1 contrast materials depending on their locations (Figure 1). The inside T1 contrast material exhibits parallel spin ordering with the same direction of magnetic field induced by the T2 contrast material. Therefore, T2 contrast material increases the local magnetic field intensity of the T1 contrast material (Figure 1b), resulting in greater impact on T1 relaxation rates, and finally enhances the T1 contrast effect. Based on this rationale, we report herein a new and convenient strategy to design a synergistically enhanced T1–T2 DMCA.
Figure 1.
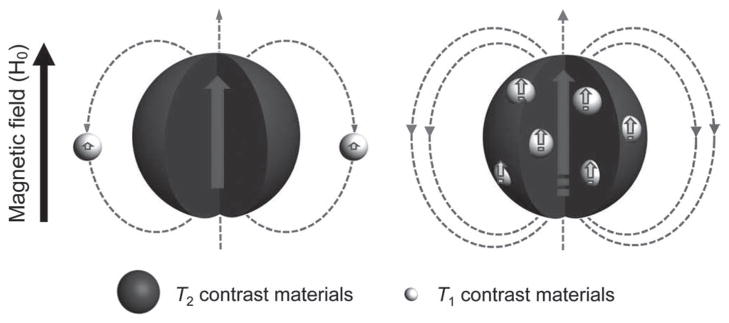
Two spin phenomena between T2 and T1 contrast materials with different locations. a) The local magnetic field intensity of T1 contrast materials is reduced when located outside of the T2 contrast material. b) The local magnetic field strengths of T1 and T2 contrast materials are enhanced simultaneously when T1 contrast materials are located inside the T2 contrast materials.
The synthetic strategies of superparamagnetic nanoparticles have been widely developed using different precursors, such as iron(III) acetylacetonate, Fe(CO)5, and iron oleate.[9] The thermal decomposition of the mixture of iron oleate and gadolinium oleate can produce monodisperse Gd2O3-embedded iron oxide (GdIO) nanoparticles on a large scale. The inner location of Gd2O3 in iron oxide nanoparticles ensures the spin order of GdIII has the same direction as the local magnetic field induced by the superparamagnetic nanoparticle under an external magnetic field, which increases the relaxivity of Gd2O3 and enhances the T1 contrast effect. Meanwhile, the collection and cooperation of GdIII spin order, which has the identical direction with the magnetization of the iron oxide nanoparticle, significantly increases the local magnetic field of the T2 contrast material, and further enhances the T2 contrast effect.
The synthesis of GdIO nanoparticles is rather straightforward: we employed the mixture of iron oleate and gadolinium oleate precursors to undergo a thermal decomposition process in 1-octadecene (ODE) containing oleic acid (OA) as a surfactant. Transmission electron microscopy (TEM) images showed that the as-synthesized GdIO nanoparticles are nearly monodisperse (~14 nm in diameter) with high crystallinity (Figure 2a). The energy-dispersive X-ray (EDX) element mapping and line scanning analysis indicated that the distribution of Gd2O3 ultrasmall clusters in iron oxide nanoparticles is homogeneous (Figure 2b, c). The inductively coupled plasma atomic emission spectroscopy (ICP-AES) analysis confirmed that the molar ratio of Fe and Gd in the as-prepared GdIO nanoparticles is about 12.7:1. We can also tune the Fe/Gd ratio in the GdIO nanoparticles (Supporting Information, Figure S1) by controlling the molar ratio of the precursors. The X-ray photoelectron spectroscopy (XPS) analysis of GdIO nanoparticles showed two peaks at 710.1 (Fe 2p3/2) and 723.5 eV (Fe 2p1/2), corresponding to the magnetite phase (Supporting Information, Figure S2). The thermal decomposition of iron oleate alone produced monodisperse magnetite nanoparticles (~14 nm in diameter),[9c] which is consistent with the XPS data (Supporting Information, Figure S2). Selected area electron diffraction (SAED) and X-ray diffraction (XRD) patterns (Figure 2d, e) of GdIO nanoparticles exhibited the mixed diffraction peaks assigned to the spinel structure of magnetite (the characteristic diffraction peaks of (220), (311), (400), and (440)) and cubic Gd2O3 (the characteristic peaks of (400) and (440)), which are different from the doped ferrites using transitional metals (e.g., Mn, Co, and Zn) with inverse spinel or normal spinel crystalline structures.[10] The possible reason is that the size of GdIII ions (93.8 pm in radius) is too large to occupy the tetrahedral or octahedral positions in the spinel structure.
Figure 2.

Characterization of GdIO nanoparticles. a) Representative TEM image of monodisperse GdIO nanoparticles (inset: HRTEM image). b) EDX line profiles (inset: a scanning TEM image with high angle annular dark field, STEM-HAADF image) across a GdIO nanoparticle. c) EDX mapping images of GdIO nanoparticles. d) SAED and e) XRD patterns of GdIO nanoparticles. The mixed diffraction peaks are assigned to the spinel structure of magnetite (dark, JCPDS No. 65-3107) and cubic Gd2O3 (grey, JCPDS No. 00-011-0604).
Standard zero-field cooling (ZFC) and field cooling (FC) measurements (Supporting Information, Figure S3) gave the estimated blocking temperature of about 150 K for GdIO nanoparticles. The field-dependent magnetization (M–H) curves indicated that the saturated magnetization of GdIO nanoparticles (~26.5 emu g−1) is much lower than that of magnetite nanoparticles with similar size (~65 emu g−1) at 300 K (Figure 3). Moreover, the continuous growth of magnetization along with the applied magnetic field for GdIO nanoparticles (Figure 3a) is probably due to the enhanced spin canting effect in the surface layer of GdIO nanoparticles after Gd2O3 embedding,[11] which may be responsible for the partially paramagnetic property of GdIO nanoparticles.[5a,12] The characteristic M–H curves of GdIO nanoparticles are similar to those of the high-spin paramagnetic rare-earth materials and superparamagnetic nanoparticles,[13] suggesting that GdIO nanoparticles may exhibit both superparamagnetic and paramagnetic behaviors.
Figure 3.

Magnetic properties. Field-dependent magnetization curves (M–H) of a) GdIO nanoparticles and b) magnetite nanoparticles at 5 and 300 K, respectively.
We used the conjugates of a dendritic molecule and 1-hexadecylamine (denoted as HDA-G2) to make nanoparticles water-soluble through a micelle formation procedure (Supporting Information, Figure S4). Dendritic molecules have great potential for use in surface engineering and biomedical applications.[14] We then used Fourier-transform infrared (FT-IR) spectroscopy to characterize the changes on the surface of nanoparticles after HDA-G2 was applied (Supporting Information, Figure S5). The weak stretching mode of C=O at 1654 cm−1 suggests the trace amount of OA molecules on the surface of as-synthesized nanoparticles. This peak was significantly enhanced after the coating of HDA-G2, indicating an increase in the proportion of carbonyl groups on the particle surface. The greatly enhanced peak at 2922 cm−1 corresponds to enhanced C–C vibration of the alkyl chain. Meanwhile, a new band at 3291 cm−1 related to a N–H vibration was found after coating. These results demonstrated the successful coating of HDA-G2 on the surface of the nanoparticles. TEM images and dynamic light scattering (DLS) analysis indicated that the nanoparticles maintain the monodispersity in water and PBS buffer (Supporting Information, Figure S4, S5). The solution can be stored at 4 °C for more than 6 months without any aggregation (Supporting Information, Figure S4). Moreover, because of the special structure of the dendron molecules, each of them has four terminal amine groups. Thereby, a large number of free amine groups are available on the surface of the water-dispersible nanoparticles, allowing for further functionalization.
We then investigated the ability of GdIO nanoparticles as a DMCA for MRI using magnetite nanoparticles (~14 nm in diameter) and Gd2O3 nanoparticles (~2 nm in diameter)[15] as two control samples. To compare the MR contrast enhancement effect of these three samples, we acquired multiecho gradient echo sequence images by T1–T2 dual mode at different metal concentrations (Figure 4). With increased metal concentrations of GdIO nanoparticles, we indeed observed reduced signals in T2-weighted MR images and increased signals in T1-weighted MR images (Figure 4a), indicating that GdIO nanoparticles can act as both negative and positive contrast agents. The magnetite nanoparticles had an excellent T2 contrast enhancement effect but no obvious T1 contrast effect (Figure 4b), and the Gd2O3 nanoparticles showed a strong T1 contrast enhancement effect but no evident T2 contrast effect (Figure 4c). Embedding Gd2O3 nanoclusters in one superparamagnetic nanoparticle entity can avoid the spin coupling between T2 contrast materials (i.e., superparamagnetic magnetite nanoparticles) and T1 contrast materials (i.e., Gd2O3 nanoclusters), which minimizes the attenuation of the local magnetic field of T1 contrast materials. The higher local magnetic field induces a greater impact on the relaxation of water protons. By taking advantage of the mutually enhanced magnetic field intensities between each other under an external magnetic field (the constant of a MRI scanner), which may significantly increase the local magnetic field of the T1 and T2 contrast materials, GdIO nanoparticles should exhibit an enhanced contrast effect in both T1 and T2 imaging. To test this hypothesis, we used longitudinal and transverse relaxivity values (ri, i = 1, 2) to quantitatively evaluate the MR contrast enhancements. The r2 values of GdIO and magnetite nanoparticles are 146.5 ± 2.25 and 125.4 ± 0.95 mM−1 S−1 in terms of Fe, respectively (Figure 4d); and the r1 values of GdIO and Gd2O3 nanoparticles are 69.5 ± 3.06 and 12.1 ± 0.59 mM−1 S−1 in terms of Gd, respectively (Figure 4e). The r1 and r2 values of GdIO nanoparticles are both higher than those of the corresponding Gd2O3 and magnetite nanoparticles, respectively, indicating the presence of the mutually enhanced character for GdIO nanoparticles as DMCAs. Compared to the magnetite nanoparticles, the slight increase of T2 contrast effect of the GdIO nanoparticles may be due to the contribution of T2 shortening by Gd2O3 nanoclusters in GdIO nanoparticles. It is of note that GdIO nanoparticles have about a 5 times higher r1 value than Gd2O3 nanoparticles. It is known that both T1 contrast materials (e.g., paramagnetic agents) and T2 contrast materials (e.g., superparamagnetic agents) can shorten the T1 relaxation time.[2] The possible reasons for the high r1 value of the GdIO nanoparticles are the enhanced T1 contrast effect of the Gd2O3 clusters (especially the Gd2O3 clusters close to the surface of nanoparticles[2]) induced by T2 contrast materials, the cooperation of a large number of GdIII ions in Gd2O3 clusters,[16] as well as the partial contribution of T1 shortening by iron oxide nanoparticles.[17] Because of the high susceptibility effect of T1 contrast materials, the slight increase of local magnetic field intensity may lead to the significant impact on relaxation rates and result in high T1 contrast effects. These results demonstrated the synergistic enhancement of r1 and r2 relaxivity in GdIO nanoparticles and motivated us to examine the application of GdIO nanoparticles as a novel DMCA for in vivo MR imaging.
Figure 4.

Synergistic enhancement of T1 and T2 contrast effects. T1- and T2-weighted MR images of a) GdIO nanoparticles, b) magnetite nanoparticles, and c) Gd2O3 nanoparticles at different metal concentrations in water (containing 1% agarose gel). d, e) The analysis of relaxation rate R2 (R1) vs. Fe (or Gd) concentration for nanoparticles in water: GdIO nanoparticles (grey), magnetite nanoparticles (d, dark) and Gd2O3 nanoparticles (e, dark). The relaxivity values r2 (r1) were obtained from the slopes of linear fits of experimental data. The phantom study was performed on a 0.5 T MRI scanner.
Before in vivo imaging, we tested the cytotoxicity of water-dispersible GdIO nanoparticles in HeLa and HepG2 cells with and without external magnetic fields (1000 G). Note that the uptake of GdIO nanoparticles was low in HepG2 cells (Supporting Information, Figure S6). The 3-(4,5-dimethylthiazol-2-y1)-2,5-diphenyltetrazolium bromide (MTT) assay (24 and 48 h) showed that more than 85% of cells were viable, indicating that GdIO nanoparticles have little to no cytotoxicity even at the maximum concentration (80 μg Fe mL−1; Supporting Information, Figure S7). Histological assessment of tissues revealed no organ abnormalities or lesions in control or GdIO nanoparticles-treated mice (Supporting Information, Figure S7), indicating that GdIO nanoparticles are biocompatible. More extensive tests are needed in the future because nephrogenic systemic fibrosis (NSF), the relevance of gadolinium toxicity in humans, has been reported.[18]
We then conducted the T1–T2 dual-modal in vivo MR imaging for GdIO nanoparticles with a 7 T MRI scanner. Using a BALB/c mouse as a model, we acquired the T1- and T2-weighted MR images sequentially before and after the intravenous injection of GdIO nanoparticles, with a dose of 2.0 mg Fe kg−1 of mouse body weight. Because of the high accumulation of nanoparticles in the mononuclear phagocyte system (MPS), especially the hepatic Kupffer cells in the liver,[19] we focused on the liver as the targeting region by taking both coronal and transverse images. T1-weighted MR images exhibited a significantly brighter signal, and an obviously darker signal was found in T2-weighted MR images at both coronal and transverse planes in the liver at the 1 h time point post-administration (Figure 5a, b). The analysis of MR signal changes in the liver region indicated that there are big intensity changes of approximately 54% and 75% in T1 and T2 imaging, respectively (Supporting Information, Table S1). These results demonstrated that GdIO nanoparticles have the unique ability to simultaneously show strong MR contrast enhancement both in T1 and T2 imaging in vivo, which can provide more comprehensive imaging information and lead to higher diagnostic accuracy, particularly in the detection and diagnosis of lesions in the liver (it is still difficult to differentiate tumor-associated macrophages from tumors in living subjects because the resolution of MRI is usually at the sub-millimeter level).
Figure 5.

Simultaneous T1 and T2 imaging of liver and hepatic tumor on a 7 T MRI scanner, respectively. a) T1- and b) T2-weighted in vivo MR images of BALB/c mice (top: coronal plane, bottom: transverse plane) before and after intravenous injection of GdIO nanoparticles with a dose of 2.0 mg kg−1. The regions of liver in the coronal planes were circled by dash lines. c) T1- and d) T2-weighted in vivo MR images of nude mice orthotopically inoculated with HepG2 liver cancer cells (sagittal plane) before and after intravenous injection of GdIO nanoparticles with a dose of 2.0 mg Fe kg−1. Grey arrows: gallbladder, black arrows: liver, white dotted circles and white arrows: liver tumor.
T1 and T2 imaging of an orthotopic liver cancer model in mice using GdIO nanoparticles as contrast agents was accomplished. Compared to the surrounding normal liver tissues, the hepatic tumors tend to have a very low uptake of nanoparticles because they contain few active Kupffer cells and macrophages (Supporting Information, Figure S8).[19b,c] After the intravenous injection of GdIO nanoparticles (2.0 mg Fe kg−1), we acquired the T1- and T2-weighted MR images sequentially and detected the lesions in liver at the sagittal plane evidently because the contrast between lesions and surrounding liver tissues has been improved (Figure 5c, d). Due to the different uptake ability of tumor and liver tissues, we can easily differentiate the liver lesions from normal liver tissues by MR imaging through pseudo-negative (Figure 5c; Supporting Information, Figure S9) and pseudo-positive (Figure 5d) contrast effects.[20] The changes in tumor-to-liver contrast were about 83% and 137% in T1 and T2 imaging, respectively (Supporting Information, Table S2). The self-confirmed dual-modal MR imaging can greatly improve the accuracy of cancer detection, which is of importance in clinical diagnosis.
In summary, we have developed the novel GdIO nanoparticles that can act as a T1–T2 mutually enhanced dual-modal contrast agent for MR imaging of liver and hepatic tumor detection with great accuracy in mice. Embedding Gd species (e.g., Gd2O3) into superparamagnetic iron oxide nanoparticles leads to enhanced local magnetic field strengths by each other under an external magnetic field, resulting in the synergistic enhancement of r1 and r2 relaxivity. The strategy demonstrated here may open up a new avenue for the design of new T1–T2 DMCAs. [21] The facile and reproducible synthetic method and surface coating strategy, the highly potential biocompatibility, and the capability of displaying enhanced T1 and T2 MR signals in vitro and in vivo promise the tremendous potential biomedical and clinical applications of GdIO nanoparticles in MR imaging with self-confirmation and great accuracy.
Experimental Section
Synthesis of GdIO Nanoparticles
The monodisperse GdIO nanoparticles were synthesized through thermal decomposition of metal oleate complexes. Briefly, iron oleate (0.923 g, 1 mmol), gadolinium oleate (0.1 g, 0.1 mmol), and oleic acid (0.17 mL, 0.55 mmol) were mixed in a three neck bottle flask containing 1-octadecene (15 mL). The solution was heated to reflux for 2 h with a heating rate of 5 °C min−1 under inert atmosphere. The resulting solution was then cooled to room temperature, and was added with isopropyl alcohol (60 mL) to precipitate the nanoparticles. The product was collected by centrifugation and finally redispersed in hexane for further use. Synthesis of magnetite and Gd2O3 nanoparticles followed the similar procedures for GdIO nanoparticles, and is detailed in the Supporting information.
In Vivo MR Imaging
Animal experiments were performed according to a protocol approved by the Animal Care Committee of Xiamen University, China. In vivo MR imaging studies were performed on a 7 T MRI scanner (Varian). The orthotopic liver cancer model was established by injection of HepG2 cells (~1 × 10⁶ in 50 μL of PBS) into the liver of female athymic nude mice. The mice were subjected to imaging studies about 2 weeks after inoculation. T1 and T2 imaging of mice (normal BALB/c mice and orthotopic HepG2 tumor model) were acquired sequentially before and after intravenous injection of 0.2 mL of HDA-G2-coated GdIO nanoparticles (2.0 mg Fe kg−1 of mouse body weight). We used a fast spin echo multislice (fSEMS) sequence with the following parameters: TR/TE = 4000/40 ms (T2), TR/TE = 300/10 ms (T1), FOV 50 × 50 mm2, slice thickness 1 mm, number of slices 3, 256 × 256 matrices, average = 4.
Supplementary Material
Acknowledgments
This work was supported by the National Science Foundation of China (21021061, 81000662, 21222106, and J1030415), the Fundamental Research Funds for the Central Universities (2010121012), and the Program for New Century Excellent Talents in University (NCET-10-0709).
Footnotes
Supporting information is available from the Wiley Online Library or from the author.
Contributor Information
Zijian Zhou, State Key Laboratory of Physical Chemistry of Solid Surfaces, The Key Laboratory for Chemical Biology of Fujian Province, and Department of Chemical Biology, College of Chemistry and Chemical Engineering, Xiamen University, Xiamen 361005, P. R. China.
Dengtong Huang, State Key Laboratory of Physical Chemistry of Solid Surfaces, The Key Laboratory for Chemical Biology of Fujian Province, and Department of Chemical Biology, College of Chemistry and Chemical Engineering, Xiamen University, Xiamen 361005, P. R. China.
Jianfeng Bao, Department of Electronic Science and Fujian Key Laboratory of Plasma and Magnetic Resonance, Xiamen University, Xiamen 361005, P. R. China.
Qiaoli Chen, State Key Laboratory of Physical Chemistry of Solid Surfaces, The Key Laboratory for Chemical Biology of Fujian Province, and Department of Chemical Biology, College of Chemistry and Chemical Engineering, Xiamen University, Xiamen 361005, P. R. China.
Dr. Gang Liu, Center for Molecular Imaging and Translational Medicine, School of Public Health, Xiamen University, Xiamen 361005, P. R. China
Prof. Zhong Chen, Department of Electronic Science and Fujian Key Laboratory of Plasma and Magnetic Resonance, Xiamen University, Xiamen 361005, P. R. China
Dr. Xiaoyuan Chen, Center for Molecular Imaging and Translational Medicine, School of Public Health, Xiamen University, Xiamen 361005, P. R. China. Laboratory of Molecular Imaging and Nanomedicine, National Institute of Biomedical Imaging and Bioengineering, National Institutes of Health, Bethesda, MD 20892, USA
Prof. Jinhao Gao, Email: jhgao@xmu.edu.cn, State Key Laboratory of Physical Chemistry of Solid Surfaces, The Key Laboratory for Chemical Biology of Fujian Province, and Department of Chemical Biology, College of Chemistry and Chemical Engineering, Xiamen University, Xiamen 361005, P. R. China. Center for Molecular Imaging and Translational Medicine, School of Public Health, Xiamen University, Xiamen 361005, P. R. China
References
- 1.Liang ZP, orth PC. Principles of MagneticResonance Imaging: A Signal Processing Perspective. Wiley-IEEE Press; 1999. [Google Scholar]
- 2.McRobbie DW, Moore EA, Graves MJ, Prince MR. MRI from Picture to Proton. Cambridge University Press; Cambridge: 2003. [Google Scholar]
- 3.a) Laurent S, Forge D, Port M, Roch A, Robic C, Elst LV, Muller RN. Chem Rev. 2008;108:2064. doi: 10.1021/cr068445e. [DOI] [PubMed] [Google Scholar]; b) Na HB, Song IC, Hyeon T. Adv Mater. 2009;21:2133. [Google Scholar]
- 4.Caravan P, Ellison JJ, McMurry TJ, Lauffer RB. Chem Rev. 1999;99:2293. doi: 10.1021/cr980440x. [DOI] [PubMed] [Google Scholar]
- 5.a) Kim BH, Lee N, Kim H, An K, Park YI, Choi Y, Shin K, Lee Y, Kwon SG, Na HB, Park JG, Ahn TY, Kim YW, Moon WK, Choi SH, Hyeon T. J Am Chem Soc. 2011;133:12624. doi: 10.1021/ja203340u. [DOI] [PubMed] [Google Scholar]; b) Tromsdorf UI, Bruns OT, Salmen SC, Beisiegel U, Weller H. Nano Lett. 2009;9:4434. doi: 10.1021/nl902715v. [DOI] [PubMed] [Google Scholar]
- 6.a) Cheon J, Lee JH. Acc Chem Res. 2008;41:1630. doi: 10.1021/ar800045c. [DOI] [PubMed] [Google Scholar]; b) McCarthy JR, Weissleder R. Adv Drug Delivery Rev. 2008;60:1241. doi: 10.1016/j.addr.2008.03.014. [DOI] [PMC free article] [PubMed] [Google Scholar]; c) Gao JH, Gu HW, Xu B. Acc Chem Res. 2009;42:1097. doi: 10.1021/ar9000026. [DOI] [PubMed] [Google Scholar]; d) Cai WB, Chen XY. J Nucl Med. 2008;49:113S. doi: 10.2967/jnumed.107.045922. [DOI] [PubMed] [Google Scholar]; e) He XX, Gao JH, Gambhir SS, Cheng Z. Trends Mol Med. 2010;12:574. doi: 10.1016/j.molmed.2010.08.006. [DOI] [PMC free article] [PubMed] [Google Scholar]
- 7.Seo WS, Lee JH, Sun XM, Suzuki Y, Mann D, Liu Z, Terashima M, Yang PC, McConnell MV, Nishimura DG, Dai HJ. Nat Mater. 2006;5:971. doi: 10.1038/nmat1775. [DOI] [PubMed] [Google Scholar]
- 8.a) Bae KH, Kim YB, Lee Y, Hwang J, Park H, Park TG. Bioconjugate Chem. 2010;21:505. doi: 10.1021/bc900424u. [DOI] [PubMed] [Google Scholar]; b) Yang H, Zhuang YM, Sun Y, Dai AT, Shi XY, Wu DM, Li FY, Hu H, Yang SP. Biomaterials. 2011;32:4584. doi: 10.1016/j.biomaterials.2011.03.018. [DOI] [PubMed] [Google Scholar]; c) Choi JS, Lee JH, Shin TH, Song HT, Kim EY, Cheon J. J Am Chem Soc. 2010;132:11015. doi: 10.1021/ja104503g. [DOI] [PMC free article] [PubMed] [Google Scholar]
- 9.a) Sun SH, Zeng H. J Am Chem Soc. 2002;124:8204. doi: 10.1021/ja026501x. [DOI] [PubMed] [Google Scholar]; b) Sun SH, Zeng H, Robinson DB, Raoux S, Rice PM, Wang SX, Li GX. J Am Chem Soc. 2004;126:273. doi: 10.1021/ja0380852. [DOI] [PubMed] [Google Scholar]; c) Park J, An KJ, Hwang YS, Park JG, Noh HJ, Kim JY, Park JH, Hwang NM, Hyeon T. Nat Mater. 2004;3:891. doi: 10.1038/nmat1251. [DOI] [PubMed] [Google Scholar]; d) Park J, Lee E, Hwang NM, Kang MS, Kim SC, Hwang Y, Park JG, Noh HJ, Kini JY, Park JH, Hyeon T. Angew Chem Int Ed. 2005;44:2872. doi: 10.1002/anie.200461665. [DOI] [PubMed] [Google Scholar]; e) Wei ZH, Zhou ZJ, Yang M, Lin CH, Zhao ZH, Huang DT, Chen Z, Gao JH. J Mater Chem. 2011;21:16344. [Google Scholar]
- 10.a) Lee JH, Huh YM, Jun YW, Seo JW, Jang JT, Song HT, Kim S, Cho EJ, Yoon HG, Suh JS, Cheon J. Nat Med. 2007;13:95. doi: 10.1038/nm1467. [DOI] [PubMed] [Google Scholar]; b) Jang JT, Nah H, Lee JH, Moon SH, Kim MG, Cheon J. Angew Chem Int Ed. 2009;48:1234. doi: 10.1002/anie.200805149. [DOI] [PubMed] [Google Scholar]
- 11.a) Coey JMD. Phys Rev Lett. 1971;27:1140. [Google Scholar]; b) Morales MP, Veintemillas-Verdaguer S, Montero MI, Serna CJ, Roig A, Casas L, Martinez B, Sandiumenge F. Chem Mater. 1999;11:3058. [Google Scholar]; c) Kodama RH, Berkowitz AE, McNiff EJ, Foner S. J Appl Phys. 1997;81:5552. [Google Scholar]; d) Linderoth S, Hendriksen PV, Bodker F, Wells S, Davies K, Charles SW, Morup S. J Appl Phys. 1994;75:6583. [Google Scholar]
- 12.a) Anhoj TA, Bilenberg B, Thomsen B, Damsgaard CD, Rasmussen HK, Jacobsen CS, Mygind J, Morup S, Magn J. Magn Mater. 2003;260:115. [Google Scholar]; b) Phan MH, Morales MB, Chinnasamy CN, Latha B, Harris VG, Srikanth H. J Phys D-Appl Phys. 2009;42:115007. [Google Scholar]
- 13.a) Ma S, Li WF, Li D, Xiong DK, Sun NK, Geng DY, Liu W, Zhang ZD. Phys Rev B. 2007;76:144404. [Google Scholar]; b) Goya GF, Berquo TS, Fonseca FC, Morales MP. J Appl Phys. 2003;94:3520. [Google Scholar]
- 14.a) Wang SH, Shi X, Van Antwerp M, Cao Z, Swanson SD, Bi X, Baker JR. Adv Funct Mater. 2007;17:3043. [Google Scholar]; b) Shi X, Wang SH, Swanson SD, Ge S, Cao Z, Van Antwerp ME, Landmark KJ, Baker JR. Adv Mater. 2008;20:1671. [Google Scholar]; c) Shi X, Thomas TP, Myc LA, Kotlyar A, Baker JJR. Phys Chem Chem Phys. 2007;9:5712. doi: 10.1039/b709147h. [DOI] [PubMed] [Google Scholar]
- 15.Mahajan SV, Dickerson JH. Nanotechnology. 2007;18:325605. [Google Scholar]
- 16.a) Liang GL, Ronald J, Chen YX, Ye DJ, Pandit P, Ma ML, Rutt B, Rao JH. Angew Chem Int Ed. 2011;50:6283. doi: 10.1002/anie.201007018. [DOI] [PMC free article] [PubMed] [Google Scholar]; b) Park JY, Baek MJ, Choi ES, Woo S, Kim JH, Kim TJ, Jung JC, Chae KS, Chang Y, Lee GH. ACS Nano. 2009;3:3663. doi: 10.1021/nn900761s. [DOI] [PubMed] [Google Scholar]
- 17.Roch A, Gossuin Y, Muller RN, Gillis P, Magn J. Magn Mater. 2005;293:532. [Google Scholar]
- 18.Langer RD, Lorke DE, Neidl van Gorkom KF, Petroianu G, Azimullah S, Nurulain SM, Singh S, Fuchsjäger M. Eur J Radiol. 2012;81:2562. doi: 10.1016/j.ejrad.2011.10.032. [DOI] [PubMed] [Google Scholar]
- 19.a) Gao JH, Chen K, Xie RG, Xie J, Lee S, Cheng Z, Peng XG, Chen XY. Small. 2010;6:256. doi: 10.1002/smll.200901672. [DOI] [PMC free article] [PubMed] [Google Scholar]; b) Ba-Ssalamah A, Uffmann M, Saini S, Bastati N, Herold C, Schima W. Eur Radiol. 2009;19:342. doi: 10.1007/s00330-008-1172-x. [DOI] [PubMed] [Google Scholar]; c) Huang J, Bu LH, Xie J, Chen K, Cheng Z, Li XG, Chen XY. ACS Nano. 2010;4:7151. doi: 10.1021/nn101643u. [DOI] [PMC free article] [PubMed] [Google Scholar]
- 20.Pauleit D, Textor J, Bachmann R, Conrad R, Flacke S, Layer G, Kreft B, Schild H. Radiology. 2002;222:73. doi: 10.1148/radiol.2221001599. [DOI] [PubMed] [Google Scholar]
- 21.Donghyeuk C, Han A, Joong Pill P, Jai Keun K, Jei Hee L, Tae Hee K, Sang-Wook K. Small. 2009;5:571. [Google Scholar]
Associated Data
This section collects any data citations, data availability statements, or supplementary materials included in this article.