

Abstract
Background
Urine albumin excretion in the high normal range [urine albumin to creatinine ratio (UACR) 10–29 mg/g)] predicts hypertension in European-origin populations. However, the prognostic significance of UACR in the high normal range for incident hypertension is unclear in Indo-Asians. The objective of this study was to examine the relationship of normal to high normal levels of UACR and incident hypertension.
Methods
We conducted a nested cohort study within a cluster randomized controlled trial in Pakistan on 1272 normotensive non-diabetic adults aged ≥40 years with UACR <30 mg/g. Incident hypertension was defined as new onset of systolic blood pressure (SBP) ≥140 mmHg or diastolic ≥ 90 mmHg or initiation of antihypertensive therapy.
Results
A total of 920 (72.3%) participants completed the 2-year final follow-up. During this time, 105 (11.4%) developed incident hypertension. In the multivariable model, the odds [95% confidence interval (CI)] for incident hypertension were 2.45(1.21–4.98) for those in the fourth (top) quartile (≥6.1 mg/g) and 2.12 (1.04–4.35) in the third quartile (3.8–6.1 mg/g) compared to those in the lowest quartile (<2.8 mg/g). In addition, a significant interaction between UACR and baseline SBP was observed suggesting that the odds (95% CI) of incident hypertension with UACR were greater at lower baseline SBP (interaction P = 0.044).
Conclusions
High normal levels of albuminuria as measured by UACR predict hypertension in non-diabetic Indo-Asians, and this relationship may be enhanced in individuals with low baseline SBP. Further research is needed to assess the clinical applicability of these findings.
Keywords: albuminuria, ethnicity, hypertension
Introduction
Hypertension is the most important risk factor contributing to mortality worldwide—both in the developed and the developing world [1]. Determinants of hypertension are poorly understood; albuminuria in the high normal range (10–29 mg/day) is frequently associated with hypertension and independently predicts kidney disease progression and mortality in individuals with and without diabetes [2]. Recent data in western European origin populations describe urinary albumin excretion >6 mg/day as a predictor of development of hypertension [3–5].
Previously, we showed that children of Indo-Asian origin have higher body mass adjusted blood pressure (BP) levels compared to their white counterparts in the USA, thus suggesting an enhanced susceptibility of the former to hypertension [6]. Similar observations have been noted by others [7–9]. Migrant studies suggest that kidney disease progresses faster in Indo-Asians than in native European-origin populations [10–12] and may have a different etiopathology [13]. Albuminuria in the range of 30–300 mg/day is common in Indo-Asians, being twice as prevalent in native Indo-Asian adults with hypertension compared to the general population [14, 15]. Recently, a meta-analysis of 21 community-based cohorts, including ours from Pakistan, indicated that high normal levels of albuminuria [urine albumin to creatinine ratio (UACR) 10–29 mg/g] are associated with cardiovascular and all-cause mortality [2]. However, it remains uncertain whether these high normal levels of urine albumin are predictive of hypertension in Indo-Asian populations and given the foregoing, cannot be assumed to be identical to the association observed in Europeans. Further adding to the complexity is the low muscle mass and reduced creatinine excretion in Indo-Asians [16]. This could lead to overestimation of albuminuria ascertained from UACR in a random urine sample. Moreover, the prognostic value of high normal levels of UACR in terms of absolute risk prediction, especially in comparison to other key determinants of hypertension in the clinical setting remains to be assessed. This information is especially relevant for Indo-Asians residing in resource-scarce countries worldwide.
We analyzed the relationship between UACR within the normal range and incident hypertension in 920 normotensive non-diabetic adults aged ≥40 years nested in our Control of Blood Pressure and Risk Attenuation (COBRA) trial—a community-based intervention study over 2 years in Karachi. We hypothesized that levels of albuminuria considered within the conventional normal to high normal range (UACR 6–29 mg/g) predicts the onset of hypertension in normotensive non-diabetic adult Indo-Asians.
Materials and methods
Study setting
This was a cohort study embedded within a factorial design cluster randomized controlled trial. Further design details have been published [14, 17], but in brief, a population-based sample of households in Karachi were randomized to family-based home health education (HHE) to encourage healthy lifestyles versus no intervention. In addition, adults aged ≥40 years with hypertension were re-randomized to General Practitioners trained in the management of hypertension versus usual care. Ethical approval was obtained from the Aga Khan University Ethics Review Committee. For this study, all normotensive subjects aged ≥40 years in the population-based approach were eligible.
Sampling frame
In brief, using a multistage random sampling technique, we selected 12 of 4200 low to middle income (mean household monthly income $70) geographical census-based clusters (∼250 households listed in each cluster) in Karachi, the most populous city in Pakistan with 16 million inhabitants.
Baseline screening
All households in each of the 12 clusters were visited, and informed consent was obtained for screening from all adults aged ≥40, who then underwent measurement of BP three times with a calibrated automated device (Omron HEM-737 IntelliSense; Omron Healthcare Inc., Vernon Hills, IL) in the sitting position after 5 min of rest. The mean of the last two BP readings was considered as the final BP value for that visit. Those with an elevated BP on the initial visit and not on antihypertensive medication were visited again for re-measurement of BP 1–4 weeks after the initial visit. If BP were persistently elevated, they were classified as hypertensives; otherwise normotensives.
A routine physical examination was performed and the following information collected: (i) smoking status, food frequency and physical activity by questionnaire, the latter using the international physical activity questionnaire, (ii) measurement of BP as described above, (iii) anthropometry (height, weight and waist circumference) and (iv) laboratory tests for serum creatinine, fasting blood glucose (Synchron Cx-7/Delta; Beckman Coulter, Fullerton, CA) and lipid profile (Hitachi-912; Roche, Basel, Switzerland) [17]. A spot morning urine sample was collected for albumin (measured using nephelometry by the Array Systems method on a Beckman Coulter) and urine creatinine (Synchron Cx-7/Delta;). All assessments were performed to a standard protocol that conformed to international standards for definitions and measurements, and external quality control on albumin measurements were performed by the Bio-Rad Laboratories Inc, Irvine, CA. Serum creatinine measurements were calibrated at the Cleveland Clinic laboratory-reference laboratory, where serum creatinine levels were measured again using the Roche enzymatic creatinine assay (in duplicate) which is traceable to the National Institute of Standards and Technology creatinine reference measurement [18].
Eligible participants
Study participants were eligible for inclusion in the present investigation if they were: (i) adults aged ≥40 years, (ii) normotensive at baseline screening [systolic blood pressure (SBP) <140 mmHg and diastolic blood pressure (DBP) <90 mmHg and were not on any anti-hypertensive medication], (iii) non-diabetic at baseline (fasting blood glucose <7.0 mmol/L and were not on anti-diabetic medication) and (iv) had urine albumin excretion, i.e. UACR < 30 mg/g.
Follow-up procedure and outcomes assessment
For 2 years, the six clusters randomized to HHE received education on non-pharmacologic behavioral change, advice on healthy diets, physical activity and tobacco cessation. At 2 years after the baseline visit, trained outcomes assessors, independent of the baseline research team, evaluated all participants during the follow-up visit.
BP was measured thrice after 5 min of rest using the same procedures as at baseline, and the mean of the last two of the three readings was used for follow-up assessment. All subjects with new onset of elevated BP (SBP ≥ 140 mmHg or DBP ≥ 90 mmHg) were visited again for re-measurement of BP after 1–4 weeks for a confirmatory visit. For these subjects, the mean of the two readings from the follow-up visit and confirmatory was used for analysis.
Primary outcome
Incident hypertension during follow-up was defined as initiation of antihypertensive therapy at any stage of the 2 years of follow-up or SBP ≥ 140 mmHg or DBP ≥ 90 mmHg based on mean of the last two of three readings at the follow-up visit.
Statistical analysis
Data analysis was done using SPSS version 16.0. Baseline characteristics were analyzed for all eligible participants (n = 1272); however, the analyses related to primary outcome was restricted to those with available BP readings at follow-up (n = 920).
Continuous variables with normal and non-normal distributions were reported as mean (SD) and median [inter-quartile range (IQR)], respectively. We built multivariable models and performed logistic regression to assess the independent association of UACR at baseline with the primary outcome. Due to the skewed distribution of UACR, it was log transformed for the main analysis. The candidate predictor variables of interest at baseline in addition to log UACR in the logistic regression analysis included age, gender, physical activity, family history of hypertension, body mass index (BMI), waist circumference, SBP, DBP, fasting glucose, estimated glomerular filtration rate (eGFR) based on the Chronic Kidney Disease Epidemiology Collaboration (CKD-EPI) equation [19] and dietary factors (intake of fruit and vegetables and use of saturated fat). A forward stepwise selection method was used with an entry criterion of P = 0.1, and variables significantly associated with the outcome at P < 0.05 were retained in the final model. The multivariable model also accounted for clustering by census at the household level and treatment assignment to HHE. All P-values were two tailed and were considered statistically significant if <0.05.
In addition, two-way interaction terms of baseline SBP, waist circumference and sex were tested for log and categorical expressions of UACR with linear and categorical expression of baseline SBP. The models with categorical UACR introduced UACR as (i) binary variable dichotomized around median (4 mg/g) and as (ii) UACR quartiles (<2.8 mg/g, 2.8 to <3.8 mg/g, 3.8 to <6.1 mg/g and ≥ 6.1 mg/g). To explore the non-linear interaction, we compared the performance of model with and without interaction term between UACR quartiles and SBP by −2 Log likelihood. In addition, sensitivity analyses were performed including all eligible participants included in the study (n = 1272). For the missing BP values of 352 participants, the cluster mean BP values at the final follow-up visit were computed with available readings and assigned to missing last follow-up BP readings in those respective clusters [20]. This method of imputation of missing values has been shown to yield valid inferences and is recommended for large community trials [21]. In addition, sex-stratified analysis of the final model was performed. Finally, we also built multivariable models to assess the association of urine albumin concentration (UAC) (micrograms per liter) with incident hypertension, with and without accounting for measures of body composition (BMI, waist circumference) and urine creatinine excretion.
Results
Baseline characteristics
Of 3143 subjects aged ≥40 years initially screened during the baseline examination, 1871 were excluded from the present analysis for the following reasons: prevalent hypertension (SBP ≥ 140 mmHg, DBP ≥ 90 mmHg or use of antihypertensive medications; n = 1341 at baseline) [20], diabetes mellitus (fasting glucose ≥ 7.0 mmol/L or use of insulin or hypoglycemic medications; n = 246), UACR ≥ 30 mg/g (n = 40) and missing covariates (n = 244). After the above exclusions, 1272 (41%) subjects remained eligible. (Figure 1).
Fig. 1.

Derivation of study population from participants aged ≥40 years enrolled in Control of Blood Pressure and Risk Attenuation (COBRA) trial.
The median UACR (IQR) was 3.8 (2.8–6.1) mg/g. As shown in Table 1, a significant positive trend across UACR quartiles was observed for age, proportion of women, tobacco use, eGFR and fasting plasma glucose and a negative trend for BMI, waist circumference and serum creatinine.
Table 1.
Baseline characteristics according to quartiles of UACR (n = 1272)
| Characteristics | Quartile 1, n = 318 (<2.8 mg/g) | Quartile 2, n = 318 (2.8–3.8 mg/g) | Quartile 3, n = 318 (3.8–6.1 mg/g) | Quartile 4, n = 318 (≥6.1 mg/g) | P-value (trend) |
|---|---|---|---|---|---|
| Urine ACR, median (IQR) | 2.3 (2.0–2.6) | 3.32 (3.1–3.6) | 4.7 (4.2–5.3) | 8.3 (7.0–12.6) | |
| Mean age, years | 47.4 (7.7) | 48.4 (9.2) | 49.0 (9.3) | 51.9 (11.6) | <0.001 |
| Women, n (%) | 72 (22.6) | 142 (44.7) | 177 (55.7) | 190 (59.7) | <0.001 |
| Educational attainment, n (%)a | |||||
| Literate | 258 (81.1) | 237 (74.5) | 227 (71.4) | 200 (62.9) | <0.001 |
| Illiterate | 60 (18.9) | 81 (25.5) | 91 (28.6) | 118 (37.1) | |
| Tobacco usersb | |||||
| Past users | 28 (8.8) | 22 (6.9) | 30 (9.4) | 24 (7.5) | 0.002 |
| Current Users | 162 (50.9) | 135 (42.5) | 133 (41.8) | 112 (35.2) | |
| Never used | 128 (40.3) | 161 (50.6) | 155 (48.7) | 182 (57.2) | |
| HHE, n (%)c | 165 (51.9) | 161 (50.6) | 168 (52.8) | 178 (56.0) | 0.25 |
| BMI (kg/m2), mean (SD) | 25.2 (5.2) | 24.5 (5.2) | 24.4 (5.1) | 24.2 (5.3) | 0.03 |
| Waist circumference (cms), mean (SD) | 89.3 (12.3) | 86.5 (13.0) | 85.9 (11.5) | 85.3 (12.0) | <0.001 |
| SBP (mmHg), mean (SD) | 120 (10) | 121 (11) | 121 (10) | 122 (11) | 0.05 |
| DBP (mmHg), mean (SD) | 78 (7) | 78 (7) | 78 (8) | 78 (7) | 0.65 |
| Family history of hypertension, n (%) | 159 (50.0) | 139 (43.7) | 142 (44.7) | 132 (41.5) | 0.05 |
| Total physical activity (METs), n (%)d | |||||
| ≥840 | 171 (53.8) | 133 (41.8) | 142 (44.7) | 143 (45.0) | 0.06 |
| <840 | 147 (46.2) | 185 (58.2) | 176 (55.3) | 175 (55.0) | |
| eGFR (mL/min/1.73m2), median (IQR)e | 102.6 (92.6–108.9) | 106.3 (98.4–112.5) | 108.2 (97.9–115.7) | 105.1 (95.6–114.1) | <0.001 |
| Serum creatinine (μmo/L), mean (SD)f | 75.8 (50.8) | 65.2 (14.5) | 61.4 (17.0) | 60.7 (17.4) | <0.001 |
| Fasting blood glucose (μmol/L), mean (SD) | 5.2 (0.5) | 5.2 (0.5) | 5.3 (0.6) | 5.3 (0.6) | 0.009 |
| Serum cholesterol (mmol/L), mean (SD) | 4.7 (0.9) | 4.7 (0.9) | 4.8 (0.9) | 4.7 (0.9) | 0.75 |
aEducational attainment—illiterate: no formal education and cannot read or write at all; literate: can read and write with understanding or completed at least Grade 5 of formal education.
bTobacco use: current users either smoked or chewed tobacco at the time of survey. Past users smoked 100 cigarettes or chewed 100 pieces in their lifetime. Never-users smoked 100 cigarettes or chewed 100 pieces in their lifetime.
cHHE, a population-based approach in randomly selected areas versus none. During 2 years of follow-up, the six clusters randomized to HHE received education on non-pharmacologic behavioral change, advice on healthy diet, physical activity and tobacco cessation.
dTotal Physical activity METs (metabolic equivalents) Score was defined as follows: Total METs — minutes/week = walk (METs − minutes × days) + moderate (METs × minutes × days) + vigorous (METs × minutes × days).
eeGFR was calculated using CKD-EPI equation.
fSerum creatinine measurements were calibrated at the Cleveland Clinic reference laboratory.
Of the 1272 eligible participants, 920 (72.3%) completed the 2-year follow-up visit. (Figure 1) There was no significant difference in baseline median UACR (3.9 versus 3.8 mg/g, P = 0.16), mean baseline SBP (121 versus 121 mmHg, P = 0.41), mean baseline DBP (78 versus 78 mmHg, P = 0.86), mean BMI (24.7 versus 24.2 kg/m2, P = 0.09), mean waist circumference (86.9 versus 86.5 cm, P = 0.61), median eGFR (108 versus 106 mL/min/1.73m2, P = 0.18) or proportion of women (47 versus 42%, P = 0.083), between those with and those without a final BP measurement. However, the former were more likely to be younger (mean age 48.8 versus 50.3 years, P = 0.011) and with family history of hypertension (47 versus 39%, P = 0.015) than those with missing final BP.
Risk of incident hypertension
One hundred and five [11.4%, 95% confidence interval (CI): 9.5–13.6%] participants developed incident hypertension over the 2-year follow-up period. As shown in Table 2, the mean age (50.7 versus 48.5 years, P = 0.027), baseline SBP (127 versus 120 mmHg, P < 0.001), DBP (81 versus 78 mmHg, P < 0.001), baseline UACR (4.7 versus 3.8 mg/g, P = 0.001), BMI (25.8 versus 24.6, P = 0.029) and waist circumference (90.6 versus 86.4 cm, P = 0.001) were significantly greater among participants developing incident hypertension than in those remaining normotensive. The proportion of participants with incident hypertension increased with increasing levels of UACR quartiles (P = 0.005) (Table 2).
Table 2.
Characteristics of subjects with incident hypertension (n = 920)
| Characteristics | Persistent normotension, n = 805 (88.6) | Incident hypertensiona, n = 105 (11.4%) | P-value |
|---|---|---|---|
| Age (years), mean (SD) | 48.5 (9.4) | 50.7 (9.6) | 0.027 |
| Women, n (%) | 383 (47.0) | 51 (48.6) | 0.761 |
| HHE, n (%)b | 433 (53.1) | 61 (58.1) | 0.337 |
| Tobacco use, n (%)c | |||
| Never used | 419 (51.4) | 57 (54.3) | 0.218 |
| Past users | 61 (7.5) | 12 (11.4) | |
| Current users | 41.1 (34.3) | 36 (34.3) | |
| SBP (mmHg), mean (SD) | 120.1 (10.3) | 127.2 (9.3) | <0.001 |
| DBP (mmHg), mean (SD) | 77.6 (7.1) | 81.0 (7.3) | <0.001 |
| UACR, median (IQR) | 3.8 (2.8 to 6.2) | 4.7 (3.3 to 7.2) | 0.001 |
| BMI (kg/m2) mean (SD) | 24.6 (5.2) | 25.8 (4.8) | 0.029 |
| Waist circumference (cm), mean (SD) | 86.4 (12.1) | 90.6 (12.0) | 0.001 |
| Family history of hypertension, n (%) | 377 (46.3) | 56 (53.3) | 0.172 |
| Intake of vegetables (times/week), median (IQR) | 7 ( 5 to 11) | 8 (6 to 11) | 0.078 |
| Intake of fresh fruits (times/week), median (IQR) | 2 (1 to 7) | 2 (1 to 7) | 0.224 |
| Saturated fat users, n (%) | 543 (66.6) | 75 (71.4) | 0.324 |
| Total physical activity (METs), n (%)d | |||
| ≥840 | 370 (45.4) | 47 (44.8) | 0.902 |
| <840 | 445 (54.6) | 58 (55.2) | |
| UACR quartiles (median, IQR), n (%) | |||
| 1st Quartile (2.3, 2.0–2.6) | 208 (25.5) | 14 (13.3) | 0.005 |
| 2nd Quartile (3.3, 3.1–3.6) | 203 (26.1) | 22 (21.0) | |
| 3rd Quartile (4.7, 4.2–5.3) | 187 (22.9) | 30 (28.6) | |
| 4th Quartile (8.3, 7.0–12.6) | 207 (25.4) | 39 (37.1) | |
| eGFR (mL/min/1.73m2), median (IQR)e | 106.3 (97.3 – 114.1) | 104.1 (96.5 – 112.0) | 0.157 |
| Serum creatinine (μmol/L), mean (SD)f | 65.8 (34.9) | 65.2 (18.2) | 0.845 |
| Fasting blood glucose (mmol/L), mean (SD) | 5.3 (0.6) | 5.4 (0.5) | 0.105 |
| Serum cholesterol (mmol/L), mean (SD) | 4.7 (0.9) | 4.9 (0.9) | 0.076 |
aIncident hypertension was defined as new onset of mean SBP ≥ 140 mmHg or mean DBP ≥ 90 mmHg, confirmed on measurements on two separate days at least 2 weeks apart or initiation of antihypertensive medication.
bHHE, a population-based approach in randomly selected areas versus none. During 2 years of follow-up, the six clusters randomized to HHE received education on non-pharmacologic behavioral change, advice on healthy diet, physical activity and tobacco cessation.
cTobacco use: current users either smoked or chewed tobacco at the time of survey. Past users smoked 100 cigarettes or chewed 100 pieces in their lifetime. Never-users smoked 100 cigarettes or chewed 100 pieces in their lifetime.
dTotal Physical activity METs (metabolic equivalents) Score was defined as follows: Total METs − minutes/week = walk (METs − minutes × days) + moderate (METs × minutes × days) + vigorous (METs × minutes × days).
eeGFR was calculated using CKD-EPI equation.
fSerum creatinine measurements were calibrated at the Cleveland Clinic reference laboratory.
In the main multivariable analysis, baseline UACR, baseline SBP and waist circumference emerged as independent predictors of incident hypertension. The adjusted odds of developing hypertension were higher in the second (2.8–3.8 mg/g) through fourth (≥6.1 mg/g) quartiles of UACR compared with the first quartile (<2.8 mg/g), and the differences were significant for the third and fourth quartiles (Table 3). In the analysis using UACR as continuous variable, a 1 U increase in the log UACR was associated with an adjusted OR for incident hypertension of 1.46 (95% CI: 1.04–2.11, P = 0.042). No interaction was detected between UACR and waist circumference (P = 0.22), sex (P = 0.72) or age (P = 0.44) for incident hypertension.
Table 3.
Multivariable adjusted odds ratios of predicting variables for incident hypertension (n = 920)
| Baseline factors | Adjusted odds ratios (95% CI)a | P-value |
|---|---|---|
| Quartiles of UACR (median, IQR), (mg/g) | ||
| 1st Quartile (2.3, 2.0–2.6) | 1 (Reference) | |
| 2nd Quartile (3.3, 3.1–3.6) | 1.35 (0.65–2.81) | 0.42 |
| 3rd Quartile (4.7, 4.2–5.3) | 2.12 (1.04–4.35) | 0.039 |
| 4th Quartile (8.3, 7.0–12.6) | 2.45 (1.21–4.98) | 0.013 |
| SBP (mmHg) | 1.48 (1.30–1.68) for each 5 mmHg increase |
<0.001 |
| Waist circumference (cm) | 1.06 (1.01–1.12) for each 2.5 cm increase |
0.010 |
aModel adjusted for clustering by census, cluster assignment to HHE, age and gender.
Relationship between UACR and baseline SBP on incident hypertension
Although, no interaction was detected between log UACR with linear expression of SBP (interaction P = 0.96); the interaction between log UACR and categorical expression of SBP (P = 0.038) was significant. Moreover, the interaction between categorical expression of UACR with linear SBP [UACR dichotomized at median (4 mg/g) (interaction P = 0.044) and UACR quartiles (interaction P = 0.005)] was also significant. Interestingly, the direction of interaction indicated greater relative odds of incident hypertension with increase in baseline UACR at lower compared to higher levels of baseline SBP. Figure 2 illustrates the interaction between UACR dichotomized at median (4 mg/g) with continuous expression of SBP. The odds (95% CI) of incident hypertension in those with UACR of ≥4 mg/g compared with less were progressively greater at lower baseline SBP. However, the converse was observed around baseline SBP of ≥130 mmHg where the odds of incident hypertension were reduced and the 95% CI included 1.0, suggesting insignificant relationship at higher baseline SBP. Furthermore, the performance of the model with the interaction term between SBP and UACR quartiles had a significantly better fit than the model without (P = 0.002 for improvement in −2 Log likelihood) suggesting a non-linear interaction between UACR and SBP.
Fig. 2.
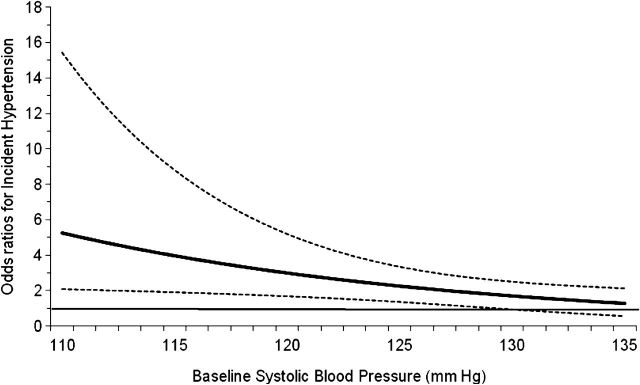
Relationship between high normal versus lower levels of albumin to creatinine ratio (UACR) and baseline SBP on incident hypertension. The solid horizontal line (––) at odds ratio of 1.0 indicates no difference between the participants with UACR < and >4 mg/g at various levels of baseline SBP. The solid (——) and dotted (… …) curved lines represent point estimates and 95% CIs for odds ratios. P-value for test of interaction between baseline SBP and UACR was 0.016.
Sensitivity analysis
The sensitivity analysis on subjects with imputed follow-up BP readings (n = 1272) revealed consistent results for the main association and the interaction term. The results of subgroup analysis stratified by sex were also consistent with the main findings of increasing odds of hypertension with increase in UACR (quartiles, dichotomized at median, log UACR). These associations also reached statistical significance with different expressions of UACR in the multivariable models [UACR quartiles and UACR dichotomized at median in women (P = 0.056 and 0.026, respectively) and log UACR in men (P = 0.051)].
The mean (SD) and median (IQR) UAC in the subjects were 5.2 (5.2) mg/L and 3.3 (2.1–6.1) mg/L, respectively. The main results for the analysis with UAC were consistent in terms of association with incident hypertension and became statistically more significant after accounting for urinary creatinine concentration.
Discussion
Our findings from a non-diabetic normotensive Indo-Asian cohort indicate a predictive relationship of albuminuria for incident hypertension. About 11% of individuals developed new onset hypertension at 2 years. Those with higher levels of baseline UACR had a greater risk of developing hypertension, the risk becoming apparent at UACR ≈ 4 mg/g and above. However, this risk was more pronounced at lower levels of baseline SBP. Thus, our findings provide clear evidence of prognostic relationship of UACR with incident hypertension in Indo-Asians, especially among those with lower levels of SBP.
The mechanisms postulated to play a role in the link between albuminuria and hypertension include a combination of systemic and glomerular vascular abnormalities [22–25]. The interaction indicating a more pronounced association of UACR on incident hypertension at lower versus higher baseline SBP is being reported for the first time. While these findings need confirmation, they suggest that generalized microvascular damage might play a prominent role in the onset of hypertension in a subset of Indo-Asian individuals. Further studies are needed to determine the underlying pathophysiology or susceptibility factors for hypertension in these individuals. Regardless of the underlying mechanism, our findings underscore the importance of albuminuria within the range considered to be normal to high normal (i.e. 6–29 mg/g) and perhaps even lower as risks were evident at 4 mg/g, as a potential biomarker for the identification of Indo-Asians at high risk for developing hypertension, especially those who are less likely to be detected by conventional screening tools such as high baseline BP levels. However, the clinical application of these findings remains to be evaluated with regard to cost effectiveness of screening of UACR, especially in resource-scarce settings. More research in low cost innovative technologies for mass screening for UACR is needed.
It also remains to be determined whether the risk of hypertension associated with albuminuria in the high normal range is modifiable, especially since a recent meta-analysis suggests a high associated risk of cardiovascular and all-cause mortality with these levels [2]. Healthy behaviors including low dietary sodium and maintenance of optimal body weight are effective population-wide strategies to lower BP levels, observable also in Indo-Asians [26]. In addition, some studies suggest that blockers of the renin angiotensin system may prevent new onset hypertension in those with high normal BP [27–29]. These agents have been shown to lower albuminuria [30, 31]. Further in-depth research is needed to evaluate the potential impact of such interventions on lowering urine albumin levels and whether in turn, this could mediate beneficial effects on BP reduction.
There have been concerns that the UACR measurement overestimates urine albumin excretion in individuals with low muscle mass and thus is not a true measure of disease and therefore unlikely to be associated with adverse cardiovascular outcomes [32]. The trend in lower BMI with increasing quartiles of UACR in our study supports that notion. Furthermore we have previously shown that Indo-Asians have lower rates of urine creatinine excretion than expected from data in European populations [16]. However, we have also shown that the UACR has reasonable agreement with a timed urine collection for albumin in Indo-Asians [33]. Our current findings emphasize the validity of UACR even in the high normal range as a practical and reliable method of assessment of urine albumin excretion in Indo-Asians. Further research is needed for the clinical translation of our findings to be put into practice, including consideration for revision of the definition of ‘normal’ albuminuria range measured by UACR, which must be based on hard clinical outcomes. Thus, our findings have substantial health implications for Indo-Asians worldwide.
The study has potential limitations. First, we tested only a single urine sample for urine albumin levels, which are known to vary significantly. Moreover, concomitant hematuria or pyuria was not ruled out as their presence may indicate transient albuminuria. However, the biological variability of urine albumin excretion is lowest when measured with UACR thus minimizing regression dilution bias which would tend to overestimate risk factor and disease association due to extreme values. Hence, a single urine test should provide reliable estimates of risks associated with UACR [34, 35]. Second, a greater proportion of participants with a family history of hypertension completed 2 years of follow-up. This creates the potential for selection bias of those at risk of hypertension in whom the relationship with UACR might be stronger, thereby compromising generalizability to lower risk populations. However, those with follow-up data were also younger, balancing the risk profile. Moreover, missing data on follow-up BP readings was replaced with cluster specific mean values on those remaining in the trial, thereby accounting for loss to follow-up and retaining all subjects in the cohort in the final analysis [20]. Furthermore it is possible that people with high levels of UACR had higher ambulatory or attenuated diurnal variation in BP levels. However, that phenomenon would be inconsistent with the observed stronger association of UACR with incident hypertension in those with lower levels of baseline SBP. Moreover, the interaction between baseline SBP and baseline UACR was not observed with concomitant linear expressions of SBP and UACR in the same model. However, a potential non-linear relationship with a threshold level between the variables required for expression of interaction can explain this variation, albeit this needs confirmation in other studies. Finally, some variation in sex-specific UACR thresholds is possible despite lack of detection of interaction between UACR and sex, which may be due to limited power in the study for subgroup analysis. However, the direction of the results for men and women was consistent with the overall findings. The major strengths of this study were its community-based sampling frame representative of Karachi, door-to-door data collection approach, consistent definition for defining hypertension both at baseline as well as on follow-up visits and the consistency of overall results in sensitivity analyses with alternative methods of expressing UACR (e.g. categorical, continuous, log transformed) and with analysis involving all those eligible for follow-up.
In conclusion, our prospective population-based study on Indo-Asians demonstrates that normal to high normal levels of albuminuria as measured by UACR are a strong predictor of hypertension, and the relationship between baseline UACR with incident hypertension may be more pronounced at low levels of baseline SBP. Future studies are needed to explore whether the relationship of albuminuria with incident hypertension is modifiable.
Conflict of interest statement
None declared.
Acknowledgements
We would like to thank all members of the Hypertension Research Group, over 40 field workers and the support staff for their assistance and cooperation.
Members of the Hypertension Research Group other than authors include: R. Bux, P. Cosgrove, A. Gilani, J Hatcher, A. Hameed, S. Hashmi, M. Islam, F. Jafary, A. Khan, M. Karim, Ms A. Khan, N. Poulter, M.A. Rabbani, M. Saleem, N.A. Syed and S. Zaidi.
Funding sources. Supported by an award from the Wellcome Trust, UK (070854/Z/03/Z to T.H.J., N.C.) and US-NIH-Fogarty International Center, USA (1R03TW007588-01A1 to T.H.J., A.S.L.).
References
- 1.Lopez AD, Mathers CD, Ezzati M, et al. Global and regional burden of disease and risk factors, 2001: systematic analysis of population health data. Lancet. 2006;367:1747–1757. doi: 10.1016/S0140-6736(06)68770-9. [DOI] [PubMed] [Google Scholar]
- 2.Matsushita K, van der Velde M, Astor BC, et al. Association of estimated glomerular filtration rate and albuminuria with all-cause and cardiovascular mortality in general population cohorts: a collaborative meta-analysis. Lancet. 2010;375:2073–2081. doi: 10.1016/S0140-6736(10)60674-5. [DOI] [PMC free article] [PubMed] [Google Scholar]
- 3.Brantsma AH, Bakker SJ, de Zeeuw D, et al. Urinary albumin excretion as a predictor of the development of hypertension in the general population. J Am Soc Nephrol. 2006;17:331–335. doi: 10.1681/ASN.2005111153. [DOI] [PubMed] [Google Scholar]
- 4.Wang TJ, Evans JC, Meigs JB, et al. Low-grade albuminuria and the risks of hypertension and blood pressure progression. Circulation. 2005;111:1370–1376. doi: 10.1161/01.CIR.0000158434.69180.2D. [DOI] [PubMed] [Google Scholar]
- 5.Forman JP, Fisher ND, Schopick EL, et al. Higher levels of albuminuria within the normal range predict incident hypertension. J Am Soc Nephrol. 2008;19:1983–1988. doi: 10.1681/ASN.2008010038. [DOI] [PMC free article] [PubMed] [Google Scholar]
- 6.Jafar TH, Islam M, Poulter N, et al. Children in South Asia have higher body mass-adjusted blood pressure levels than white children in the United States: a comparative study. Circulation. 2005;111:1291–1297. doi: 10.1161/01.CIR.0000157699.87728.F1. [DOI] [PubMed] [Google Scholar]
- 7.McKeigue PM, Miller GJ, Marmot MG. Coronary heart disease in south Asians overseas: a review. J Clin Epidemiol. 1989;42:597–609. doi: 10.1016/0895-4356(89)90002-4. [DOI] [PubMed] [Google Scholar]
- 8.Venkata C, Ram S. Hypertension and other cardiac risk factors among Asian Indians. Am J Hypertens. 1995;8:124s–127s. doi: 10.1016/0895-7061(95)00312-6. [DOI] [PubMed] [Google Scholar]
- 9.Balarajan R. Ethnic differences in mortality from ischaemic heart disease and cerebrovascular disease in England and Wales. BMJ. 1991;302:560–564. doi: 10.1136/bmj.302.6776.560. [DOI] [PMC free article] [PubMed] [Google Scholar]
- 10.Koppiker N, Feehally J, Raymond N, et al. Rate of decline in renal function in Indo-Asians and Whites with diabetic nephropathy. Diabet Med. 1998;15:60–65. doi: 10.1002/(SICI)1096-9136(199801)15:1<60::AID-DIA525>3.0.CO;2-R. [DOI] [PubMed] [Google Scholar]
- 11.Hall YN, Hsu CY, Iribarren C, et al. The conundrum of increased burden of end-stage renal disease in Asians. Kidney Int. 2005;68:2310–2316. doi: 10.1111/j.1523-1755.2005.00691.x. [DOI] [PubMed] [Google Scholar]
- 12.Chandie Shaw PK, Baboe F, van Es LA, et al. South-Asian type 2 diabetic patients have higher incidence and faster progression of renal disease compared with Dutch-European diabetic patients. Diabetes Care. 2006;29:1383–1385. doi: 10.2337/dc06-0003. [DOI] [PubMed] [Google Scholar]
- 13.Ball S, Lloyd J, Cairns T, et al. Why is there so much end-stage renal failure of undetermined cause in UK Indo-Asians? QJM. 2001;94:187–193. doi: 10.1093/qjmed/94.4.187. [DOI] [PubMed] [Google Scholar]
- 14.Jafar TH, Qadri Z, Hashmi S. Prevalence of microalbuminuria and associated electrocardiographic abnormalities in an Indo-Asian population. Nephrol Dial Transplant. 2009;24:2111–2116. doi: 10.1093/ndt/gfp042. [DOI] [PMC free article] [PubMed] [Google Scholar]
- 15.Tillin T, Forouhi N, McKeigue P, Chaturvedi N. Microalbuminuria and coronary heart disease risk in an ethnically diverse UK population: a prospective cohort study. J Am Soc Nephrol. 2005;16:3702–3710. doi: 10.1681/ASN.2005060584. [DOI] [PubMed] [Google Scholar]
- 16.Jafar TH, Schmid CH, Levey AS. Serum creatinine as marker of kidney function in South Asians: a study of reduced GFR in adults in Pakistan. J Am Soc Nephrol. 2005;16:1413–1419. doi: 10.1681/ASN.2004121100. [DOI] [PubMed] [Google Scholar]
- 17.Jafar TH, Qadri Z, Chaturvedi N. Coronary artery disease epidemic in Pakistan: more electrocardiographic evidence of ischaemia in women than in men. Heart. 2008;94:408–413. doi: 10.1136/hrt.2007.120774. [DOI] [PMC free article] [PubMed] [Google Scholar]
- 18.Stockl D, Reinauer H. Candidate reference methods for determining target values for cholesterol, creatinine, uric acid, and glucose in external quality assessment and internal accuracy control. I. Method setup. Clin Chem. 1993;39:993–1000. [PubMed] [Google Scholar]
- 19.Levey AS, Stevens LA, Schmid CH, et al. A new equation to estimate glomerular filtration rate. Ann Intern Med. 2009;150:604–612. doi: 10.7326/0003-4819-150-9-200905050-00006. [DOI] [PMC free article] [PubMed] [Google Scholar]
- 20.Jafar TH, Hatcher J, Poulter N, et al. Community-based interventions to promote blood pressure control in a developing country: a cluster randomized trial. Ann Intern Med. 2009;151:593–601. doi: 10.7326/0003-4819-151-9-200911030-00004. [DOI] [PubMed] [Google Scholar]
- 21.Taljaard M, Donner A, Klar N. Imputation strategies for missing continuous outcomes in cluster randomized trials. Biom J. 2008;50:329–345. doi: 10.1002/bimj.200710423. [DOI] [PubMed] [Google Scholar]
- 22.Rossi R, Chiurlia E, Nuzzo A, et al. Flow-mediated vasodilation and the risk of developing hypertension in healthy postmenopausal women. J Am Coll Cardiol. 2004;44:1636–1640. doi: 10.1016/j.jacc.2004.07.027. [DOI] [PubMed] [Google Scholar]
- 23.Lazzara MJ, Deen WM. Model of albumin reabsorption in the proximal tubule. Am J Physiol Renal Physiol. 2007;292:F430–F439. doi: 10.1152/ajprenal.00010.2006. [DOI] [PubMed] [Google Scholar]
- 24.Keller G, Zimmer G, Mall G, et al. Nephron number in patients with primary hypertension. N Engl J Med. 2003;348:101–108. doi: 10.1056/NEJMoa020549. [DOI] [PubMed] [Google Scholar]
- 25.Ballermann BJ, Stan RV. Resolved: capillary endothelium is a major contributor to the glomerular filtration barrier. J Am Soc Nephrol. 2007;18:2432–2438. doi: 10.1681/ASN.2007060687. [DOI] [PubMed] [Google Scholar]
- 26.Jafar TH, Islam M, Hatcher J, et al. Community based lifestyle intervention for blood pressure reduction in children and young adults in developing country: cluster randomised controlled trial. BMJ. 2010;340:c2641. doi: 10.1136/bmj.c2641. [DOI] [PMC free article] [PubMed] [Google Scholar]
- 27.Martin JF, Martin LN, Cipullo JP. Pharmacologic treatment for prehypertension: to treat or not to treat? Recent Pat Cardiovasc Drug Discov. 2009;4:133–141. doi: 10.2174/157489009788452904. [DOI] [PubMed] [Google Scholar]
- 28.Egan BM, Julius S. Prehypertension: risk stratification and management considerations. Curr Hypertens Rep. 2008;10:359–366. doi: 10.1007/s11906-008-0068-0. [DOI] [PubMed] [Google Scholar]
- 29.Julius S, Nesbitt SD, Egan BM, et al. Feasibility of treating prehypertension with an angiotensin-receptor blocker. N Engl J Med. 2006;354:1685–1697. doi: 10.1056/NEJMoa060838. [DOI] [PubMed] [Google Scholar]
- 30.Gansevoort RT, Sluiter WJ, Hemmelder MH, et al. Antiproteinuric effect of blood-pressure-lowering agents: a meta-analysis of comparative trials. Nephrol Dial Transplant. 1995;10:1963–1974. [PubMed] [Google Scholar]
- 31.Vogt L, Navis G, de Zeeuw D. Renoprotection: a matter of blood pressure reduction or agent-characteristics? J Am Soc Nephrol. 2002;13(Suppl 3):S202–207. doi: 10.1097/01.asn.0000032489.33856.53. [DOI] [PubMed] [Google Scholar]
- 32.Cirillo M, Laurenzi M, Mancini M, et al. Low muscular mass and overestimation of microalbuminuria by urinary albumin/creatinine ratio. Hypertension. 2006;47:56–61. doi: 10.1161/01.HYP.0000197953.91461.95. [DOI] [PubMed] [Google Scholar]
- 33.Jafar TH, Chaturvedi N, Hatcher J, et al. Use of albumin creatinine ratio and urine albumin concentration as a screening test for albuminuria in an Indo-Asian population. Nephrol Dial Transplant. 2007;22:2194–2200. doi: 10.1093/ndt/gfm114. [DOI] [PubMed] [Google Scholar]
- 34.Nathan DM, Rosenbaum C, Protasowicki VD. Single-void urine samples can be used to estimate quantitative microalbuminuria. Diabetes Care. 1987;10:414–418. doi: 10.2337/diacare.10.4.414. [DOI] [PubMed] [Google Scholar]
- 35.Mosca A, Paleari R, Ceriotti F, et al. Biological variability of albumin excretion rate and albumin-to-creatinine ratio in hypertensive type 2 diabetic patients. Clin Chem Lab Med. 2003;41:1229–1233. doi: 10.1515/CCLM.2003.188. [DOI] [PubMed] [Google Scholar]