Abstract
Body water balance is regulated via the water channel aquaporin-2 (AQP2), which is expressed in the renal connecting tubule (CNT) and collecting duct (CD). The relative roles of AQP2 in the CNT and CD are not fully understood. To study the role of AQP2 in the CNT we generated a mouse model with CNT-specific AQP2 deletion (AQP2-CNT-knockout (KO)). Confocal laser scanning microscopy and immunogold electron microscopy demonstrated an absence of AQP2 in the CNT of AQP2-CNT-KO mice. Twenty-four hour urine output was significantly increased (KO: 3.0 ± 0.3 ml (20 g body weight (BW))−1; wild-type (WT): 1.9 ± 0.3 ml (20 g BW)−1) and urine osmolality decreased (KO: 1179 ± 107 mosmol kg−1; WT: 1790 ± 146 mosmol kg−1) in AQP2-CNT-KO mice compared with controls. After 24 h water restriction, urine osmolality was still significantly lower in AQP2-CNT-KO mice (KO: 2087 ± 169 mosmol kg−1; WT: 2678 ± 144 mosmol kg−1). A significant difference in urine osmolality between groups before desmopressin (dDAVP) (KO: 873 ± 129 mosmol kg−1; WT: 1387 ± 163 mosmol kg−1) was not apparent 2 h after injection, with urine osmolality increased significantly in both groups (KO: 2944 ± 41 mosmol kg−1; WT: 3133 ± 66 mosmol kg−1). Cortical kidney fractions from AQP2-CNT-KO mice had significantly reduced AQP2, with no compensatory changes in sodium potassium chloride cotransporter (NKCC2), AQP3 or AQP4. Lithium chloride treatment increased urine volume and decreased osmolality in both WT and AQP2-CNT-KO mice. After 8 days of treatment, the AQP2-CNT-KO mice still had a significantly higher urine volume and lower urine osmolality, suggesting that the CNT does not play a significant role in the pathology of lithium-induced nephrogenic diabetes insipidus. Our studies indicate that the CNT plays a role in regulating body water balance under basal conditions, but not for maximal concentration of the urine during antidiuresis.
Key points
The water channel aquaporin-2 (AQP2) is regulated by the hormone vasopressin, and is essential for renal water handling and overall body water balance.
AQP2 is expressed in the renal connecting tubule (CNT) and collecting duct (CD). The role of AQP2 in the CD is well established.
Here we generate a novel mouse model with gene deletion of AQP2 in the mouse CNT and use this model to examine the role of AQP2 in this segment.
Knockout (KO) mice have defective renal water handling under basal conditions, with higher urine volume and reduced urine osmolality, but are able to decrease urine volume under conditions of high circulating vasopressin.
KO mice have no obvious compensatory mechanisms in other transporters.
KO mice develop a urinary-concentrating defect similar to control mice following lithium chloride treatment. However, the defect in KO mice continued to be more severe than in the control mice, suggesting that the CNT does not play a significant role in the pathology of lithium-induced nephrogenic diabetes insipidus.
Our studies indicate that the CNT plays a role in regulating body water balance under basal conditions, but not for maximal concentration of the urine during antidiuresis.
Introduction
Arginine vasopressin (AVP)-mediated regulation of body water homeostasis is essential. In response to hypernatraemia or hypovolemia, AVP is released from the pituitary gland. AVP binds to the AVP type-2 receptor in the basolateral membrane of renal connecting tubule (CNT) and collecting duct (CD) principal cells (Sarmiento et al. 2005; Fenton et al. 2007), resulting in redistribution of aquaporin-2 (AQP2) water channels from intracellular vesicles to the apical plasma membrane (Nielsen et al. 1995). This greatly increases the water permeability of the epithelium, leading to osmotic removal of water and the production of concentrated urine. Long-term AVP exposure increases AQP2 gene transcription and AQP2 abundance; an effect requiring several hours of AVP exposure (Terris et al. 1996; Hasler et al. 2002).
Until recently, it was believed that regulated water reabsorption by the kidney occurred exclusively in the CD. This assumption was based primarily on studies performed in rabbits, showing that the CNT possesses very low water permeability that is insensitive to AVP (Imai, 1979). In agreement with this, the rabbit CNT does not express AQP2 (Loffing et al. 2000). In contrast, micropuncture studies in rats showed that water can be reabsorbed in the distal convolution, probably the CNT (Gottschalk & Mylle, 1959). Additional micropuncture studies performed under antidiuretic conditions demonstrated that the amount of water reabsorbed osmotically in the late distal tubule (CNT + initial collecting tubule) is much greater than that absorbed in the medullary nephron (Lassiter et al. 1961). Combined, these results indicate a role of the CNT in regulated water homeostasis. The molecular explanation for the increased water absorption in these segments is that the rat CNT, and additionally the mouse and human CNT, expresses AQP2 (Loffing & Kaissling, 2003), which is regulated in abundance by AVP (Coleman et al. 2000; Christensen et al. 2003).
Previous studies on transgenic mice have demonstrated a crucial role of AQP2 in renal water handling (Yang et al. 2001, 2006; Rojek et al. 2006; Shi et al. 2007). Mice with CD-specific AQP2 knockout (KO) have polyuria and growth retardation, but are viable to adulthood (Rojek et al. 2006). In contrast, total AQP2 deletion is lethal within the first few days of life due, suggesting an essential role of the CNT in water balance. To comprehensively assess the function of AQP2 in the CNT, we describe here the generation and characterization of a mouse model with specific deletion of AQP2 in the majority of CNT cells.
Methods
Ethical approval
All animal protocols comply with the European Community guidelines for the use of experimental animals, and were approved and performed under a license issued for the use of experimental animals by the Danish Ministry of Justice (Dyreforsøgstilsynet). For studies requiring perfusion fixation or blood collection, mice were anaesthetized using isoflurane inhalation, followed by cervical dislocation. In other studies requiring tissue collection, mice were killed by cervical dislocation.
Antibodies
The following antibodies were used: a rabbit polyclonal AQP2 antibody against the COOH-terminal (Nielsen et al. 2006); a biotinylated (Pierce, Rockford, IL, USA) rabbit polyclonal antibody targeting the epitope NH2-CMRTFGYNTID-COOH at the NH2-terminus of rat NCC; a total AQP2 antibody of goat origin against the NH2-terminus of AQP2 (N-20; Santa Cruz, Santa Cruz, CA, USA); a rabbit polyclonal antibody against pendrin (Kim et al. 2002); a rabbit polyclonal AQP3 antibody (Ecelbarger et al. 1995); a rabbit polyclonal AQP4 antibody (AQP-004; Alomone Labs, Jerusalem, Israel); a rabbit polyclonal sodium potassium chloride cotransporter (NKCC2) antibody (Kim et al. 1999); a rabbit polyclonal antibody against the COOH-terminus of the B1 subunit of vacuolar H+-ATPase (Christensen et al. 2006); and a rabbit polyclonal sodium/calcium exchanger 1 (NCX1) antibody (Thomas et al. 2003).
Conditional KO of AQP2 in mice
For the generation of the AQP2-CNT-KO mice, transgenic AQP2 mice harboring loxP sites around exon 3 of the AQP2 gene (Rojek et al. 2006) were mated with mice expressing Cre recombinase driven by the promoter region of the V-ATPase B1 subunit (Miller et al. 2009). This model showed an unexpected Cre recombinase expression in about 50% of CNT cells (Miller et al. 2009). It was therefore expected that AQP2 deletion in this mouse model would occur, at least, in about 50% of the CNT principal cells.
Breeding and genotyping of conditional AQP2 KO mice
The genotype was verified by polymerase chain reaction (PCR) on genomic DNA extracted from tail biopsies. Cre recombinase was detected with primers 5′-GTTCGCAAGAACCTGATGCACA-3′ and 5′-CTAGAGCCTGTTTTGCACGTTC-3′; AQP2 with primers 5′-GGTTTCAGCTGCCCTACAAG-3′, 5′-ATATCATTTACTGGGTTCTG-3′ and 5′-CTCCATGAATCCAGCCCGCTCC-3′; and primers amplifying AQP7 gene sequence 5′-CTGCAAAGTGGTTAATGGCACCT-3′ and 5′-TATCTCGGTGTCAACTTGGGTTTTG-3′ were included in the PCR to provide a positive control.
Mouse metabolic cage studies
Mice were kept in standard cages in a room with a 12:12 h artificial light–dark cycle, a temperature of 21 ± 2°C and humidity of 55 ± 2%, with free access to tap water and standard rodent diet (1324 pellets; Altromin, Lage, Germany). For balance studies, mice were housed individually in metabolic cages, in a room at 27°C. Following 3 days of acclimatization, urine was collected under mineral oil in preweighed collection vials for two successive 24 h periods, and urine volume was measured gravimetrically. During this period, body weight (BW) and food intake were also measured. After the initial collection period, mice were challenged in their ability to concentrate their urine by water restriction (providing 55% of baseline water intake in gelled food: 4.2 ml water, 3 mg food and 1% bacterial agar per 20 g BW) for 24 h. The amount of water given in the food was determined to be sufficient to replace the insensible water loss and produce a small amount of daily urine (Fenton et al. 2004). Mice did not have access to supplemental drinking water during this period.
For lithium studies, lithium chloride was added to the food for a period of 8 days to give a concentration of 40 mmol kg−1 dry food, which was previously shown to give clinically relevant serum lithium concentrations in mice (Christensen et al. 2011). During this period, all mice had free access to water, food and a sodium chloride block to prevent lithium intoxication and avoid negative sodium balance (Thomsen, 1973).
Acute desmopressin (dDAVP) challenge
Mice were used directly from their standard housing. To maximally stimulate urine-concentrating ability, mice received a single intraperitoneal injection of 10 ng dDAVP (Sigma-Aldrich) in a volume of 100 μl physiological saline. Spot urine was collected 0, 2 and 4 h after injection. During this period, mice were housed in their standard cages.
Osmolality and electrolyte measurements
Collected urine was centrifuged at 1000 g for 1 min to clear sediments. Osmolality was measured on an Advanced Wide-Range Osmometer 3W2 (Advanced Instruments Inc., MA, USA). Urine was analysed for sodium, potassium, chloride, urea, total calcium, inorganic phosphate and urinary protein. Blood plasma was prepared by collecting blood in K3-EDTA tubes, inverting 8–10 times, followed by centrifugation at 1200 g for 10 min at 4°C within 1 h after collection. Sodium, chloride, urea and creatinine concentrations were measured. Urine and plasma were analysed by the Clinical Pathology Laboratory at the Medical Research Council (Harwell, Oxfordshire, UK). Lithium was measured by standard procedures of the General Clinical Chemical Laboratory of the Radboud University Nijmegen Medical Centre (Nijmegen, the Netherlands).
Laser scanning confocal microscopy
Mice were perfused via the heart with ice-cold 3% paraformaldehyde in PBS (pH 7.4) and postfixed in the same buffer for 1 h. The procedures for the preparation and immunolabelling of tissue for confocal microscopy have been described in detail previously (Fenton et al. 2007). Labelling was visualized using Alexa 488, 555 and 633-conjugated secondary antibodies of donkey, goat, chicken or mouse origin. To enable the use of two primary antibodies derived from the same host species, one of the antibodies was biotinylated and subsequently detected with Alexa 546-conjugated streptavidin. A Leica TCS SL confocal microscope with an HCX PL APO 63× oil objective lens (numerical aperture: 1.40) was used for imaging of labelled sections.
Immunogold electron microscopy
Kidneys were perfusion fixed with 3% paraformaldehyde in PBS (pH 7.4). The procedures for the preparation and immunolabelling of tissue for immunogold electron microscopy have been described in detail previously (Moeller et al. 2009). Sections were examined using an FEI Morgagni 268D electron microscope.
Immunoblotting
Kidneys were isolated and dissected into a cortical fraction, the inner medulla and the remainder. Tissue was homogenized in ice-cold dissection buffer (0.3 m sucrose, 25 mm imidazole and 1 mm EDTA, pH 7.2) containing protease inhibitors leupeptin (8.6 μm), phefablock (0.4 mm) and PhosSTOP Phosphatase Inhibitor Cocktail (Roche) followed by a low-velocity spin (1000 g, 5 min, 4°C). Preparation of gel samples and semiquantitative immunoblotting was performed as previously described (Fenton et al. 2007). Equal quantities of total protein were loaded per lane as determined by Coomassie blue staining.
Statistical analyses
Values are presented as means ± SEM. Comparisons between two groups were made by unpaired t tests. Comparisons between mice before and after 8 days of lithium treatment were made by paired t tests. P-values <0.05 were considered significant.
Results
Generation of AQP2-CNT-KO mice
AQP2-CNT-KO mice were generated by mating mice harboring loxP sites around exon 3 of the AQP2 gene (Rojek et al. 2006) with mice expressing Cre recombinase driven by the V-ATPase B1-subunit promoter region (Miller et al. 2009). Previously, besides being expressed in intercalated cells, Cre was also detected in 50% of the CNT principal cells of V-ATPase B1-subunit-Cre mice, with no expression in CD principal cells (Miller et al. 2009). An AQP2-V-ATPase-B1-Cre genotype was confirmed by PCR. No obvious differences in physical appearance, BW or behavior were detectable between the AQP2-V-ATPase-B1-Cre mice and littermate controls (either floxed mice with no Cre recombinase expression, or non-floxed mice with Cre recombinase expression). AQP2-CNT-KO mice bred normally, with no evidence of impaired fertility.
AQP2 expression in the CNT of AQP2-CNT-KO mice
Laser scanning immunofluorescence confocal microscopy using AQP2 and various segment-specific markers verified that in KO mice, AQP2 was not detectable in the majority of CNT cells. We observed long cortical tubular structures that were NCC-negative, but had extensive stretches of pendrin-positive intercalated cells without AQP2-immunoreactivity (Fig. 1A, C and E). This pattern of labelling suggested that these were CNT segments. In contrast, kidneys from control littermates had pendrin-labelling of intercalated cells and AQP2-immunolabelling of CNT cells in similar segments (Fig. 1B, D and F).
Figure 1. Representative laser scanning confocal immunofluorescence triple labelling of kidney cortex from aquaporin-2 (AQP2)-connecting tubule (CNT)-knockout (KO) mice (A, C and E) and control mice (B, D and F).
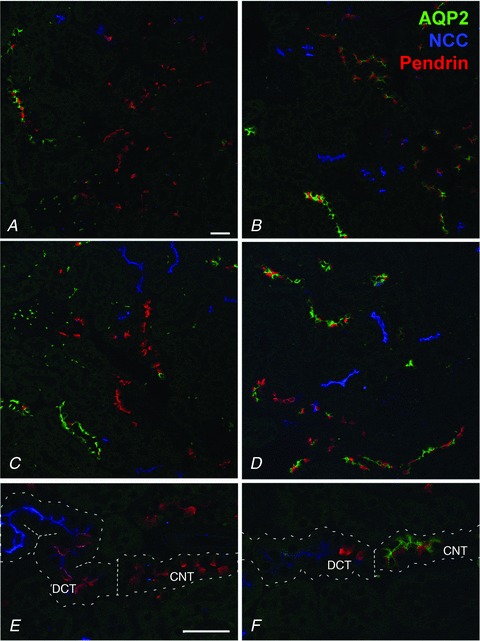
Each image is from a different animal. Late distal convoluted tubule (DCT), CNT and early cortical collecting duct (CCD) B-type intercalated cell marker pendrin is pseudo-labelled in red; DCT marker NCC is pseudo-labelled in blue; and AQP2 is pseudo-labelled in green. AQP2-CNT-KO mice have long segments of distal tubule solely immunolabelling for pendrin in contrast to the control mice having co-labelling of pendrin and AQP2 in similar segments, demonstrating deletion of AQP2 in the CNT. E, the transition from NCC-positive DCT to pendrin-positive CNT is indicated by the dotted line, and only control mice (F) show co-labelling with AQP2 in the pendrin-positive CNT. Scale bar: 200 μm.
To further analyse AQP2 expression in the CNT, double labelling with AQP2 and the principal cell marker AQP3 was performed. In KO mice, several stretches with AQP3-positive but AQP2-negative cells were observed (Fig. 2A, arrows). In the majority of tubules a clear transition can be seen from tubule segments containing AQP2-positive/AQP3-positive cells (Fig. 2B, arrowheads), probably representing the cortical CD, to segments only positive for AQP3 (Fig. 2B, arrows). However, in some tubules both AQP2-positive/AQP3-positive and AQP2-negative/AQP3-positive cells were observed (Fig. 2C), suggesting that AQP2 is not deleted from all principal cells in the CNT. In control mice, all AQP3-positive cells labelled for AQP2 (not shown).
Figure 2. Representative laser scanning confocal immunofluorescence double labelling of kidney cortex from aquaporin-2 (AQP2)-connecting tubule (CNT)-knockout (KO) mice.
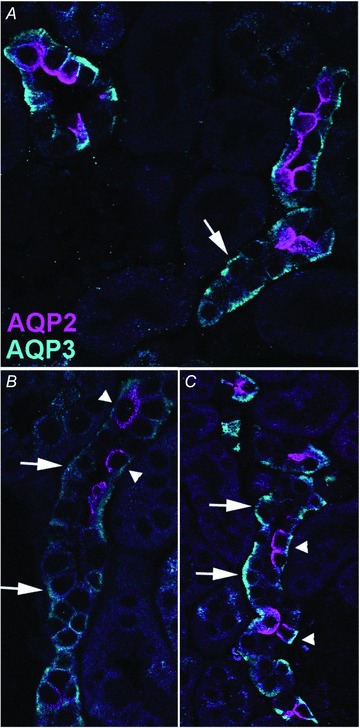
AQP2 is pseudo-labelled in pink and AQP3 in turquoise. Large arrows highlight AQP3-positive but AQP2-negative cells, while arrowheads highlight cells positive for both AQP3 and AQP2.
To confirm the confocal microscopy, AQP2 localization was analysed by immunogold electron microscopy. Sections were labelled with AQP2 and the H-ATPase as a marker of intercalated cells. AQP2 labelling was clearly visible in CNT principal cells of controls (Fig. 3A and B), whereas no labelling was observed in the majority of CNT principal cells of AQP2-CNT-KO mice (Fig. 3C and D).
Figure 3. Immunogold electron microscopy of connecting tubule (CNT) cells in kidney cortex from control (A, B) and aquaporin-2 (AQP2)-CNT-knockout (KO) mice (C, D).
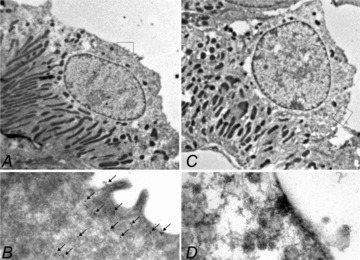
Cells were labelled with AQP2 (15 nm gold particle) as well as with H-ATPase as a marker of intercalated cells (5 nm particle, not observed). Clear AQP2 expression was visible in CNT principal cells of control mice, whereas no labelling was observed in CNT principal cells of KO mice.
Impaired renal water handling in AQP2-CNT-KO mice
Physiological parameters under basal conditions are shown in Table 1. Twenty-four hour urine output was significantly increased in AQP2-CNT-KO mice (3.0 ± 0.3 ml (20 g BW)−1) compared with controls (1.9 ± 0.3 ml (20 g BW)−1; Fig. 4A). Urine osmolality inversely followed this trend, with AQP2-CNT-KO mice having significantly lower urine osmolalities (KO: 1179 ± 107 mosmol kg−1; wild-type (WT): 1790 ± 146 mosmol kg−1; Fig. 4B). A similar increase in urine volume and decrease in urine osmolality was observed using a different group of mice (Supplemental Table 1). In agreement with the lower urine osmolality, AQP2-CNT-KO mice had significantly lower urinary sodium, chloride, potassium and urea concentrations, although total excretion of these solutes and daily osmolar excretion was not significantly different from controls (Table 1). Urinary calcium, inorganic phosphate and protein concentrations did not differ between groups (not shown). Plasma analysis of a separate group of mice under basal conditions showed no significant differences in sodium, chloride, urea and creatinine concentrations between AQP2-CNT-KO mice and controls (Table 2). Together, these results suggest a defect in renal water handling under basal conditions in the AQP2-CNT-KO mice.
Table 1.
Physiological parameters
| WT animals (n= 4) | AQP2-CNT-KO animals (n= 7) | |
|---|---|---|
| During basal period | ||
| BW (g) | 21.1 ± 1.8 | 21.4 ± 0.9 |
| Drinking (ml (20 g BW)−1) | 7.2 ± 0.7 | 8.2 ± 0.6 |
| Food intake (g (20 g BW)−1) | 3.4 ± 0.2 | 3.4 ± 0.1 |
| Osmolar excretion (μosmol (24 h)−1) | 3343 ± 89 | 3521 ± 113 |
| Urinary sodium concentration (mm) | 71 ± 10 | 40 ± 2* |
| Total sodium excretion (μmol (24 h)−1) | 134 ± 2 | 124 ± 11 |
| Urinary potassium concentration (mm) | 318 ± 24 | 205 ± 16* |
| Total potassium excretion (μmol (24 h)−1) | 591 ± 19 | 614 ± 19 |
| Urinary chloride concentration (mm) | 167 ± 14 | 110 ± 11* |
| Total chloride excretion (μmol (24 h)−1) | 310 ± 10 | 329 ± 11 |
| Urinary urea concentration (mm) | 980 ± 65 | 651 ± 66* |
| Total urea excretion (μmol (24 h)−1) | 1834 ± 46 | 1934 ± 73 |
| During 24 h water restriction | ||
| BW difference (g) | −2.0 ± 0.4 | −1.4 ± 0.1 |
| Water intake (ml (20 g BW)−1) | 2.7 ± 0.7 | 3.5 ± 0.1 |
| Food intake (g (20 g BW)−1) | 1.8 ± 0.5 | 2.4 ± 0.1 |
| Osmolar excretion (μosmol (24 h)−1) | 1302 ± 252 | 1369 ± 234 |
| Urinary sodium concentration (mm) | 108 ± 8 | 79 ± 5* |
| Total sodium excretion (μmol (24 h)−1) | 215 ± 5 | 230 ± 24 |
| Urinary potassium concentration (mm) | 424 ± 89 | 310 ± 23 |
| Total potassium excretion (μmol (24 h)−1) | 839 ± 105 | 901 ± 116 |
| Urinary chloride concentration (mm) | 255 ± 29 | 186 ± 18 |
| Total chloride excretion (μmol (24 h)−1) | 505 ± 43 | 544 ± 72 |
| Urinary urea concentration (mm) | 1426 ± 187 | 1096 ± 79 |
| Total urea excretion (μmol (24 h)−1) | 2830 ± 329 | 3218 ± 387 |
Values during the basal period are the average measurements from the 2 days prior to water restriction. Values are mean ± SEM. *P < 0.05. AQP2, aquaporin-2; BW, body weight; CNT, connecting tubule; KO, knockout; WT, wild-type.
Figure 4. Basal 24 h urine volume (A) and urine osmolality (B) of control (wild-type (WT)) and aquaporin-2 (AQP2)-connecting tubule (CNT)-knockout (KO) mice (KO).
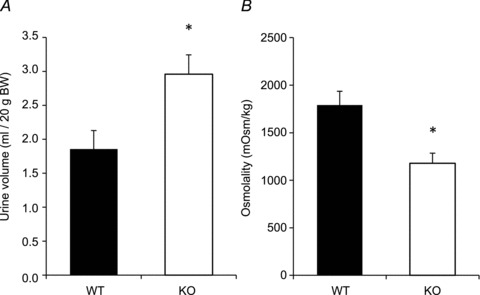
Values are mean ± SEM. *P < 0.05.
Table 2.
Plasma measurements under basal conditions
| WT animals (n= 8) | AQP2-CNT-KO animals (n= 8) | |
|---|---|---|
| Sodium (mmol l−1) | 133 ± 4.4 | 131 ± 2.4 |
| Chloride (mmol l−1) | 102 ± 3.0 | 101 ± 1.1 |
| Urea (mmol l−1) | 12.2 ± 0.95 | 11.7 ± 0.87 |
| Creatinine (μmol l−1) | 9.2 ± 0.33 | 8.9 ± 0.4 |
Values are mean ± SEM. AQP2, aquaporin-2; CNT, connecting tubule; KO, knockout; WT, wild-type.
Maximal urinary-concentrating ability in AQP2-CNT-KO mice
Following a 24 h water restriction, both groups had decreased urine volume and increased urine osmolality (Fig. 5). Despite no significant difference in 24 h urine output during water restriction (KO: 0.69 ± 0.11 ml (20 g BW)−1; WT: 0.56 ± 0.11 ml (20 g BW)−1), urine osmolality was still significantly lower in AQP2-CNT-KO mice compared with controls (KO: 2087 ± 169 mosmol kg−1; WT: 2678 ±144 mosmol kg−1). No significant difference in total daily osmolar excretion was observed (Table 1). Urinary electrolyte concentrations were increased in both groups after water restriction, but AQP2-CNT-KO mice had lower urinary sodium, chloride, potassium and urea concentrations, although only the difference in sodium concentration was statistically significant. Total excretion of these solutes was not significantly different from controls. Urinary calcium, inorganic phosphate and urinary protein concentration did not significantly differ between groups.
Figure 5. Twenty-four hour urine volume (A) and urine osmolality (B) of control (wild-type (WT)) and aquaporin-2 (AQP2)-connecting tubule (CNT)-knockout (KO) mice (KO) after 24 h water restriction.
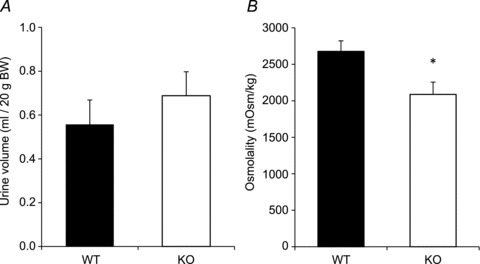
Values are mean ± SEM. *P < 0.05.
In a separate study, water reabsorption in the kidney was maximally stimulated by intraperitoneal injection of dDAVP (Fig. 6). Urine osmolality was significantly different between the groups before injection (KO: 873 ± 129 mosmol kg−1; WT: 1387 ± 163 mosmol kg−1). Two hours after injection, urine osmolality increased significantly from baseline in both groups of animals, and was no longer significantly different between the two groups (KO: 2944 ± 41 mosmol kg−1; WT: 3133 ± 66 mosmol kg−1). Urine osmolality remained similar in both groups 4 h after injection at approximately 2700 mosmol kg−1.
Figure 6. Urine osmolality of control (wild-type (WT)) and aquaporin-2 (AQP2)-connecting tubule (CNT)-knockout (KO) mice (KO) after intraperitoneal injection of desmopressin (dDAVP).
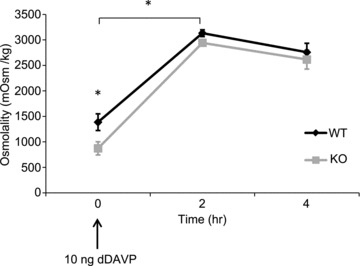
Values are mean ± SEM. *P < 0.05.
AQP2 protein abundance is decreased in the cortex of AQP2-CNT-KO mice
Kidneys obtained from mice housed under normal conditions were divided into inner medulla, cortex and the remainder (mainly consisting of outer medulla and residual cortex). Immunoblotting revealed a 50% decrease in AQP2 abundance in the cortex of AQP2-CNT-KO mice compared with controls (Fig. 7A). No significant differences were observed in cortex samples for other AVP-regulated proteins AQP3, AQP4 and NKCC2. NKCC2 expression in the outer medulla/cortex homogenate was also not significantly different (not shown). Interestingly, AQP4 expression was higher in female mice (control and AQP2-CNT-KO) than male mice. A similar pattern was observed in the outer medulla/cortex homogenate (not shown). NCX1 and pendrin, expressed in the CNT, were not significantly different in the AQP2-CNT-KO mice compared with controls, indicating that there is no difference in CNT integrity or overall CNT abundance in the AQP2-CNT-KO mice.
Figure 7. Immunoblots of cortical and inner medullary kidney homogenates.
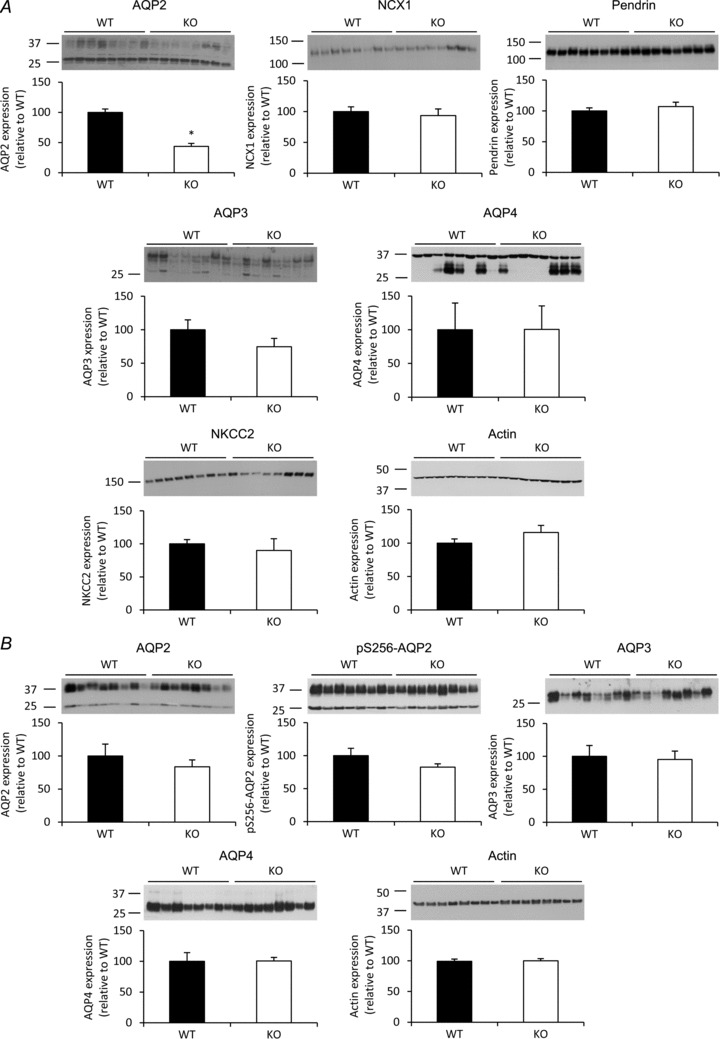
A, the abundance of aquaporin (AQP)2, AQP3, AQP4, sodium/calcium exchanger 1 (NCX1), pendrin, sodium potassium chloride cotransporter (NKCC2) and actin was determined in cortical kidney homogenates from either control (wild-type (WT)) or AQP2-connecting tubule (CNT)-knockout (KO) mice (KO). B, the expression of AQP2, pS256-AQP2, AQP3, AQP4 and actin was determined in inner medullary kidney homogenates from the same animals. Data are band densities relative to WT (mean ± SEM) after normalization to actin expression. n= 8 in the WT group, n= 8 in the KO group. *P < 0.05.
In the inner medulla, no compensatory upregulation of AQP2, AQP3 or AQP4 abundances or AQP2 phosphorylation at Ser-256 were observed in AQP2-CNT-KO mice (Fig. 7B). No difference in AQP4 abundance between male or female mice was observed in the inner medulla. A similar decrease in cortical AQP2 in AQP2-CNT-KO mice, without any change in other analysed proteins, was observed using a different group of mice (not shown).
Urinary-concentrating ability during lithium-induced nephrogenic diabetes insipidus
Lithium is regularly used to treat psychiatric disorders; however, approximately 20% of patients develop nephrogenic diabetes insipidus (NDI), a disorder characterized by polyuria and polydipsia due to renal insensitivity to AVP (Boton et al. 1987). Lithium-NDI coincides with AQP2 and AQP3 downregulation, and in the long term also a decrease in the fraction of principal cells (Marples et al. 1995; Kwon et al. 2000; Christensen et al. 2004). To further investigate the urine-concentrating ability of AQP2-CNT-KO mice and the role of AQP2 in the CNT in lithium-NDI development, control and AQP2-CNT-KO mice were given either lithium chloride in their food for 8 days or were kept on a control diet, and their renal water handling examined.
During basal conditions, both the urine output (KO: 1.8 ± 0.1 ml (20 g BW)−1; WT: 1.1 ± 0.1 ml (20 g BW)−1) and drinking volume (KO: 4.0 ± 0.2 ml (20 g BW)−1; WT: 2.9 ± 0.2 ml (20 g BW)−1) were significantly higher in AQP2-CNT-KO mice, while urine osmolality was significantly lower (KO: 1098 ± 120 mosmol kg−1; WT: 1597 ± 93 mosmol kg−1). Lithium treatment gradually increased urine and drinking volume in both WT and KO mice (Fig. 8), resulting in a 5.0-fold and 5.2-fold increased urine volume in the WT controls and AQP2-CNT-KO mice after 8 days, respectively, compared with mice on the control diet. During the same period, drinking volume increased 2.9-fold and 3.9-fold in WT and KO mice, respectively. Throughout the study, urine volume remained significantly higher in AQP2-CNT-KO mice (KO Li: 12.6 ± 1.9 ml (20 g BW)−1; WT Li: 7.0 ± 1.6 ml (20 g BW)−1), as did drinking volume (KO Li: 18.8 ± 2.5 ml (20 g BW)−1; WT Li: 10.5 ± 1.7 ml (20 g BW)−1). Urine osmolality gradually decreased to 25% and 20% in WT and AQP2-CNT-KO mice, respectively, compared with mice on the control diet. After 8 days, urine osmolality was significantly lower in the KO animals (KO Li: 252 ± 20 mosmol kg−1; WT Li: 522 ± 67 mosmol kg−1). Other physiological parameters are indicated in Table 3. BW, food intake and osmolar excretion were not different between groups. Serum lithium and sodium concentrations after 8 days of treatment were also not significantly different. Together, these data indicate that, although both control and KO mice develop lithium-NDI, the AQP2-CNT-KO mice continue to display a more severe urinary-concentrating defect.
Figure 8. Effects of lithium chloride treatment on urinary concentration in aquaporin-2 (AQP2)-connecting tubule (CNT)-knockout (KO) mice.
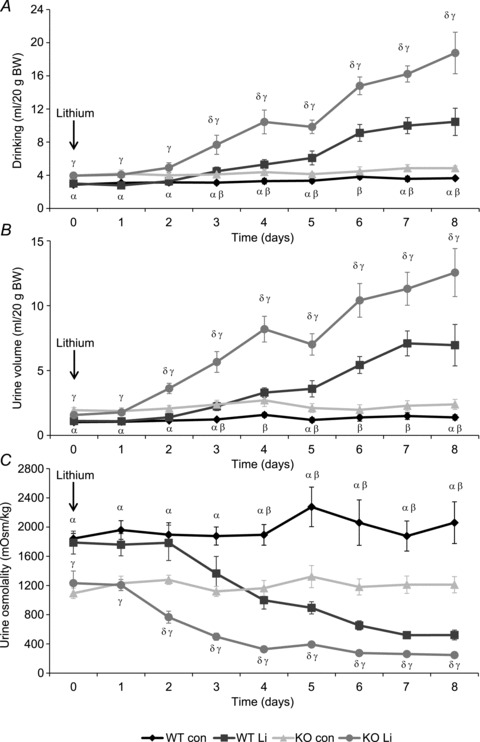
Twenty-four hour drinking volume (A), urine volume (B) and urine osmolality (C) of control (wild-type (WT)) and AQP2-CNT-KO mice (KO) during 8 days of lithium chloride diet (Li) or control diet (con). n= 6 per group. Values are mean ± SEM. αP < 0.05 WT con vs. KO con; βP < 0.05 WT con vs. WT Li; γP < 0.05 WT Li vs. KO Li; δP < 0.05 KO con vs. KO Li.
Table 3.
Physiological parameters following lithium chloride treatment
| WT Normal diet (n= 6) | Li diet (n= 6) | KO Normal diet (n= 6) | Li diet (n= 6) | ||
|---|---|---|---|---|---|
| Plasma sodium (mm) | Day 8 | 150.1 ± 1.3 | 147.7 ± 1.6 | 147.1 ± 1.2 | 146.8 ± 1.2 |
| Plasma lithium (mm) | Day 8 | 0.39 ± 0.05 | 0.35 ± 0.05 | ||
| BW (g) | Day 0 | 23.7 ± 1.2 | 23.3 ± 2.0 | 24.9 ± 1.0 | 25.1 ± 0.9 |
| Day 8 | 23.0 ± 1.1 | 23.0 ± 1.9 | 24.7 ± 1.0 | 24.1 ± 1.1 | |
| Osmolar excretion (μosmol (24 h)−1) | Day 0 | 2208 ± 142 | 2345 ± 292 | 2637 ± 171 | 2490 ± 380 |
| Day 8 | 3009 ± 339 | 3574 ± 245 | 3424 ± 423 | 3538 ± 293 | |
| Food intake (g (20 g BW)−1) | Day 0 | 2.9 ± 0.4 | 2.5 ± 0.6 | 2.7 ± 0.2 | 2.3 ± 0.1 |
| Day 8 | 3.0 ± 0.2 | 3.2 ± 0.5 | 2.9 ± 0.1 | 2.7 ± 0.3 |
Values are mean ± SEM. *P < 0.05. BW, body weight; KO, knockout; WT, wild-type.
To confirm these results, a separate study was performed using a different group of mice, which were given lithium chloride in their food for 8 days (Supplemental Fig. 1). A similar increase in urine volume and decrease in urine osmolality was observed. During basal conditions, both the urine output (KO: 2.3 ± 0.2 ml (20 g BW)−1; WT: 1.5 ± 0.1 ml (20 g BW)−1) and drinking volume (KO: 5.2 ± 0.4 ml (20 g BW)−1; WT: 3.8 ± 0.2 ml (20 g BW)−1) were significantly higher in AQP2-CNT-KO mice, while urine osmolality was significantly lower (KO: 1354 ± 109 mosmol kg−1; WT: 1867 ± 99 mosmol kg−1). Again, lithium treatment gradually increased urine and drinking volume in both groups, and decreased urine osmolality. Urine volume remained significantly higher in AQP2-CNT-KO mice (KO: 11.3 ± 1.5 ml (20 g BW)−1; WT: 5.9 ± 0.8 ml (20 g BW)−1 at day 8), just as drinking volume (KO: 16.1 ± 1.7 ml (20 g BW)−1; WT: 9.3 ± 1.2 ml (20 g BW)−1 at day 8), while urine osmolality remained lower (KO: 325 ± 62 mosmol kg−1; WT: 617 ± 73 mosmol kg−1 at day 8). Food intake, osmolar excretion and BW were not different between groups before or after 8 days of lithium treatment (Supplemental Table 2). Serum lithium and sodium concentrations after 8 days of treatment were also not significantly different.
AQP2 protein abundance during lithium-induced NDI
After 8 days of lithium treatment animals were killed and protein samples were prepared from the kidney. In cortex samples (Fig. 9A), immunoblotting revealed a 35% lower AQP2 abundance in the AQP2-CNT-KO mice compared with WT mice on a control diet. Lithium treatment decreased AQP2 expression in the WT and AQP2-CNT-KO mice compared with the mice on the control diet. AQP2 abundance was significantly lower by 31% in the lithium-treated AQP2-CNT-KO mice compared with lithium-treated WT mice (Fig. 9A). No significant differences were detected in abundances of cortical AQP3, or the CNT-proteins pendrin and NCX1. In the inner medulla (Fig. 9B), no significant differences in AQP2 or AQP3 abundances were detected between the WT and KO mice on a control diet. Lithium treatment resulted in a significant decrease of 60% and 54% in AQP2 expression in the WT and AQP2-CNT-KO mice, respectively, while AQP3 expression was significantly reduced by 45% and 39%. No statistical differences in expression of AQP2 or AQP3 were detected in AQP2-CNT-KO mice compared with WT mice after lithium treatment.
Figure 9. Immunoblots of cortical and inner medullary kidney homogenates of mice treated without (con) or with lithium chloride (Li) for 8 days.
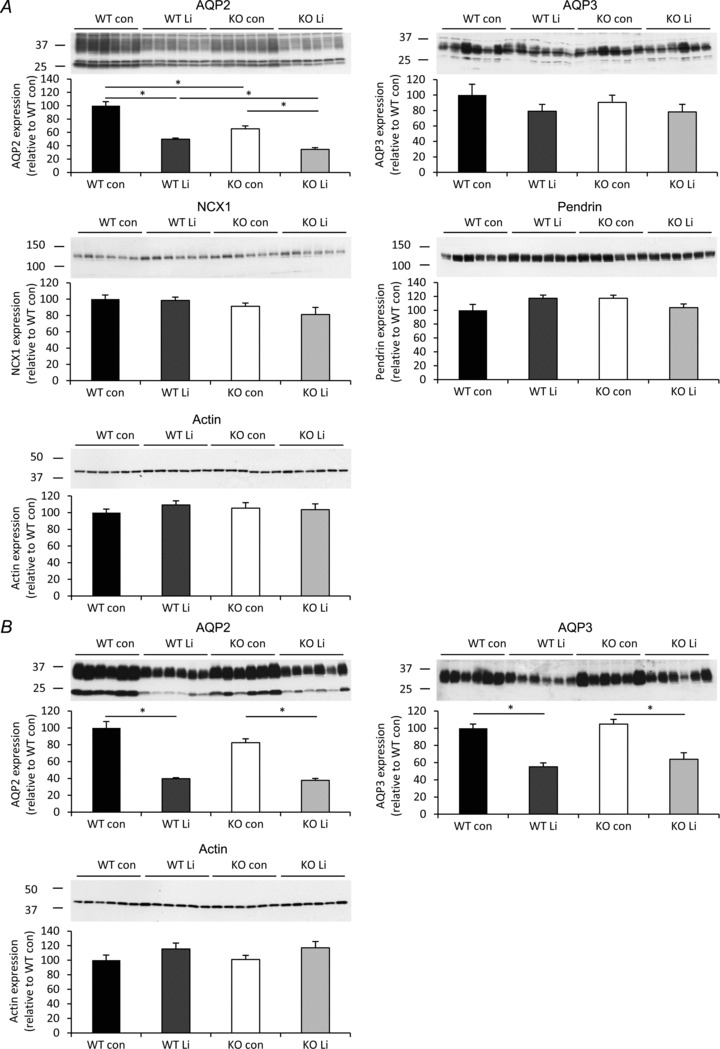
A, the expression of aquaporin (AQP)2, AQP3, sodium/calcium exchanger 1 (NCX1), pendrin and actin was determined in cortical kidney homogenates from either wild-type (WT) or AQP2-connecting tubule (CNT)-knockout (KO) mice (KO). B, the expression of AQP2, AQP3 and actin was determined in inner medullary kidney homogenates from the same animals. Data are band densities relative to WT (mean ± SEM) after normalization to actin expression. n= 6 in each group. *P < 0.05.
Immunoblotting for the animals examined in the separate study of lithium effects (Supplemental Fig. 1; Table 2) revealed a 33% lower AQP2 abundance in the cortex of lithium-treated AQP2-CNT-KO mice compared with WT mice (Supplemental Fig. 2A). No significant difference was visible in cortical AQP3, or the CNT-proteins pendrin and NCX1. No significant differences between lithium-treated AQP2-CNT-KO mice and lithium-treated WT mice were detected in AQP2 or AQP3 abundance in the inner medulla (Supplemental Fig. 2A).
Discussion
The distal nephron plays a key role in AVP-regulated water reabsorption and hence overall maintenance of body fluid balance. Although the contribution of the CD to this process is clear, the contribution of the CNT is less well defined, due to both its inaccessibility and that, previously, no suitable gene deletion methods for this segment existed. To examine the role of the CNT in water balance, the rate-limiting apical water channel of this segment, AQP2, was deleted in mouse CNT. AQP2-CNT-KO mice were generated by mating mice harboring loxP sites around exon 3 of the AQP2 gene (Rojek et al. 2006) with mice expressing Cre recombinase driven by the V-ATPase B1-subunit promoter (Miller et al. 2009). Very little AQP2 was observed in the CNT of AQP2-CNT-KO mice by various immunolabelling techniques, while Western blotting demonstrated lower cortical AQP2 abundance. The abundance of the CNT-expressed proteins pendrin and NCX1 was not different, suggesting there were no general effects on CNT integrity or abundance. Thus, we conclude from this that our novel mouse model had deletion of AQP2 from the majority of CNT cells and thus was suitable for studying the role of the CNT in renal water handling.
Importantly, our development of AQP2-CNT-KO mice provides ‘proof-of-principle’ that mice containing Cre recombinase under the control of the V-ATPase B1-subunit promoter can be used as a model system to delete genes expressed in the CNT principal cells. Thus, although postulated from previous studies, the role of the CNT in sodium and potassium balance via, for example, ENaC, ROMK and MaxiK channels can now be directly tested by generation of gene deletion models (Bailey et al. 2006; Christensen et al. 2010).
Under basal conditions, with free access to water, AQP2-CNT-KO mice had a 1.5-fold increase in urine volume and a similar fold-decrease in urine osmolality; highlighting that the CNT plays an important role in maintaining normal urine output. However, CNT-specific KO mice were able to decrease their urine output and increase their urine osmolality (although to a lesser degree) in response to 24 h water restriction, or increase urine osmolality when challenged with an acute supra-physiological injection of dDAVP. Thus, AQP2-CNT-KO mice suffer from a mild defect in renal water handling, but can concentrate their urine under conditions of increased circulating AVP; therefore, the defect cannot be classified as NDI. One caveat to take into consideration is that based on our immunolabelling and previous studies by Miller et al. (Miller et al. 2005, 2009), the deletion of AQP2 in some of the CNTs in our mouse model might only be partial, making the role of the CNT in the urinary-concentrating mechanism greater than observed in our study.
In contrast to the mild phenotype reported here, mice with AQP2 deletion in the CD alone had a 10-fold increase in urine volume and a proportional decrease in urinary osmolality compared with controls (Rojek et al. 2006). A 3 h water deprivation resulted in only a marginal decrease in urine output and no change in urine osmolality in these mice (Rojek et al. 2006). These results, taken alongside those of the current study and the finding that AQP2 deletion throughout the renal tubule is lethal (Rojek et al. 2006), point towards the CD having the major role in AVP-mediated antidiuresis, with the CNT having a minor but still substantial contribution to water conservation. Alternatively, it is plausible that CD water reabsorption can compensate for the absence of AQP2 in the CNT, whereas the CNT cannot compensate for the absence of AQP2 in downstream CD segments.
During basal conditions, the AQP2-CNT-KO mice are in a steady state, and are thus expected to drink more to compensate for the increased excretion of water. The initial water loss, resulting in slight hypernatraemia or hypovolemia would work as a trigger for increased thirst, but also for increased AVP excretion, which may lead to a compensating response in the abundance of other proteins involved in the urinary-concentrating mechanism. However, we observed no significant differences in AQP3, AQP4 and NKCC2 abundances in any kidney region, or AQP2 expression and phosphorylation in the inner medulla. As the AQP2-CNT-KO mice had free access to water when their higher urine volume was observed, they are unlikely to be in a continuous state of volume depletion and the absence of any compensatory response might be due to the absence of sustained increases in plasma AVP levels. Alternatively, under steady-state conditions the lack of compensation may be the consequence of desensitization to AVP. Previously, it was shown that in isolated CDs of rats treated with dDAVP for 3 days, AVP addition evoked a smaller cAMP response than in untreated rats (Dublineau et al. 1992), most likely due to internalization of the AVP type-2 receptor (Robben et al. 2004). However, as the AQP2-CNT-KO mice respond normally to a dDAVP injection, this scenario is unlikely.
During lithium treatment, both control and AQP2-CNT-KO mice developed a concentrating defect, as shown by the increase in urine output and decrease in urine osmolality. However, the defect in AQP2-CNT-KO mice continued to be more severe than in the control mice. Compared with controls, the 1.5-fold lower urine osmolality in AQP2-CNT-KO mice during basal conditions decreased to about a 2.1-fold lower urine osmolality after lithium treatment, with a similar fold-increase in urine volume. This greater difference might be explained by the inability of the CD to compensate for the absence of AQP2 in the CNT during lithium treatment.
Lithium-NDI coincides with AQP2 and AQP3 downregulation (Marples et al. 1995; Kwon et al. 2000). AQP2 abundance in the cortex was significantly reduced in AQP2-CNT-KO and WT mice by lithium, but remained lower in the AQP2-CNT-KO mice, similar to the lower abundance found during basal conditions. No significant effect of lithium was observed on AQP3 abundance in the cortex, while in the inner medulla, AQP3 expression, as well as AQP2 expression, was significantly reduced by lithium. However, immunoblotting showed no significant differences between lithium-treated AQP2-CNT-KO mice and WT mice, suggesting that lithium affects these proteins in both groups of animals to a similar extent.
The role of AQP2 in the CNT in lithium-NDI development is not known. However, the continued lower AQP2 expression in the renal cortex of AQP2-CNT-KO mice suggests that control mice do not develop a severe AQP2 downregulation in the CNT during lithium treatment. It would be expected that if the cells of the CNT were affected by lithium, the lower cortical AQP2 abundance observed in AQP2-CNT-KO mice compared with controls would normalize. Combined with the finding that lithium treatment increases the differences in urine osmolality between control and AQP2-CNT-KO mice, we conclude that unlike CD principal cells, principal cells of the CNT are not severely affected by lithium treatment.
In conclusion, we have demonstrated that deletion of AQP2 from the CNT of mice results in defective renal water handling under basal conditions, without diminished maximal urinary-concentrating ability. Our studies suggest that the CNT plays a minor role in regulation of whole body water balance, or that dysfunction of the CNT can be compensated for by increased water reabsorption in the CD.
Acknowledgments
The authors thank Inger Merete Paulsen, Helle Høyer, Christian Westberg, Else-Merete Locke and Bodil Kruse for expert technical assistance. Funding for this study (to R.A.F.) is provided by the Danish Medical Research Council, the Novo Nordisk Foundation, the Carlsberg Foundation (Carlsbergfondet) and the Lundbeck Foundation. The Centre for Interactions of Proteins in Epithelial Transport (InterPrET) is supported by the Aarhus University Research Foundation.
Glossary
- AQP2
aquaporin-2
- AVP
arginine vasopressin
- BW
body weight
- CD
collecting duct
- CNT
connecting tubule
- dDAVP
desmopressin
- KO
knockout
- NCX1
sodium/calcium exchanger 1
- NDI
nephrogenic diabetes insipidus
- NKCC2
sodium potassium chloride cotransporter
- PCR
polymerase chain reaction
- WT
wild-type
Author contributions
Experiments were performed at the Department of Biomedicine, Faculty of Health Sciences, Aarhus University, Aarhus, Denmark. M.L.A.K.: conception and design of the experiments; collection, analysis and interpretation of data; drafting the article or revising it critically for important intellectual content; N.B.P.: conception and design of the experiments; collection, analysis and interpretation of data; drafting the article or revising it critically for important intellectual content; R.L.M.: drafting the article or revising it critically for important intellectual content; A.R.: drafting the article or revising it critically for important intellectual content; R.A.F.: conception and design of the experiments; collection, analysis and interpretation of data; drafting the article or revising it critically for important intellectual content. All authors approved the final version of the manuscript.
Supplementary material
Supplemental Fig. 1
Supplemental Fig. 2
Supplemental Table 1
Supplemental Table 2
References
- Bailey MA, Cantone A, Yan Q, MacGregor GG, Leng Q, Amorim JB, Wang T, Hebert SC, Giebisch G, Malnic G. Maxi-K channels contribute to urinary potassium excretion in the ROMK-deficient mouse model of Type II Bartter's syndrome and in adaptation to a high-K diet. Kidney Int. 2006;70:51–59. doi: 10.1038/sj.ki.5000388. [DOI] [PubMed] [Google Scholar]
- Boton R, Gaviria M, Batlle DC. Prevalence, pathogenesis, and treatment of renal dysfunction associated with chronic lithium therapy. Am J Kidney Dis. 1987;10:329–345. doi: 10.1016/s0272-6386(87)80098-7. [DOI] [PubMed] [Google Scholar]
- Christensen BM, Kim YH, Kwon TH, Nielsen S. Lithium treatment induces a marked proliferation of primarily principal cells in rat kidney inner medullary collecting duct. Am J Physiol Renal Physiol. 2006;291:F39–F48. doi: 10.1152/ajprenal.00383.2005. [DOI] [PubMed] [Google Scholar]
- Christensen BM, Marples D, Kim YH, Wang W, Frokiaer J, Nielsen S. Changes in cellular composition of kidney collecting duct cells in rats with lithium-induced NDI. Am J Physiol Cell Physiol. 2004;286:C952–C964. doi: 10.1152/ajpcell.00266.2003. [DOI] [PubMed] [Google Scholar]
- Christensen BM, Perrier R, Wang Q, Zuber AM, Maillard M, Mordasini D, Malsure S, Ronzaud C, Stehle JC, Rossier BC, Hummler E. Sodium and potassium balance depends on alphaENaC expression in connecting tubule. J Am Soc Nephrol. 2010;21:1942–1951. doi: 10.1681/ASN.2009101077. [DOI] [PMC free article] [PubMed] [Google Scholar]
- Christensen BM, Wang W, Frokiaer J, Nielsen S. Axial heterogeneity in basolateral AQP2 localization in rat kidney: effect of vasopressin. Am J Physiol Renal Physiol. 2003;284:F701–F717. doi: 10.1152/ajprenal.00234.2002. [DOI] [PubMed] [Google Scholar]
- Christensen BM, Zuber AM, Loffing J, Stehle JC, Deen PM, Rossier BC, Hummler E. alphaENaC-mediated lithium absorption promotes nephrogenic diabetes insipidus. J Am Soc Nephrol. 2011;22:253–261. doi: 10.1681/ASN.2010070734. [DOI] [PMC free article] [PubMed] [Google Scholar]
- Coleman RA, Wu DC, Liu J, Wade JB. Expression of aquaporins in the renal connecting tubule. Am J Physiol Renal Physiol. 2000;279:F874–F883. doi: 10.1152/ajprenal.2000.279.5.F874. [DOI] [PubMed] [Google Scholar]
- Dublineau I, Pradelles P, de Rouffignac C, Elalouf JM. Desensitization to vasopressin action in the rat kidney medulla: studies on isolated nephron segments. Ren Physiol Biochem. 1992;15:57–65. doi: 10.1159/000173442. [DOI] [PubMed] [Google Scholar]
- Ecelbarger CA, Terris J, Frindt G, Echevarria M, Marples D, Nielsen S, Knepper MA. Aquaporin-3 water channel localization and regulation in rat kidney. Am J Physiol Renal Physiol. 1995;269:F663–F672. doi: 10.1152/ajprenal.1995.269.5.F663. [DOI] [PubMed] [Google Scholar]
- Fenton RA, Brond L, Nielsen S, Praetorius J. Cellular and subcellular distribution of the type-2 vasopressin receptor in the kidney. Am J Physiol Renal Physiol. 2007;293:F748–F760. doi: 10.1152/ajprenal.00316.2006. [DOI] [PubMed] [Google Scholar]
- Fenton RA, Chou CL, Stewart GS, Smith CP, Knepper MA. Urinary concentrating defect in mice with selective deletion of phloretin-sensitive urea transporters in the renal collecting duct. Proc Natl Acad Sci U S A. 2004;101:7469–7474. doi: 10.1073/pnas.0401704101. [DOI] [PMC free article] [PubMed] [Google Scholar]
- Gottschalk CW, Mylle M. Micropuncture study of the mammalian urinary concentrating mechanism: evidence for the countercurrent hypothesis. Am J Physiol. 1959;196:927–936. doi: 10.1152/ajplegacy.1959.196.4.927. [DOI] [PubMed] [Google Scholar]
- Hasler U, Mordasini D, Bens M, Bianchi M, Cluzeaud F, Rousselot M, Vandewalle A, Feraille E, Martin PY. Long term regulation of aquaporin-2 expression in vasopressin-responsive renal collecting duct principal cells. J Biol Chem. 2002;277:10379–10386. doi: 10.1074/jbc.M111880200. [DOI] [PubMed] [Google Scholar]
- Imai M. The connecting tubule: a functional subdivision of the rabbit distal nephron segments. Kidney Int. 1979;15:346–356. doi: 10.1038/ki.1979.46. [DOI] [PubMed] [Google Scholar]
- Kim GH, Ecelbarger CA, Mitchell C, Packer RK, Wade JB, Knepper MA. Vasopressin increases Na-K-2Cl cotransporter expression in thick ascending limb of Henle's loop. Am J Physiol Renal Physiol. 1999;276:F96–F103. doi: 10.1152/ajprenal.1999.276.1.F96. [DOI] [PubMed] [Google Scholar]
- Kim YH, Kwon TH, Frische S, Kim J, Tisher CC, Madsen KM, Nielsen S. Immunocytochemical localization of pendrin in intercalated cell subtypes in rat and mouse kidney. Am J Physiol Renal Physiol. 2002;283:F744–F754. doi: 10.1152/ajprenal.00037.2002. [DOI] [PubMed] [Google Scholar]
- Kwon TH, Laursen UH, Marples D, Maunsbach AB, Knepper MA, Frokiaer J, Nielsen S. Altered expression of renal AQPs and Na(+) transporters in rats with lithium-induced NDI. Am J Physiol Renal Physiol. 2000;279:F552–F564. doi: 10.1152/ajprenal.2000.279.3.F552. [DOI] [PubMed] [Google Scholar]
- Lassiter WE, Gottschalk CW, Mylle M. Micropuncture study of net transtubular movement of water and urea in nondiuretic mammalian kidney. Am J Physiol. 1961;200:1139–1147. doi: 10.1152/ajplegacy.1961.200.6.1139. [DOI] [PubMed] [Google Scholar]
- Loffing J, Kaissling B. Sodium and calcium transport pathways along the mammalian distal nephron: from rabbit to human. Am J Physiol Renal Physiol. 2003;284:F628–F643. doi: 10.1152/ajprenal.00217.2002. [DOI] [PubMed] [Google Scholar]
- Loffing J, Loffing-Cueni D, Macher A, Hebert SC, Olson B, Knepper MA, Rossier BC, Kaissling B. Localization of epithelial sodium channel and aquaporin-2 in rabbit kidney cortex. Am J Physiol Renal Physiol. 2000;278:F530–F539. doi: 10.1152/ajprenal.2000.278.4.F530. [DOI] [PubMed] [Google Scholar]
- Marples D, Christensen S, Christensen EI, Ottosen PD, Nielsen S. Lithium-induced downregulation of aquaporin-2 water channel expression in rat kidney medulla. J Clin Invest. 1995;95:1838–1845. doi: 10.1172/JCI117863. [DOI] [PMC free article] [PubMed] [Google Scholar]
- Miller RL, Lucero OM, Riemondy KA, Baumgartner BK, Brown D, Breton S, Nelson RD. The V-ATPase B1-subunit promoter drives expression of Cre recombinase in intercalated cells of the kidney. Kidney Int. 2009;75:435–439. doi: 10.1038/ki.2008.569. [DOI] [PMC free article] [PubMed] [Google Scholar]
- Miller RL, Zhang P, Smith M, Beaulieu V, Paunescu TG, Brown D, Breton S, Nelson RD. V-ATPase B1-subunit promoter drives expression of EGFP in intercalated cells of kidney, clear cells of epididymis and airway cells of lung in transgenic mice. Am J Physiol Cell Physiol. 2005;288:C1134–C1144. doi: 10.1152/ajpcell.00084.2004. [DOI] [PubMed] [Google Scholar]
- Moeller HB, Knepper MA, Fenton RA. Serine 269 phosphorylated aquaporin-2 is targeted to the apical membrane of collecting duct principal cells. Kidney Int. 2009;75:295–303. doi: 10.1038/ki.2008.505. [DOI] [PMC free article] [PubMed] [Google Scholar]
- Nielsen J, Kwon TH, Praetorius J, Frokiaer J, Knepper MA, Nielsen S. Aldosterone increases urine production and decreases apical AQP2 expression in rats with diabetes insipidus. Am J Physiol Renal Physiol. 2006;290:F438–F449. doi: 10.1152/ajprenal.00158.2005. [DOI] [PubMed] [Google Scholar]
- Nielsen S, Chou CL, Marples D, Christensen EI, Kishore BK, Knepper MA. Vasopressin increases water permeability of kidney collecting duct by inducing translocation of aquaporin-CD water channels to plasma membrane. Proc Natl Acad Sci U S A. 1995;92:1013–1017. doi: 10.1073/pnas.92.4.1013. [DOI] [PMC free article] [PubMed] [Google Scholar]
- Robben JH, Knoers NV, Deen PM. Regulation of the vasopressin v2 receptor by vasopressin in polarized renal collecting duct cells. Mol Biol Cell. 2004;15:5693–5699. doi: 10.1091/mbc.E04-04-0337. [DOI] [PMC free article] [PubMed] [Google Scholar]
- Rojek A, Fuchtbauer EM, Kwon TH, Frokiaer J, Nielsen S. Severe urinary concentrating defect in renal collecting duct-selective AQP2 conditional-knockout mice. Proc Natl Acad Sci U S A. 2006;103:6037–6042. doi: 10.1073/pnas.0511324103. [DOI] [PMC free article] [PubMed] [Google Scholar]
- Sarmiento JM, Ehrenfeld P, Anazco CC, Reyes CE, Troncoso S, Figueroa CD, Muller-Esterl W, Gonzalez CB. Differential distribution of the vasopressin V receptor along the rat nephron during renal ontogeny and maturation. Kidney Int. 2005;68:487–496. doi: 10.1111/j.1523-1755.2005.00426.x. [DOI] [PubMed] [Google Scholar]
- Shi PP, Cao XR, Qu J, Volk KA, Kirby P, Williamson RA, Stokes JB, Yang B. Nephrogenic diabetes insipidus in mice caused by deleting COOH-terminal tail of aquaporin-2. Am J Physiol Renal Physiol. 2007;292:F1334–F1344. doi: 10.1152/ajprenal.00308.2006. [DOI] [PMC free article] [PubMed] [Google Scholar]
- Terris J, Ecelbarger CA, Nielsen S, Knepper MA. Long-term regulation of four renal aquaporins in rats. Am J Physiol Renal Physiol. 1996;271:F414–F422. doi: 10.1152/ajprenal.1996.271.2.F414. [DOI] [PubMed] [Google Scholar]
- Thomas MJ, Sjaastad I, Andersen K, Helm PJ, Wasserstrom JA, Sejersted OM, Ottersen OP. Localization and function of the Na+/Ca2+-exchanger in normal and detubulated rat cardiomyocytes. J Mol Cell Cardiol. 2003;35:1325–1337. doi: 10.1016/j.yjmcc.2003.08.005. [DOI] [PubMed] [Google Scholar]
- Thomsen K. The effect of sodium chloride on kidney function in rats with lithium intoxication. Acta Pharmacol Toxicol. 1973;33:92–102. doi: 10.1111/j.1600-0773.1973.tb01512.x. [DOI] [PubMed] [Google Scholar]
- Yang B, Gillespie A, Carlson EJ, Epstein CJ, Verkman AS. Neonatal mortality in an aquaporin-2 knock-in mouse model of recessive nephrogenic diabetes insipidus. J Biol Chem. 2001;276:2775–2779. doi: 10.1074/jbc.M008216200. [DOI] [PubMed] [Google Scholar]
- Yang B, Zhao D, Qian L, Verkman AS. Mouse model of inducible nephrogenic diabetes insipidus produced by floxed aquaporin-2 gene deletion. Am J Physiol Renal Physiol. 2006;291:F465–F472. doi: 10.1152/ajprenal.00494.2005. [DOI] [PubMed] [Google Scholar]
Associated Data
This section collects any data citations, data availability statements, or supplementary materials included in this article.


