

Abstract
Purpose
To better understand the nature of glaucomatous damage, especially to the macula, the inner retinal thickness maps obtained with frequency domain optical coherence tomography (fdOCT) were averaged.
Methods
Frequency domain optical coherence tomography macular and optic disc cube scans were obtained from 54 healthy eyes and 156 eyes with glaucomatous optic neuropathy. A manually corrected algorithm was used for layer segmentation. Patients' eyes were grouped both by mean deviation (MD) and hemifield classification using standard categories and 24-2 (6° grid) visual fields (VFs). To obtain average difference maps, the thickness of retinal nerve fiber (RNF) and retinal ganglion cell plus inner plexiform (RGC+) layers were averaged and subtracted from the average control values.
Results
On the average difference maps, RGC+ and RNF layer thinning was seen in the patient groups with VFs classified as normal. The pattern of the thinning was the same, but the degree of thinning increased with decreased MD and with classification category (from normal to arcuate). This RGC+ thinning was largely within the central four points of the 24-2 (6° grid) field, after correcting for RGC displacement.
Conclusion
1. VF categories represent different degrees of the same pattern of RGC+ and RNFL layer thinning. 2. RGC+ damage occurs in the central macula even in patients with VFs classified as normal. 3. The 6° grid (24-2) pattern is not optimally designed to detect macular damage. 4. A schematic model of RGC projections is proposed to explain the pattern of macular loss, including the greater vulnerability of the inferior retinal region.
Translational relevance
The 24-2 is not an optimal test pattern for detecting or following glaucomatous damage. Further, we suggest clinical fdOCT reports include RGC+ and RNFL probability plots combined with VF information.
Keywords: glaucoma, optical coherence tomography, perimetry, visual fields, macula
Introduction
Detection of very early glaucoma remains a challenge. In general, the diagnosis is based on structural and functional abnormalities. Static automated perimetry provides the measure of visual field (VF) function in most clinical settings. While optic disc examination typically provides the structural measure, imaging devices are increasing in resolution, and their ability to detect fine detail in the retina is making them ever more important as a structural measure.
Since the advent of optical coherence tomography (OCT) scanning of the retina, the thickness of the peripapillary retinal nerve fiber layer (RNFL) has been used as a structural measure of glaucomatous damage.1,2 With the relatively new frequency domain (fd) OCT, it is now possible to distinguish the thickness of the other inner retina layers, e.g., retinal ganglion cell (RGC) layer plus inner plexiform (IP) layer from the RNFL.3–6 This has made it possible to study RGCs in the macula, where their density is greatest, and compare the results to VF measures. For example, Wang et al,5 using a manual segmentation procedure, found that the local thickness of the RGC+IP (RGC+) layer shows qualitative agreement with local loss in VF sensitivity. More recently, Raza et al7 combined an automated segmentation algorithm8 with a hand-correction technique to measure the RGC+ layer thickness seen on frequency domain optical coherence tomography (fdOCT) macular cube scans. These thickness values can be presented as probability maps indicating the regions of the macula with an abnormally thin RGC+ or RNFL.9 These probability maps provide information about the RGCs of a particular patient and can be compared directly to the VF probability plot.9
This work is part of the larger literature using fdOCT disc and/or macular scans to study individual patients, often with the goal of improving sensitivity and specificity for detecting glaucomatous damage or its progression. Here a different approach was taken. Instead of focusing on the individual, the OCT thickness maps from healthy controls and patients with glaucomatous optic neuropathy were averaged. While averaging discarded information about the individual, it provided a clearer view of common patterns and trends. The purpose was to better understand the patterns of glaucomatous abnormalities by averaging the RGC+ and RNFL thickness maps from fdOCT scans. Patients were grouped based upon the pattern and overall degree of their field loss by mean deviations (MDs). As detailed below, a number of interesting findings emerged from these data, including the nature and extent of glaucomatous damage of the macula. These findings have implications for glaucoma screening, diagnosis, monitoring, and treatment.
Methods
Subjects
The healthy control group consisted of 54 eyes (53.2 ± 8.0 years) from 54 individuals (data supplied by Topcon, Inc.). They were selected from a larger group (n = 128) of controls based upon being older than 40 years. Inclusion criteria were: a correction between +3.0D and −6.0D, IOP ≤ 21 mmHg; axial length between 22 to 26 mm; a normal clinical examination, and normal VFs (SITA Standard 24-2 test procedure; Carl Zeiss Meditec, Inc, Dublin, CA); false negative responses and fixation losses ≤ 33% and false positives ≤ 15%). Exclusion criteria included a history of ocular disease or a family history of glaucoma.
The patient group consisted of 156 eyes (55.7 ± 11.9 years) of 96 patients, all of whom had glaucomatous optic neuropathy in at least one eye based on clinical examination. Reliability criteria for the 24-2 VFs were fixation losses ≤ 30%, and false negative rate ≤ 30% and false positive rate ≤ 15%. The VFs could be normal, and thus the eyes studied included glaucoma suspects. Patients with cataracts and/or a history of ocular surgery or of other ocular or neurologic diseases that could affect structural or functional measurements were excluded. Written, informed consent was obtained from all participants. All subjects were treated in accordance with the Declaration of Helsinki and the protocol was approved by the institutional review boards of Columbia University and New York Eye and Ear Infirmary.
Visual Field Classification and Analysis
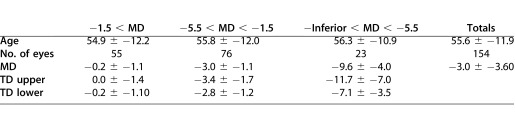
The patients' eyes were grouped in two ways: by MD and by perimetric superior and inferior hemifield classifications. For the MD groups, the MD for the entire field (from the 24-2 VF report) was used to form three patient groups with MD values better than −1.5 dB (n = 55 eyes), −1.5 to −5.5 dB (n = 76), and worse than −5.5 dB (n = 23). Table 1 shows the mean (±SD) of the MD and age of the eyes in each group, along with the average total deviation (TD) for the upper and lower hemifields. Note the latter was taken as the average of the TD values in dB in a superior or inferior hemifield.
Table 1.
Eyes Grouped by MD
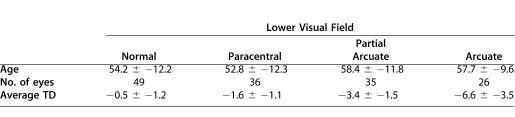
For the grouping by perimetric hemifield classification, one of the authors (C.A.J.), experienced in VF classification, categorized the VFs of the 24-2 tests according to the scheme described by Keltner et al.10 Table 2 shows the seven categories used. For further analysis, four categories were focused on: normal, paracentral, partial arcuate, and arcuate. These categories were chosen for two reasons. First, these categories included 26 or more hemifields. Second, according to Keltner et al.,10 all four involve nerve fiber bundle damage, with the damage increasing from paracentral to arcuate defects for early to moderate glaucomatous VF losses. This left 144 eyes (55.9 years) for the upper field and 146 eyes (55.5 years) for the lower field. Table 3 shows the mean (± SD) age of the eyes in each group analyzed, along with the average total deviation.
Table 2.
Eyes Grouped by Category of VF Defect
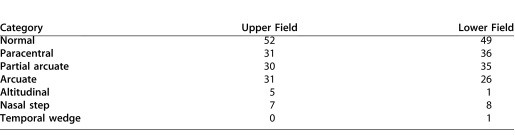
Table 3.
Characteristics of Upper and Lower VF Categories
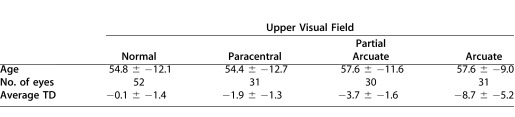
Table 3.
Extended
OCT Testing and Analysis
All subjects had 3D cube (volume) scans (over a 6 mm by 6 mm region, 128 horizontal B-scans with 512 A-scans each) obtained with both the macula and optic disc fixation targets (3D-OCT 1000; Topcon, Inc., Paramus, NJ). Scans with poor fixation and blink artifacts were rejected. To determine the thickness of the RGC+ and RNF layers, a combination of automated segmentation8 and hand-correction7 was used. In particular, for each B-scan, the boundaries of anatomic layers were determined using a previously validated automated segmentation algorithm,8 which was then hand-corrected. Trained operators, who were masked to the other information about the patient, did the hand-correction.
Figure 1 shows the results for a single healthy control. The right column contains a sample B-scan through the center of the macula (top two panels) and optic disc (bottom panel). Measurements were made for the thickness of both the RGC+ and RNF layers for the macula scans and the RNFL for the optic disc scan. (Measurements were not made of the RGC+ thickness for the optic disc scan as it was sometimes difficult to identify the border between the IP and inner nuclear layers. In any case, the RGC+ layer is thin outside the macula7 and thus adds little information.) From the segmented results, two thickness maps were generated for the macular scan (RGC+ and RNF layers) and one map (RNFL) for the optic disc scan. These are displayed in Figure 1 (left column) in pseudo-color.
Figure 1. .

Left column: RGC+IPL and RNFL thickness maps shown in pseudo-color for the fdOCT cube scans of the macular and optic disc. Right column: Midline horizontal B-scans illustrating the borders segmented and the layers measured.
The centers of the fovea and disc were determined for each individual. By aligning the macular and cube scans based upon blood vessels, a calculation was made of the fovea-to-disc distance and the angle between the centers of the disc and fovea for each individual. From these individual data, average values were computed.
Results
Healthy Controls
Figure 1 (first column) shows the RGC+ layer and RNFL thickness values, presented in pseudo-color, for a single healthy control. The average thickness values for all 54 healthy controls are shown in Figure 2 for the optic disc (A) and macular (B) scans. All eyes are shown in retinal view so that the superior retinal region corresponds to the lower VF. In addition, all eyes are presented as if they were right eyes.
Figure 2.

(A) The average RNFL thickness map from the optic disc scans of the healthy control eyes. (B) The average RNFL (left) and RGC+IPL (right) thickness maps from the macular scans of the healthy control eyes. (C) The RNFL maps from panels A and B are superimposed by aligning the foveal (yellow +) and disc (black +) centers. Because disc sizes vary, the white ellipsoid masks the central region on the disc scan where data for at least 95% of the controls did not exist.
There are two RNFL thickness maps in Figure 2, one from the optic disc scan (panel A) and one from the macular scan (left column of panel B). The two RNFL thickness maps were combined in panel C after aligning them using the average distance (14.9°) between the center of the fovea (yellow +) and optic disc (black +) and the average angular offset (6.4°) of the disc relative to the fovea. These values were obtained from the 54 healthy control eyes (see Methods section) and are similar to those in the literature.11–14 The red and yellow areas in Figure 2C are the well-known thick RNFL regions associated with the preponderance of arcuate fibers in the superior and inferior quadrants of the disc. (Note: while most of this thickness is due to the increased density of axons, part of it is due to contributions of blood vessels in this region.)15 There are important aspects of Figure 2C, which will be considered further in the Discussion section. However, for now it is noted that the RNFL is relatively thin in the macular cube scan and thus the macular RNFL thickness plot is ignored in the interest of simplifying subsequent figures.
The average thickness of the macular RGC+ region in Figure 2B (right panel) has the donut appearance previously reported for primate histology.16 There is an annulus of increased thickness surrounding the fovea with little or no RGC+ thickness in the center of the fovea. The RGC+ is thickest (dark red) at about 5°, and thicker along the horizontal meridian in the nasal as compared to the temporal retina. This pattern is in excellent agreement with a recent segmentation of the RGC and IP layers of human postmortem tissue.17
Eyes Grouped by MD of VF
The patients' eyes were divided into three groups based upon the MDs of their 24-2 VFs (see Methods section), and their thickness plots averaged. The left two columns of Figure 3 show the RNFL and RGC+ layer thickness maps. To obtain a clearer picture of the differences among groups, the thickness values in panel A for the healthy controls were subtracted from the patients' thickness maps. The resultant difference plots are shown in the right two columns, where the scale (lower panel) ranges from dark green, indicating a difference ≤0 μm, to dark red, indicating a difference >60 μm (RNFL) or >30 μm (RGC+).
Figure 3. .

Results are shown for the healthy controls (A) and for the patients' eyes grouped according to MD of the 24-2 visual field, better than −1.5 MD (B); between −1.5 and −5.5 dB (C); and worse than −5.5 dB (D). The left two columns show the thickness maps of the RNFL of the disc scan and RGC+IPL of the macular scan. The right two columns are the difference maps produced by subtracting the thickness map of the controls from the thickness map of the patient group. Because disc sizes vary, the white ellipsoids masks the central region on the disc scans where data for at least 95% of the controls and 95% of the patients did not exist.
There was a clear thinning of both the RNF and RGC+ layers, even for the group with a MD better than −1.5 dB. This thinning increases with decreased MD.
In addition, it was clear that the thinning associated with the inferior retina (lower gray arrow) was greater than that of the superior retina (upper black arrow). The field data in Table 1 are in general agreement. For the group represented in panel D, the average TD for the upper visual hemifield (inferior retina) was −4.6 dB less than the TD of the lower visual hemifield (superior retina).
Hemifields of VFs Grouped by Defect Classification
Superior and inferior perimetric hemifields were classified separately as described in the Methods section. Table 2 indicates the number of hemifields in each category. The results were averaged for the four groups (normal, paracentral, partial arcuate, and arcuate) with ≥30 eyes (see Table 2). These four categories should also represent increasingly severe retinal fiber bundle defects.10 The average thickness maps for the 54 control eyes from Figure 2 are reproduced in Figure 4A. As the analysis in Figure 4 was for defects of the upper field (inferior retina), the superior retina was partially occluded as a reminder that the focus here was on the inferior retina. As expected, the RNFL became thinner moving down the left column from the control group to the group with superior arcuate defects. This progressive thinning was easier to see in the third column, which showed the difference between the thickness of each group and that of the controls. This thinning became greater, and the region larger, from the superior fields classified as normal (B) to those classified as arcuate (E). However, an obvious difference was seen in the pattern of these results. The solid black contour in the lower panel (third column) was drawn to coincide with the yellow (−30 μm) contour in panel E (third column). This same contour was shown in the other panels as the dotted curve to support the point that the general region of the defect did not appear to change.
Figure 4. .

Results are shown for the healthy controls (A) and for the patients' eyes grouped according to classification of the superior visual field, normal (no damage) (B); paracentral defect (C); partial arcuate defect (D); and arcuate defect (E). The left two columns show the thickness maps of the RNFL of the disc scan and RGC+ IP layers of the macular scan. The right two columns are the difference maps produced by subtracting the thickness map of the controls from the thickness map of the patient group. The solid black curves in the left two panels of E are iso-thickness contours. These are superimposed on the panels above (dotted curves).
The thickness and difference maps for the macular RGC+ region were shown in the second and fourth columns of Figure 4. The results were similar. First, there was a progressively greater thinning of this region, the group with normal fields (B) showed the least and the arcuate group showed the greatest. Second, the same region was involved in all groups (see dotted black contour for −15 μm). The results for the lower field were similar, although less extreme, as the damage was less severe.
To compare the relative thinning in the RNF and RGC+ layers, the difference maps in Figures 3 and 4 were converted to z scores using the standard errors (SEs) of the patient and control groups. Figure 5 shows the z-score plots for both groupings of VFs. Given the sample sizes, it was not surprising that the z-scores were so large. What was somewhat surprising is how the z values for the RGC+ layer of the macular region were typically as large as those for the arcuate fiber bundle.
Figure 5. .

The difference plots from Figures 3 and 4 are shown here converted to z scores using the SEs of the patient and control groups.
Discussion
The general purpose here was to better understand patterns of glaucomatous abnormalities by averaging the fdOCT results from groups of patients categorized based upon their VF characteristics. Although many aspects of the results were expected, there were others that were not, or at least should be noted because of their clinical implications. While this was especially true of the glaucomatous damage of the macula, the average RNFL thinning seen in these patients is considered first.
RNFL Damage
On average, RNFL thinning was seen even in patients with MDs within the normal range (see Fig. 3) as well as in hemifields classified as normal (see Fig. 4). The average RNFL values for these groups were clearly significantly thinner than those of the controls (see Fig. 5), consistent with previous fdOCT peripapillary measures.18 As expected, the RNFL thickness showed orderly changes when the eyes were grouped by either MD or the pattern of VF loss. In particular, the thinning became greater as the MD became more extreme (more negative). For the field classification groupings, the hemifields classified as normal showed the least change in thickness, while the group with arcuate defects unsurprisingly showed the most. Keltner et al.10 point out that classification systems describe how glaucomatous defects are thought to progress from “... small, shallow deficits to large, deep defects ...” seen in the nerve fiber bundle region of the field. Also consistent with this view, the pattern/region of RNF thinning was similar across classification categories; this region just became thinner. Thus, as might be expected, while the fields could be categorized into discrete categories, the damage seen on fdOCT appeared to be continuous. Given the continuous nature of the thinning across the VF classification categories and the availability of fdOCT information, how VF damage is classified should be reconsidered. Classification schemes can be useful as a teaching aid to remind the glaucoma specialist that an abnormal region with a paracentral pattern is consistent with glaucomatous damage. In addition, the categories can also be used to stage the disease.19 That is, a partial arcuate defect should indicate less damage than one that is arcuate. For either purpose, continuous probability plots of RNFL and RGC+ thickness combined with VF damage, also expressed as continuous probability,20 may be more effective.
Damage to the Central Macula
On average, there was RGC+ damage in the central macula even in patients with MDs within normal limits and/or perimetric hemifields classified as normal (Figs. 3B, 4B). Further, consistent with recent fdOCT of macular layer thickness,21,22 the z-score plots in Figure 5 suggested that this macular damage could be as easy to detect as was damage to the thick arcuate bundles.
Most importantly, the thinning of the macular RGC+ layer appeared first and was most severe in a region that fell within the central four points on the 24-2 test grid. This was illustrated in Figure 6A where the RGC+ difference plot from Figure 3D (right panel) was superimposed upon a fundus image. The 24-2 test locations (black squares) were positioned on this fundus view without (left panel) and with (right panel) consideration of the displacement of the RGCs near the fovea.7,9,23 It was noted that the major thinning of the macula fell within the central four test locations when RGC displacement was taken into consideration. The 24-2 (6° grid) protocol was not an optimal test pattern for detecting RGC damage to the macula.
Figure 6. .

(A) The difference (thinning) plot for the RGC+ IP layers of the group with the MD < −5.5 dB from Figure 3D (rightmost panel) is shown with the test points of the 24-2. These points are positioned to coincide with the location of the RGC+IP layers activated as previously described.7,9 (B) The RGC+ IPL thinning map from A is combined with the RNFL thinning map for the same group. The dashed circle (diameter of 3.4 mm) is the locus of points used in most peripapillary scans. See text for details.
It was also noted that the region of the macula that showed the greatest thinning was not involved in the classification scheme used here or by OHTS. In particular, the central points within the black rectangle of Figure 6A were not used in the classification of VF defects.10 Thus, this central macular damage contributed little, if anything, to the categories of field defects in Table 2.
The Nature of the Damage to the Macula
For years, the VF literature has contained evidence for glaucomatous damage in the macula, even in early stages of glaucoma.24–29 The RGC+ damage seen in this study undoubtedly included the small arcuate defects close to the fovea reported previously,29,31,32 probably combined with some degree of diffuse damage.33,35 VF defects in the macula, including arcuate damage, are far more common in the upper field (inferior retina).26,27,29,31–33 For example, previous research32 shows that of 11 macular arcuate defects strictly within the central 10°, ten were in the upper VF (inferior retina). The counterpart of this finding was seen as the greater thinning of the inferior macular RGC+ layer (see Fig. 3D, gray arrow in right panel).
To understand the relation between the thinning of the macular RGC+ layer to that of the RNFL at the disc, Figure 6B combined the RNF thinning from the disc cube scan with the RGC thinning from the macular scan (Fig. 6A) from the MD < −5.5dB group. The RGC thinning map was trimmed so as to show only the central 8°. For reference, the dashed black circle (3.4 mm diameter) is the location of the peripapillary circle often used in analyzing OCT scans. The blue slanted lines on this peripapillary circle indicated the location of the range of the peaks of the RNFL damage seen in a previous study29 of ten eyes with arcuate defects in the upper VF of the macula. As Hood et al.33 explain, these macular arcuate defects are located largely in the inferior quadrant, not the temporal quadrant. The RNFL of this region of the inferior quadrant was thick (see Fig. 2C).
We hypothesize that the inferior macula was more susceptible to arcuate damage than was the superior macula because of the region of the disc to which each projected. In particular, most of the RNF bundles (red circles and black curves) of the inferior macula entered the inferior quadrant of the disc, a region at high risk for glaucomatous damage. On the other hand, the analogous bundles (blue circle and black curves) in the superior macula entered in the temporal quadrant of the disc, a region less at risk.
Figure 6C is a schematic model that encompasses a strong version of this null hypothesis. For now, it is assumed that all the RNF bundles from the RGCs in the central ±8° of the superior retina (lower VF), but only a small portion of the inferior RNF bundles, entered the temporal quadrant of the disc (see Fig. 6C, gray region). In particular, most of the RGCs of the inferior macula (i.e., those within the red borders in Fig. 6C) projected largely to the inferior quadrant of the disc. A further assumption is made that the temporal region of the disc was less susceptible to glaucomatous damage than was the inferior or superior quadrants, an assumption well-documented by fundus photographs as well as OCT and HRT measurements. For example, the peripapillary OCT studies of glaucomatous damage typically find that the superior and inferior quadrants show the best sensitivity, while the temporal region is poorer.36,37 With the assumption that the temporal region was less vulnerable, the schematic model helped explain various aspects of the VF literature on macula defects. The small squares are the locations of the RGCs associated with a VF test with a 2° grid such as the 10-2 test pattern. They were morphed to take RGC displacement7,9,23 into consideration, as mentioned above. Perimetric studies of the macula show, in general, that upper VF (lower retina) defects are more common, more severe, and closer to fixation and the horizontal meridian than are defects of the lower VF (upper retina).26,27,29,31–33 Further, the relatively preserved central isle seen in advanced glaucoma typically includes a portion of the field shown in gray.38 The schematic model provided a basis for these perimetric findings.
The Pattern of Normal RNFL Thickness and a Crowding Hypothesis for Glaucomatous Damage
In general, the thinning of both the RNF and RGC+ layers appeared greater in the inferior retina than in the superior retina, and less in the temporal region of the optic disc compared to the superior and inferior regions. The distribution of RNFL thickness in the controls suggested one possible basis for these findings.
The RNFL thickness map from Figure 2C was reproduced in Figure 7. There are a few features of this map that deserve mention. First, the minimum thickness of the RNFL on the temporal side of the fovea was close to the horizontal meridian (red dashed line). This suggested that, on average, the raphe fell approximately along the horizontal meridian. Second, the RNFL thickness just temporal to the disc was not symmetric along the horizontal meridian (yellow dashed line). The thinnest portion of the RNFL at the disc (red arrow) was considerably above the horizontal meridian and fell just below the 9 o'clock location (black line) on the disc. Third, close to the disc, the RNFL thickness was greatest in the inferior disc region (Fig. 7, dark green arrow at 6 o'clock location), followed by the superior disc (light green arrow at 12 o'clock), than the nasal disc, with the temporal disc showing the thinnest RNFL. This is the OCT/RNFL equivalent to the ISNT rule of rim thickness.39 That is, the healthy rim should be thickest in the inferior disc and thinnest in the temporal disc. (Recall that the black dashed circle around the disc was the location of the circle [diameter of 3.4 mm] used in RNFL analysis of peripapillary OCT scans.) Finally, there were subtle, but perhaps important, differences between the pattern of the arcuate fibers in the inferior and superior disc regions. To illustrate these differences, the edge of the yellow region (thickness of 80 um) was outlined in black. These contours were superimposed in panel B after transposing the superior contour (dashed) along the horizontal axis. Note that the inferior retinal region (solid black) was narrower close to the disc than was the superior retinal region (dashed black). Further, as mentioned above, the inferior RNFL (dark green arrow in panel A) was thicker close to the disc than was the superior RNFL at comparable locations (light green arrow). This combination of a thicker and more restricted arcuate region in the inferior disc was probably a developmental consequence of the disc ordinarily being above the horizontal meridian.
Figure 7. .

(A) The RNFL thickness maps from Figure 2C are shown with isocontour borders added. (B) These isocontours for the upper (dashed) and lower (solid) disc regions are compared by flipping the superior contours.
The peripapillary pattern of RNFL thickness suggested a crowding hypothesis for glaucomatous disc damage. In particular, according to this hypothesis, the probability of glaucomatous damage at any given point of the optic disc was related to the thickness at that point. In support of that hypothesis, qualitative similarity between the thickness map of the controls in Figure 7 and the loss of RNFL thickness in Figure 6B should be noted. The mechanism(s) that underlay that apparent correlation between normal thickness and vulnerability was not clear. It might have been due, at least in part, to the fact that the thicker the RNFL, the more likely damage is to be detected. On the other hand, there might have been a structural basis for the vulnerability of regions of the disc with higher axon density. For example, it is known from the work of Quigley and Addicks,40 and Dandona et al.,41 that the lamina cribrosa in the more vulnerable superior and inferior quadrants of the disc has larger pores and less connective tissue. In any case, testing whether the crowding hypothesis can predict the relative probability of damage in different regions of the VF would be worthwhile.
Translation to the Clinic Setting
From a clinical perspective, two implications of these results were found. First, and most importantly, the findings supported others30–31 in suggesting that, at best, the 24-2 is not an optimal test pattern for detecting glaucomatous damage. At worst, it can easily miss macular damage. In fact, Langerhorst et al.,30 found that in about 10% of the hemifields with both 30-2 and 10-2 tests, the 10-2 VF shows more damage than expected on the basis of the 30-2 field. They conclude that a 10-2 test should be performed on patients with questionable defects in the center of the 30-2 field. This study has been largely ignored. The 10-2 test pattern has the advantage of having many points within the central 8°. However, the 10-2 test will miss damage outside the central 10°. For glaucomatous screening, a map that has elements of both the 10-2 and 24-2 has clear advantages,31 although the optimal location of the test points has yet to be established.
Second, it is suggested to combine both RGC+ and RNFL probability plots with VF information for detecting and following glaucomatous damage.9 However, although the fdOCT data from this study suggested that damage can be detected earliest in the macular RGC+ plots as well as in the typical arcuate RNFL regions, it remains to be determined if adding macular information will improve sensitivity/specificity.
Summary
As expected, VF categories appeared to represent different degrees of the same pattern of RGC+ and RNFL damage. However, RGC+ damage occurred in the central macula, especially in the inferior region, even in patients with VFs classified as normal. The 24-2 (6° grid) test is not optimally designed to detect macular RGC damage. A schematic model of RGC projections helped explain the pattern of macular loss, including the greater vulnerability of the inferior retinal region.
Acknowledgments
Supported by National Eye Institute Grant R01-EY-02115, Glaucoma Research and Education Fund of Lenox Hill Hospital (CGDM), New York, NY, and the James Cox Chambers and Ralph and Sylvia Ablon Research Funds of the New York Glaucoma Research Institute, New York, NY
Disclosure: D.C. Hood, Topcon Inc. (F); A.S. Raza, None; C.G.V. de Moraes, None; C.A. Johnson, None; J.M. Liebmann, Topcon Inc. (F); R. Ritch, None
References
- 1.Huang D, Swanson EA, Lin CP, et al. Optical coherence tomography. Science. 1991;254:1178–81. doi: 10.1126/science.1957169. [DOI] [PMC free article] [PubMed] [Google Scholar]
- 2.Schuman JS, Hee MR, Puliafito CA, et al. Quantification of nerve fiber layer thickness in normal and glaucomatous eyes using optical coherence tomography. Arch Ophthalmol. 1995;113:586–96. doi: 10.1001/archopht.1995.01100050054031. [DOI] [PubMed] [Google Scholar]
- 3.Garvin MK, Abramoff MD, Kardon R, Russell SR, Wu X, Sonka M. Intraretinal layer segmentation of macular optical coherence tomography images using optimal 3-D graph search. IEEE Trans Med Imaging. 2008;27:1495–505. doi: 10.1109/TMI.2008.923966. [DOI] [PMC free article] [PubMed] [Google Scholar]
- 4.Garvin MK, Abramoff MD, Wu X, Russell SR, Burns TL, Sonka M. Automated 3-D intraretinal layer segmentation of macular spectral-domain optical coherence tomography images. IEEE Trans Med Imaging. 2009;28:1436–47. doi: 10.1109/TMI.2009.2016958. [DOI] [PMC free article] [PubMed] [Google Scholar]
- 5.Wang M, Hood DC, Cho JS, et al. Measurement of local retinal ganglion cell layer thickness in patients with glaucoma using frequency-domain optical coherence tomography. Arch Ophthalmol. 2009;127:875–81. doi: 10.1001/archophthalmol.2009.145. [DOI] [PMC free article] [PubMed] [Google Scholar]
- 6.Sakamoto A, Hangai M, Nukada M, et al. Three-dimensional imaging of the macular retinal nerve fiber layer in glaucoma with spectral-domain optical coherence tomography. Invest Ophthalmol Vis Sci. 2010;51:5062–70. doi: 10.1167/iovs.09-4954. [DOI] [PubMed] [Google Scholar]
- 7.Raza AS, Cho J, de Moraes CG, et al. Retinal ganglion cell layer thickness and local visual field sensitivity in glaucoma. Arch Ophthalmol. 2011;129:1529–36. doi: 10.1001/archophthalmol.2011.352. [DOI] [PMC free article] [PubMed] [Google Scholar]
- 8.Yang Q, Reisman CA, Wang Z, et al. Automated layer segmentation of macular OCT images using dual-scale gradient information. Opt Express. 2010;18:21293–307. doi: 10.1364/OE.18.021293. [DOI] [PMC free article] [PubMed] [Google Scholar]
- 9.Hood DC, Raza AS. Method for comparing visual field defects to local RNFL and RGC damage seen on frequency domain OCT in patients with glaucoma. Biomed Opt Express. 2011;2:1097–105. doi: 10.1364/BOE.2.001097. [DOI] [PMC free article] [PubMed] [Google Scholar]
- 10.Keltner JL, Johnson CA, Cello KE, et al. Classification of visual field abnormalities in the ocular hypertension treatment study. Arch Ophthalmol. 2003;121:643–50. doi: 10.1001/archopht.121.5.643. [DOI] [PubMed] [Google Scholar]
- 11.Rohrschneider K. Determination of the location of the fovea on the fundus. Invest Ophthalmol Vis Sci. 2004;45:3257–8. doi: 10.1167/iovs.03-1157. [DOI] [PubMed] [Google Scholar]
- 12.Lefèvre F, Leroy K, Delrieu B, Lassale D, Pechereau A. Study of the optic nerve head-fovea angle with retinophotography in healthy patients [in French] J Fr Ophtalmol. 2007;30:598–606. doi: 10.1016/s0181-5512(07)89664-1. [DOI] [PubMed] [Google Scholar]
- 13.Bixenman WW, von Noorden GK. Apparent foveal displacement in normal subjects and in cyclotropia. Ophthalmology. 1982;89:58–62. doi: 10.1016/s0161-6420(82)34862-9. [DOI] [PubMed] [Google Scholar]
- 14.Timberlake GT, Sharma MK, Grose SA, Gobert DV, Gauch JM, Maino JH. Retinal location of the preferred retinal locus relative to the fovea in scanning laser ophthalmoscope images. Optom Vis Sci. 2005;82:177–85. doi: 10.1097/01.opx.0000156311.49058.c8. [DOI] [PubMed] [Google Scholar]
- 15.Hood DC, Salant JA, Arthur SN, Ritch R, Liebmann JM. The location of the inferior and superior temporal blood vessels and interindividual variability of the retinal nerve fiber layer thickness. J Glaucoma. 2010;19:158–66. doi: 10.1097/IJG.0b013e3181af31ec. [DOI] [PMC free article] [PubMed] [Google Scholar]
- 16.Curcio CA, Allen KA. Topography of ganglion cells in human retina. J Comp Neurol. 1990;300:5–25. doi: 10.1002/cne.903000103. [DOI] [PubMed] [Google Scholar]
- 17.Curcio CA, Messinger JD, Sloan KR, Mitra A, McGwin G, Spaide RF. Human chorioretinal layer thicknesses measured in macula-wide, high-resolution histologic sections. Invest Ophthalmol Vis Sci. 2011;52:3943–54. doi: 10.1167/iovs.10-6377. [DOI] [PMC free article] [PubMed] [Google Scholar]
- 18.Leite MT, Zangwill LM, Weinreb RN, Rao HL, Alencar LM, Medeiros FA. Structure-function relationships using the Cirrus spectral domain optical coherence tomograph and standard automated perimetry. J Glaucoma. 2012;21:49–54. doi: 10.1097/IJG.0b013e31822af27a. [DOI] [PMC free article] [PubMed] [Google Scholar]
- 19.Brusini P, Johnson CA. Staging functional damage in glaucoma: review of different classification methods. Surv Ophthalmol. 2007;52:156–79. doi: 10.1016/j.survophthal.2006.12.008. [DOI] [PubMed] [Google Scholar]
- 20.Wall M, Johnson CA, Kardon RH, Crabb DP. Use of a continuous probability scale to display visual field damage. Arch Ophthalmol. 2009;127:749–56. doi: 10.1001/archophthalmol.2009.111. [DOI] [PubMed] [Google Scholar]
- 21.Tan O, Chopra V, Lu AT, et al. Detection of macular ganglion cell loss in glaucoma by Fourier-domain optical coherence tomography. Ophthalmology. 2009;116:2305–14. doi: 10.1016/j.ophtha.2009.05.025. [DOI] [PMC free article] [PubMed] [Google Scholar]
- 22.Kim NR, Lee ES, Seong GJ, et al. Comparing the ganglion cell complex and retinal nerve fibre layer measurements by Fourier domain OCT to detect glaucoma in high myopia. Br J Ophthalmol. 2011;95:1115–21. doi: 10.1136/bjo.2010.182493. [DOI] [PubMed] [Google Scholar]
- 23.Drasdo N, Millican CL, Katholi CR, Curcio CA. The length of Henle fibers in the human retina and a model of ganglion receptive field density in the visual field. Vision Res. 2007;47:2901–11. doi: 10.1016/j.visres.2007.01.007. [DOI] [PMC free article] [PubMed] [Google Scholar]
- 24.Aulhorn E, Harms M. Early visual field defects in glaucoma. In: Leydhecker W, editor. Glaucoma, Tutzing Symposium. Basel: Karger;; 1967. pp. 151–186. In. ed. [Google Scholar]
- 25.Drance SM. The early field defects in glaucoma. Invest Ophthalmol. 1969;8:84–91. [PubMed] [Google Scholar]
- 26.Aulhorn E, Karmeyer H. Frequency distribution in early glaucomatous visual field defects. Doc Ophthalmol Proc Series. 1977;14:75–83. [Google Scholar]
- 27.Nicholas SP, Werner EB. Location of early glaucomatous visual field defects. Can J Ophthalmol. 1980;15:131–3. [PubMed] [Google Scholar]
- 28.Anctil JL, Anderson DR. Early foveal involvement and generalized depression of the visual field in glaucoma. Arch Ophthalmol. 1984;102:363–70. doi: 10.1001/archopht.1984.01040030281019. [DOI] [PubMed] [Google Scholar]
- 29.Heijl A, Lundqvist L. The frequency distribution of earliest glaucomatous visual field defects documented by automatic perimetry. Acta Ophthalmol. 1984;62:658–64. doi: 10.1111/j.1755-3768.1984.tb03979.x. [DOI] [PubMed] [Google Scholar]
- 30.Langerhorst CT, Carenini LL, Bakker D, De Bie-Raakman MAC. Measurements for description of very early glaucomatous field defects. Wall M, Heiji A, editors. Perimetry Update 1996/1997. New York: Kugler Publications; 1997:67–73. In. eds. [Google Scholar]
- 31.Schiefer U, Papageorgiou E, Sample PA, et al. Spatial pattern of glaucomatous visual field loss obtained with regionally condensed stimulus arrangements. Invest Ophthalmol Vis Sci. 2010;51:5685–9. doi: 10.1167/iovs.09-5067. [DOI] [PMC free article] [PubMed] [Google Scholar]
- 32.Hood DC, Raza AS, de Moraes CG, et al. Initial arcuate defects within the central 10 degrees in glaucoma. Invest Ophthalmol Vis Sci. 2011;52:940–6. doi: 10.1167/iovs.10-5803. [DOI] [PMC free article] [PubMed] [Google Scholar]
- 33.Henson DB, Artes PH, Chauhan BC. Diffuse loss of sensitivity in early glaucoma. Invest Ophthalmol Vis Sci. 1999;40:3147–51. [PubMed] [Google Scholar]
- 34.Grewal DS, Sehi M, Greenfield DS. Diffuse glaucomatous structural and functional damage in the hemifield without significant pattern loss. Arch Ophthalmol. 2009;127:1442–8. doi: 10.1001/archophthalmol.2009.196. [DOI] [PubMed] [Google Scholar]
- 35.Park SC, De Moraes CG, Teng CC, Tello C, Liebmann JM, Ritch R. Initial parafoveal versus peripheral scotomas in glaucoma: risk factors and visual field characteristics. Ophthalmology. 2011;118:1782–9. doi: 10.1016/j.ophtha.2011.02.013. [DOI] [PubMed] [Google Scholar]
- 36.Leite MT, Zangwill LM, Weinreb RN, Rao HL, Alencar LM, Medeiros FA. Structure-function relationships using the Cirrus spectral domain optical coherence tomograph and standard automated perimetry. J Glaucoma. 2012;21:49–54. doi: 10.1097/IJG.0b013e31822af27a. [DOI] [PMC free article] [PubMed] [Google Scholar]
- 37.Rao HL, Babu JG, Addepalli UK, Senthil S, Garudadri CS. Retinal nerve fiber layer and macular inner retina measurements by spectral domain optical coherence tomograph in Indian eyes with early glaucoma. Eye. 2012;26:133–9. doi: 10.1038/eye.2011.277. [DOI] [PMC free article] [PubMed] [Google Scholar]
- 38.Weber J, Schultze T, Ulrich H. The visual field in advanced glaucoma. Int Ophthalmol. 1989;13:47–50. doi: 10.1007/BF02028637. [DOI] [PubMed] [Google Scholar]
- 39.Harizman N, Oliveira C, Chiang A, et al. The ISNT rule and differentiation of normal from glaucomatous eyes. Arch Ophthalmol. 2006;124:1579–83. doi: 10.1001/archopht.124.11.1579. [DOI] [PubMed] [Google Scholar]
- 40.Quigley HA, Addicks EM. Regional differences in the structure of the lamina cribrosa and their relation to glaucomatous optic nerve damage. Arch Ophthalmol. 1981;99:137–43. doi: 10.1001/archopht.1981.03930010139020. [DOI] [PubMed] [Google Scholar]
- 41.Dandona L, Quigley HA, Brown AE, Enger C. Quantitative regional structure of the normal human lamina cribrosa. A racial comparison. Arch Ophthalmol. 1990;108:393–8. doi: 10.1001/archopht.1990.01070050091039. [DOI] [PubMed] [Google Scholar]