

Abstract
The growing applications of carbon nanotubes (CNTs) inevitably increase the risk of exposure to this potentially toxic nanomaterial. In an attempt to address this issue, research has been implemented to study the biodegradation of CNTs. In particular, myeloperoxidase (MPO), an enzyme expressed by inflammatory cells of animals including humans, catalyse the degradation of oxidized carbon nanomaterials. While reactive intermediates generated by MPO efficiently degrade oxidized single-walled carbon nanotubes (o-SWCNTs); the exact mechanism of enzyme-catalysed biodegradation remains ambiguous. In this work, we tried to explain enzymatic oxidation in terms of redox potentials by employing competitive substrates for MPO such as chloride, which is oxidized by MPO to form a strong oxidant (hypochlorite), and antioxidants that have lower redox potentials than CNTs. Employing transmission electron microscopy, Raman spectroscopy, and vis-NIR absorption spectroscopy, we demonstrate that the addition of antioxidants, L-ascorbic acid and L-glutathione, with or without chloride significantly mitigates MPO-catalysed biodegradation of o-SWCNTs. This study focuses on a fundamental understanding of the mechanisms of enzymatic biodegradation of CNTs and the impact of antioxidants on these pathways.
Introduction
Over the past 20 years, the unique electronic,1 optical,2 and mechanical3 properties of carbon nanotubes (CNTs) have fuelled extensive, ground breaking research in areas such as electronics,4 sensors,5,6 composite materials,7 and energy conversion devices.8 The full commercial potential of CNTs may not be realized, however, as a consequence of the possible pro-inflammatory and toxic effects of these carbon nanomaterials.9–13 There exists a risk of human exposure as a result of either occupational or environmental exposure (i.e. as products fabricated from CNTs degrade from wear over time). Since CNT contamination may induce a robust inflammatory response and severe oxidative stress that results in tissue damage,14 it is necessary to address issues relating to CNT distribution/transformation, toxicity, and persistence.15–19 To answer some of these questions, fundamental studies demonstrated that the plant enzyme, horseradish peroxidase (HRP),20–25 and myeloperoxidase (MPO),25–28 an enzyme expressed by inflammatory cells in animals including humans, catalysed the degradation of oxidized carbon nanomaterials. In the case of the physiologically relevant enzyme, MPO, it has been established both in vitro26,27,29 and in vivo,28–30 that MPO catalysed the biodegradation of carbon nanomaterials thus decreasing the damage associated with CNT exposure. The exact mechanism of enzyme-catalysed biodegradation remains ambiguous; it has been hypothesized that the type of defects (i.e. types of functional groups), enzyme–CNT interactions, and relative oxidative strength of the enzymatic system/generated oxidant vs. the CNT contribute to the degradation process.25 In this work, we studied the effect of two water-soluble antioxidants, L-ascorbic acid (AA) and L-glutathione (GSH), on MPO-catalysed biodegradation of o-SWCNTs with and without Cl− (Fig. 1). The antioxidants were selected because they possess a lower redox potential than o-SWCNTs and therefore are more favourably oxidized by the enzymatic system.
Fig 1.
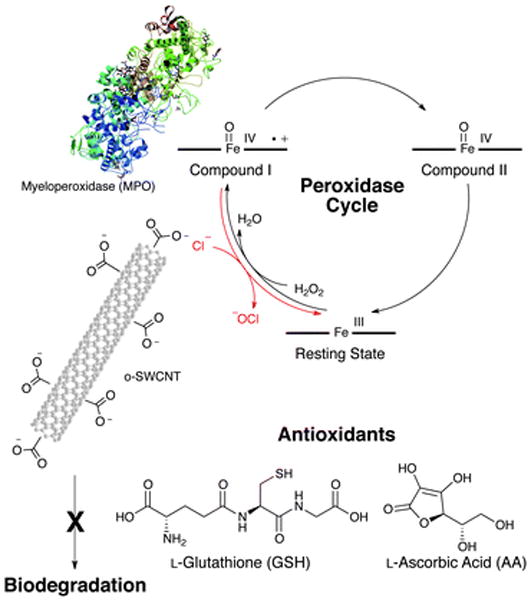
In the presence of hydrogen peroxide (H2O2), myeloperoxidase (MPO) biodegrades oxidized single-walled carbon nanotubes (o-SWCNTs) by two mechanisms: (1) reactive intermediates generated via the peroxidase cycle and (2) hypochlorite produced in the presence of chloride (Cl−). When antioxidants such as L-ascorbic acid (AA) and L-glutathione (GSH) are added to the system, the biodegradation of o-SWCNTs is mitigated.
Antioxidants serve as a natural defence system whereby cells are protected from reactive intermediates and oxidants (i.e. ‘‘oxidative stress’’).31 L-Ascorbic acid (vitamin C, AA), which is a six-carbon lactone derived from glucose by plants and most animals, functions as a scavenging water-soluble antioxidant that donates electrons sequentially resulting in the formation of the ascorbate radical and dehydroascorbic acid (DHA), respectively.32 AA mitigates lipid peroxidation by both scavenging reactive oxygen species (ROS) and via the vitamin E redox cycle.33 A second important endogenous water-soluble tripeptide antioxidant, L-glutathione (L-γ-glutamyl-L-cysteinylglycine, GSH), derives its antioxidant function from the thiol functional group (–SH) belonging to its cysteine residue.34 While the oxidized dimer of GSH, glutathione disulphide (GSSG), represents the hallmark of oxidative stress, the enzyme, glutathione reductase, maintains glutathione primarily in its reduced active form (i.e. GSH).34
Myeloperoxidase (MPO), a heme-containing enzyme, is primarily expressed in polymorphonuclear cells (PMNs) of animals including humans.35–37 Upon activation, these inflammatory cells release MPO from intracellular granules,35 where this enzyme exists in millimolar (mM) concentrations,38 to either intraphagosomal or extracellular spaces. MPO is subsequently oxidized by H2O2 from its Fe(III) resting state to MPO-Compound I, and in the presence of chloride (Cl−, 80 mM for PMNs and 140 mM in plasma),38 which represents a competitive substrate for the enzyme, MPO-Compound I is reduced back to the ferric resting state during which Cl− undergoes a two-electron oxidation to form hypochlorous acid (HOCl, Fig. 1). This oxidant, which has a pKa of 7.6,35 exists as both HOCl and the hypochlorite ion (−OCl) at physiological pH (i.e. 7.4). Moreover, with a high redox potential of 1.48 V,39 HOCl indiscriminately oxidizes invading bacteria and biologically significant macromolecules; therefore, HOCl is integral to the innate immunity35 in the former case and contributes to oxidative stress in the latter scenario. Because hypochlorite has the ability to introduce acid ‘‘defects’’ onto the surface of CNTs40 and MPO catalyses the biodegradation of these carbon nanomaterials,26,27 acquiring further insight into the mechanism of biodegradation will potentially provide new understanding of the distribution/transformation, toxicity, and persistence of CNTs.
Results and discussion
Transmission electron microscopy (TEM)
o-SWCNTs that contained carboxylic acids between 1.0 and 3.0 atomic%41 and were initially around 1 μm in length (Fig. 2a) were incubated at 37 °C with MPO and H2O2 for four days in the presence and absence of Cl−, and the samples were inspected by transmission electron microscopy (TEM). In the presence of Cl−, the micrographs display only residual carbonaceous material thereby marking the absence of tubular structures and indicating biodegradation (Fig. 2b). TEM micrographs in the absence of Cl− denote the presence of shortened nanotubes and carbonaceous material (not shown). Next, the initial system was supplemented with either AA or GSH (1 mM per addition) during a four day time course at 37 °C. Significantly, in the presence of Cl−, the TEM micrographs indicate that both antioxidants preserve the nanotubes’ cylindrical structures, and most of the nanotubes exist on the grid as large aggregates (Fig. 2c and d). This observation is likewise noted for the system without Cl− and with antioxidants (not shown).
Fig 2.
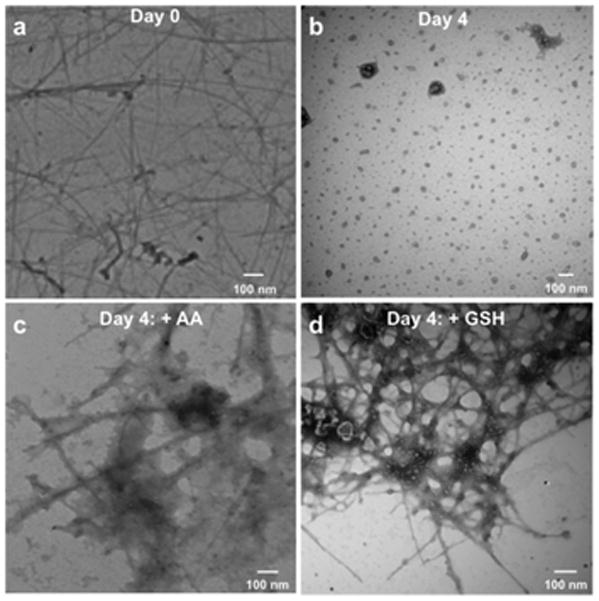
Micrographs obtained by transmission electron microscopy (TEM) of o-SWCNTs dispersed in a 0.1 M phosphate buffer (pH 7.4) with 125 nM myeloperoxidase (MPO) and 140 mM NaCl at (a) day 0 and (b) day 4; 8 additions of H2O2 (75 μM, final) were added daily. Micrographs of o-SWCNTs under identical conditions as (b) plus either (c) L-ascorbic acid (AA, 1 mM per addition) or (d) L-glutathione (GSH, 1 mM per addition).
Raman spectroscopy
The data obtained from Raman spectroscopy reinforces the TEM observations. For o-SWCNTs, distinct peaks are noted for the radial breathing mode (RBM, 147 cm−1 and 159 cm−1), D (1348 cm−1), G (1592 cm−1) and 2D (2643 cm−1) bands (Fig. 3a, blue curve),42 and o-SWCNTs possess a D/G ratio of 0.53. For the MPO–H2O2 system with Cl−, there is an absence of the characteristic Raman signature that is indicative of SWCNTs, however, thereby signifying that the o-SWCNTs are completely biodegraded (Fig. 3a, green curve). For enzymatic conditions without Cl−, the RBM and D, G, and 2D bands are observed demonstrating the presence of o-SWCNTs (Fig. 3b and ESI†); the RBM and 2D bands, however, are stifled relative to the spectrum for o-SWCNTs. Moreover, the D/G ratio increased from 0.53 to 0.65 as a result of o-SWCNT biodegradation by reactive intermediates. This increase in the D band is indicative of increased disorder in the sp2-hybridized carbon system.42 Finally, with the retention of the RBM and D, G, and 2D bands, the Raman signatures for o-SWCNTs treated with either anti-oxidant and with or without Cl− mirror that of o-SWCNTs (Fig. 3a and ESI†) and provide further indication that the nanotube structure is conserved in the presence of antioxidants.
Fig 3.
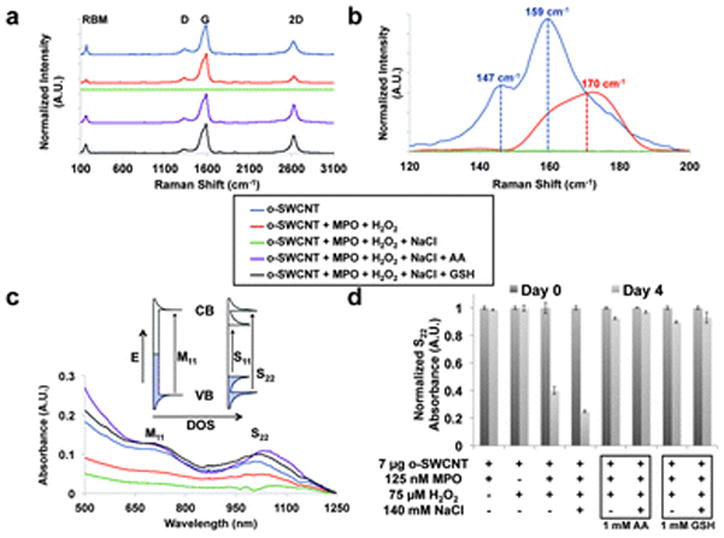
(a) Raman spectroscopy performed on key o-SWCNTs samples (o-SWCNT: blue, o-SWCNT + MPO + H2O2: red, o-SWCNT + MPO + H2O2 + NaCl: green, o-SWCNT + MPO + H2O2 + NaCl + AA: violet, and o-SWCNT + MPO + H2O2 + NaCl + GSH: black) for 4 days under experimental conditions. The radial breathing mode (RBM), D, G, and 2D bands are identified. (b) The radial breathing mode (RBM) region of the Raman spectra. (c) Vis-NIR absorption spectra for o-SWCNTs samples identified in (a). The inset depicts the density of states (DOS) diagrams for metallic (left) and semiconducting (right) SWCNTs in which the optical transitions arising from van Hove singularities. The S22 and M11 transitions are identified on the spectra. (d) The S22 absorption intensity of o-SWCNTs at day 0 and day 4 for the given experimental conditions. This data was obtained from a microplate reader, and the error bar represents standard error of the mean with a sample size of three.
Examining the RBM provided additional insight into the mechanism of o-SWCNT biodegradation. Given that a laser with a 633 nm wavelength was employed, the resonant Raman scattering signals was primarily obtained from metallic nano-tubes because the energy of the M11 optical transition is close to the energy of the photon generated by the laser.43 Initially at day 0, two main peaks at 159 cm−1 and 147 cm−1 were observed (Fig. 3b). These peaks can be assigned to metallic o-SWCNTs with calculated diameters around 1.41 and 1.52 nm, respectively, when using the equation, ωr = 223.75 (cm−1 nm)/d (nm). Under Cl− conditions, all of the nanotubes, regardless of chirality, appeared to degrade, and no RBM features remained after one day (Fig. 3b). In the absence of Cl−, the biodegradation resulting from reactive intermediates proceeded at a slower rate as evidenced by examination of the RBM (Fig. 3b). The remaining peak was centred at 170 cm−1, which may be attributed to an upshift in the RBM for the 1.41 nm diameter o-SWCNTs by ~11 cm−1. This upshift, which results from a decrease in the energy spacing between van Hove singularities,43 could be explained by either enzymatic selectivity for larger diameter nanotubes or further oxidation of the o-SWCNTs by the reactive intermediates of MPO. Such an upshift has been documented in the literature for the RBM of o-SWCNTs versus as prepared SWCNTs;43–46 however, there exist conflicting explanations regarding the cause of this observation.
Vis-NIR absorption spectroscopy
The vis-NIR absorption spectrum of o-SWCNTs demonstrates distinct characteristic S22 and M11 transitions (Fig. 3c, blue curve, and inset); after four days under enzymatic/peroxide conditions and in the presence of Cl−, however, the S22 and M11 transitions are severely subdued (Fig. 3c, red curve), which is indicative of biodegradation. Given the equal concentrations of o-SWCNTs, degradation was quantified by integrating the S22 peak relative to the baseline (ESI†). The S22 peak area for o-SWCNTs in the presence of Cl− was reduced 4.1 times compared to o-SWCNTs. In the absence of Cl−, retention of the S22 and M11 transitions is apparent albeit subdued (ESI†), which is demonstrated by the reduction of S22 peak area of only 2.7 times. This result is consistent with the TEM and Raman data, which indicate that the o-SWCNTs are degrading at a slower rate via reactive intermediates. The absorption spectra for o-SWCNTs incubated with MPO/H2O2, either antioxidant, and in the presence and absence of Cl− demonstrate the retention of the S22 and M11 bands thereby signifying the presence of o-SWCNTs (Fig. 3c and ESI†). In the presence of Cl−, the ratios of the S22 peak areas are 0.77 and 1.0 for o-SWCNTs relative to AA and GSH treated o-SWCNTs, respectively, and 0.84 and 1.1, respectively, in the absence of Cl−.
Finally, a microplate reader was employed to obtain high throughput absorption readings at/near the S22 absorption transition for multiple samples and controls, and the resulting data further corroborated the results obtained by TEM and both Raman and vis-NIR spectroscopies. It is worth noting that in the range of 800 nm and 1300 nm, the scattering effect of CNTs is minimal (i.e. <8%);47 therefore, >92% of the signal obtained for the S22 band is derived from CNT absorption. Fig. 3d portrays a 75% and 60% decrease in the S22 absorption intensity at day 4 relative to day 0 in the presence and absence of Cl−, respectively. On the other hand, the controls for o-SWCNTs declined by an insignificant amount over the same time period (Fig. 3d and ESI†). Fig. 3d also demonstrates a minimal decline in S22 absorption intensity at day 4 relative to day 0 for AA or GSH with and without chloride. Therefore, both antioxidants significantly suppressed both hypochlorite-induced biodegradation and degradation resulting from reactive intermediates generated by the peroxidase cycle (Fig. 1). We also compared the effects of changing antioxidant concentrations on o-SWCNT degradation as measured by the relative change in S22 absorption in both the presence and absence of Cl− (ESI†). Lower concentrations of antioxidants (~200 μM for AA and ~50 μM for GSH) per additions demonstrated the same level of protection against HOCl afforded by 1 mM additions of either AA or GSH.
Additional characterization techniques
Electron paramagnetic resonance (EPR) spectroscopy and positive mode electrospray ionization-mass spectrometry (ESI-MS) were employed to qualitatively confirm the oxidation of AA and GSH, respectively, under chloride conditions. EPR spectroscopy confirmed the formation of the ascorbate radical after 1 h incubation under experimental conditions (ESI†). Moreover, in the presence of Cl−, glutathione sulphonic acid (GSO2OH) and glutathione disulphide (GSSG) were observed at a m/z of 356 and 613, respectively, utilizing ESI-MS (ESI†).
Potential mechanism – why is HOCl more efficient at biodegradation than reactive intermediates?
As previously demonstrated, both samples, which consisted of o-SWCNTs that were incubated at 37 °C with MPO and H2O2 for four days in the presence and absence of Cl−, degraded;7 the degree of degradation, however, was dependent on the strength of the oxidant. HOCl is produced in the presence of chloride (Fig. 1) and possesses a redox potential of 1.48 V, which is greater than the mean redox potential for the reactive intermediates of MPO (E0 = 1.16 V) that form during the peroxidase cycle (i.e. in the absence of chloride, Fig. 1).25 Consequently, as demonstrated in Fig. 4a, both species are able to oxidize SWCNTs (E0 = 0.5 V).25 Compared to HOCl induced degradation, however, o-SWCNTs biodegradation catalysed via reactive intermediates was less efficient as demonstrated by the TEM, Raman spectroscopic, and vis-NIR spectroscopic data. Molecular simulations studies provide a second possible justification for the lower biodegradation efficacy of reactive intermediates.26 When dispersed in an aqueous media at physiological/experimental pH (i.e. pH = 7.4), the carboxyl groups of the o-SWCNTs, which have a pKa of approximately 5.5,48 will be deprotonated as demonstrated by a zeta potential of approximately −50 mV.49 Additionally, with an isoelectric point greater than 10,50 MPO will be protonated and highly cationic at pH 7.4. Therefore, to degrade o-SWCNTs employing reactive intermediates, the negatively charged carboxyl groups of o-SWCNTs must interact with the positively charged arginine residues of MPO via electrostatic interactions in such a fashion that the nanotube is properly oriented towards and in close enough proximity to the proximal end of the heme group, which involves the catalytically active tyrosine residues, Tyr 293 and 313.26 It is hypothesized that these radical supporting aromatic residues catalysed the cleavage of o-SWCNTs.26 On the other hand, in the presence of Cl−, HOCl will diffuse through the solution and oxidize species of lower redox potential such as SWCNTs (Fig. 4a).
Fig 4.
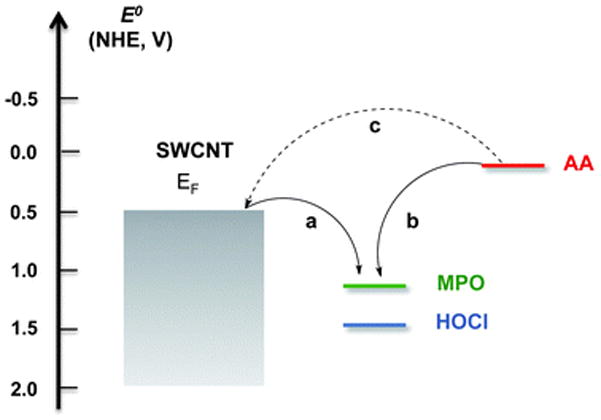
With greater redox potentials, HOCl (E0 = 1.48 V) and the reactive intermediates of MPO (E0 = 1.16 V) will oxidize (a) SWCNTs (E0 = 0.5 V) and (b) ascorbic acid (AA, E0 = 0.066 V). (c) In the absence of these oxidative species, SWCNTs can react with AA as observed by the Raman data.
Potential mechanism – do AA and GSH reduce o-SWCNTs?
During the formation of o-SWCNTs via harsh chemical oxidants, hydroxyl, carbonyl, and carboxyl groups are generally imparted on the edges and sidewalls of nanotubes.51 Moreover, it has been demonstrated that AA52 and GSH53 can significantly reduce most oxygen functional groups of graphene oxide resulting in a more pristine structure. Interestingly, we observed that the D/G ratio decreased for o-SWCNTs treated with anti-oxidants (from 0.53 for o-SWCNTs to 0.30 and 0.31 for o-SWCNTs incubated with either AA or GSH, respectively); a similar decline in the D/G ratio was observed for CNTs that were thermally annealed under vacuum, which results in the removal of functional groups.54 For a system consisting of reactive intermediates, HOCl, and o-SWCNTs, we would expect the antioxidants to reduce the former two species before the SWCNTs as a consequence of their higher redox potential (Fig. 4b). For each addition, the antioxidant was present in higher concentration than H2O2; therefore, the excess antioxidant would be able to react with the o-SWCNTs (Fig. 4c). Because SWCNTs with more pristine structures undergo less efficient MPO-catalysed biodegradation,26 there exists the possibility that the antioxidants were making the CNTs more pristine thereby mitigating biodegradation. To test this hypothesis, o-SWCNTs that were treated with AA or GSH for four days at 37 °C were subsequently incubated at 37 °C with MPO and H2O2 for four days in the presence and absence of Cl−. Employing the microplate reader, it was determined that the S22 absorption transition intensity decreased by 70% and 65% for AA and 64% and 49% for GSH at day 4 relative to day 0 in the presence and absence of Cl−, respectively (ESI†). Therefore, while it appears that some functional groups on o-SWCNTs are reduced by antioxidants (i.e. decline in the D/G ratio), neither AA nor GSH reduced the carboxyl groups, which are necessary for enzyme-catalysed degradation of nanotubes.25 Thus, other mechanisms may be responsible for the mitigation of o-SWCNT biodegradation.
Potential mechanism – effects of antioxidants on the peroxidase cycle and HOCl
Kagan et al. demonstrated that in the absence of transition metal catalysts, H2O2 fails to oxidize AA.55 Moreover, our electron paramagnetic resonance (EPR) spectroscopy data for a system consisting of o-SWCNTs, MPO, H2O2, and AA demonstrated the formation of the ascorbate radical, which implies that AA is being oxidized by reactive intermediates (ESI†). This notion is also substantiated by the redox potential of the AA (E0 = 0.066 V);56 therefore, AA has the potential to reduce Compounds I and II of MPO given that the mean redox potentials of peroxidase cycle is 1.16 V (Fig. 4b).25 Consequently, AA can mitigate the biodegradation of o-SWCNTs by out-competing the nano-material as a substrate for MPO. GSH, on the other hand, is a relatively poor substrate for Compounds I and II of MPO;57 in addition, its one-electron oxidation product, the glutathione thiyl radical, is a strong oxidant (E0 = 0.920 V).58 However, GSH was also effective in preventing o-SWCNT oxidation by MPO both in the presence and absence of Cl− thereby suggesting that glutathione thiyl radical likely reacted with excess GSH in solution to form GSSG and had not significantly contributed to the degradation of o-SWCNTs. Also, H2O2, can directly oxidize GSH;59 hence decreases the quantity of H2O2 available to interact with MPO and generate reactive intermediates.
The protection afforded by the antioxidants during the production of HOCl is two-fold. First, as described above, the antioxidants can reduce Compound I (AA) or H2O2 (GSH)thereby reducing Compound I that is available to react with Cl−. Second, HOCl oxidizes both AA and GSH at very rapid rates, which in turn affords protection for the o-SWCNTs (Fig. 4b). The mechanism of AA oxidation by HOCl may entail either an electrophilic chlorination or a two-electron-transfer reaction whereby DHA is produced.60 Meanwhile, GSH oxidation by HOCl results in the formation of a sulphenyl chloride (GSCl), which reacts with either GSH to produce glutathione disulphide (GSSG) or with two equivalents of HOCl thereby yielding glutathione sulphonyl chloride (GSO2Cl).61 GSO2Cl is likely hydrolysed to glutathione sulphonic acid (GSO2OH).61 Our ESI-MS data confirmed that both GSO2OH and GSSG were formed.
Conclusions
The cumulative results from TEM and Raman and UV-vis absorption spectroscopies demonstrated that both hypochlorite and reactive intermediates oxidized o-SWCNTs thereby resulting in the degradation of this nanomaterial. Additionally, the data also established that the water-soluble antioxidants, L-ascorbic acid and L-glutathione, could suppress MPO-driven biodegradation of CNTs. Significantly, antioxidant supplementation may attenuate oxidative stress-associated tissue damage incurred by CNT exposure; for example, vitamin E deficiency enhances the pulmonary inflammatory response and oxidative stress induced by SWCNTs in C57BL/6 mice.62 The initial phase of the inflammatory response includes massive recruitment and activation of neutrophils (PMNs), whose MPO is involved in biodegradation of CNTs. Therefore, the choice of protective antioxidants for regulating CNT-induced oxidative stress should be selective and include testing for neutrality towards CNT biodegradation.
Experimental
Materials
Oxidized arc discharge single-walled carbon nanotubes (o-SWCNTs) were acquired from Carbon Solutions, Inc. (P3, Riverside, CA, USA). Lyophilized purified native human myeloperoxidase (MPO) was purchased from Athens Research and Technology, Inc. (Athens, GA, USA). L-Ascorbic acid (AA), L-glutathione (reduced, GSH), L-glutathione (oxidized, GSSG), hydrogen peroxide (30%, H2O2), 0.1 M phosphate buffer, sodium chloride (NaCl), and diethylenetriaminepentaacetic acid (DTPA) were obtained from Sigma Aldrich (St. Louis, MO, USA). Amplex Red was procured from Molecular Probes (Life Technologies, Grand Island, NY, USA). TefSep PTFE membrane filters (GE Infrastructure Water & Process Technologies) that were 25 mm diameter and contained a pore size of 0.22 μM were acquired from Spectrum Chemicals and Laboratory Products (New Brunswick, NJ). Finally, sodium hydroxide (NaOH), hydrochloric acid (HCl), polystyrene 96 well plates and Amicon Ultra 4 filters (10k MWCO, Millipore) were obtained from Fisher Scientific (Pittsburgh, PA, USA).
Methods
DTPA was added to the 0.1 M phosphate buffer at a final concentration of 300 μM. Next, a dispersion containing 1.0 mg mL−1 of P3 o-SWCNTs was prepared by sonicating 1.0 mL of 0.1 M/300 μM phosphate/DTPA buffer with 1.0 mg of P3 o-SWCNTs for 1 h. Stock solutions were prepared for AA (250 mM), GSH (250 mM), H2O2 (18.75 mM), and NaCl (5 M) utilizing nanopure water as the solvent. Since the buffer in which the MPO was lyophilized contains NaCl, different MPO preparations were employed for −Cl− conditions. For +Cl− samples, the as received lyophilized MPO (i.e. AR MPO) was reconstituted with 350 μL of nanopure water for a final concentration of 2.0 μM. On the other hand, for −Cl− conditions, the lyophilized MPO was reconstituted with 350 μL of nanopure water, and the buffer was exchanged to 0.1 M phosphate buffer utilizing an Amicon Ultra 4 to a final volume of 350 μL (forming BE MPO). The activity of BE MPO was compared to AR MPO utilizing Amplex Red (refer to MPO activity study, Table S2, ESI†), and the quantity of BE MPO utilized in the experiment was proportionally adjusted to obtain equivalent rates. Table S1 (ESI†) replicates the initial experimental conditions, which were performed in triplicate using 96 well plates. Employing an Epoch microplate spectrophotometer (BioTek, Winooski, VT), an initial (day 0) absorbance was measured at 999 nm. Every hour, 18.75 mM H2O2 and 250 mM of both AA and GSH were apportioned at concentrations of 75 μM, 1 mM, and 1 mM, respectively, for a total of 7 additions on day 0 and 8 additions on days 1, 2 and 3. In addition, 4 μL of AR MPO and 4.8 μL of BE MPO were added to the samples (according to Table S1, MPO columns, ESI†) on days 1, 2 and 3. Between additions, the samples were incubated at 37 °C in an incubator (Thermo Scientific).
On day 4 (96 h), the Epoch microplate spectrophotometer was again utilized to measure the absorbance at 999 nm, and the samples from day 4 were characterized utilizing transmission electron microscopy (TEM), Raman spectroscopy, and visible-near infrared (vis-NIR) absorbance spectroscopy.
Transmission electron microscopy
Samples were diluted 1 : 100 with nanopure water. 5 μL of the suspended sample was placed on a lacey carbon grid (Pacific-Grid Tech) and permitted to dry in ambient conditions for overnight prior to TEM imaging (FEI Morgagni, 80 keV).
Raman spectroscopy
Samples were prepared by drop-casting approximately 100 μL of sample on a quartz microscope slide and drying. All spectra were collected on a Renishaw inVia Raman microscope using an excitation wavelength of 633 nm. Samples were scanned from 100 to 3100 cm−1 to visualize the RBM, D, G, and 2D bands. Spectra were collected with a 15 second exposure time and averaged across 5 scans per location; a total of 5 locations were selected per sample.
Vis-NIR absorbance spectroscopy
Samples (150 μL) were analysed using a Lambda 900 spectrophotometer (Perkin Elmer) and 200 μL quartz cuvettes (path length: 1 cm, World Precision Instruments, Inc.). The samples were scanned from 500 to 1250 nm. All samples were utilized without any further treatment or purification. Peak integration was conducted relative to the baseline employing origin.
Electron paramagnetic resonance spectroscopy
Ascorbate radicals were detected using a JEOL-RE1X EPR spectrometer (Tokyo, Japan) in 50 mM phosphate buffer, containing 100 μM DTPA at 25 °C. Samples (100 μL) contained 3 μL SWCNT (stock concentration 5 mg mL−1), 1.5 μL MPO (stock concentration 2 μM), 100 μM H2O2, 140 mM NaCl, and 1.0 mM AA. Measurements were performed in gas-permeable Teflon tubing (0.8 mm internal diameter, 0.013 mm thickness) from Alpha Wire Corp. (Elizabeth, NJ). The tubing containing the sample was folded twice and placed into a 3.0 mm EPR quartz tube. The EPR conditions for detecting ascorbate radicals were: 335.0 G centre field, 50 G sweep width, 0.79 G field modulation, 20 mW microwave power, 0.1 s time constant, 1000 receiver gain, 2 min time scan. Spectra were collected using EPRwase software (Scientific Software Services, Bloomington, IL).
Electrospray ionization-mass spectrometry (ESI-MS)
Three samples, which consisted of reduced GSH (1 mg mL−1), oxidized GSH (GSSG, 1 mg mL−1), and o-SWCNT + MPO + H2O2 + Cl− + GSH (100 μM, final) were analysed by positive mode electrospray ionization-mass spectrometry (ESI-MS). Each sample was filtered through a 0.22 μm syringe filter (Whatman, Sanford, ME, USA), and 1 μL of sample was directly injected into a LCMS-2020 unit (Shimadzu Scientific, Columbia, MD, USA). Data was acquired for 10 minutes.
Monitoring MPO activity with Amplex Red
Amplex Red was employed to test MPO activity for both the as received and buffer exchanged MPO samples. A 10 mM stock solution of Amplex Red was prepared by dissolving the reagent in DMSO. Table S4 (ESI†) provides the experimental details for the assay. After gentle mixing, a fluorescence-based kinetic experiment was implemented on the four samples whereby a Fluoromax 3 (Horiba Scientific, Edison, NJ, USA) was employed to acquire measurements every 5 s for a total of 120 s with the excitation wavelength at 575 nm and emission wavelength equal to 585 nm. The relative activities are compared in Fig. S6 (ESI†).
Supplementary Material
Acknowledgments
This work was supported by NIEHS R01ES019304, NIOSH OH008282, NIH HL70755, HL094488, and U19AI068021. GPK acknowledges support from the EPA STAR Graduate Fellowship FP-91713801.
Footnotes
Electronic supplementary information (ESI) available: Full experimental details, including: Raman spectra, vis-NIR absorption data, absorption vs. antioxidant concentration plots, EPR studies, and ESI-MS spectra, degradation experiments with antioxidant-treated o-SWCNTs, and MPO activity assay. See DOI: 10.1039/c2tb00047d
References
- 1.Odom TW, Huang JL, Kim P, Lieber CM. J Phys Chem B. 2000;104:2794–2809. [Google Scholar]
- 2.Dresselhaus MS, Dresselhaus G, Jorio A. Annu Rev Mater Res. 2004;34:247–278. [Google Scholar]
- 3.Ruoff RS, Lorents DC. Carbon. 1995;33:925–930. [Google Scholar]
- 4.Avouris P, Appenzeller J, Martel R, Wind SJ. Proc IEEE. 2003;91:1772–1784. [Google Scholar]
- 5.Kauffman DR, Star A. Angew Chem, Int Ed. 2008;47:6550–6570. doi: 10.1002/anie.200704488. [DOI] [PubMed] [Google Scholar]
- 6.Feigel IM, Vedala H, Star A. J Mater Chem. 2011;21:8940–8954. [Google Scholar]
- 7.Coleman JN, Khan U, Blau WJ, Gun’ko YK. Carbon. 2006;44:1624–1652. [Google Scholar]
- 8.Baughman RH, Zakhidov AA, de Heer WA. Science. 2002;297:787–792. doi: 10.1126/science.1060928. [DOI] [PubMed] [Google Scholar]
- 9.Kagan VE, Tyurina YY, Tyurin VA, Konduru NV, Potapovich AI, Osipov AN, Kisin ER, Schwegler-Berry D, Mercer R, Castranova V, Shvedova AA. Toxicol Lett. 2006;165:88–100. doi: 10.1016/j.toxlet.2006.02.001. [DOI] [PubMed] [Google Scholar]
- 10.Tkach AV, Shurin GV, Shurin MR, Kisin ER, Murray AR, Young SH, Star A, Fadeel B, Kagan VE, Shvedova AA. ACS Nano. 2011;5:5755–5762. doi: 10.1021/nn2014479. [DOI] [PMC free article] [PubMed] [Google Scholar]
- 11.Shvedova AA, Kisin ER, Mercer R, Murray AR, Johnson VJ, Potapovich AI, Tyurina YY, Gorelik O, Arepalli S, Schwegler-Berry D, Hubbs AF, Antonini J, Evans DE, Ku BK, Ramsey D, Maynard A, Kagan VE, Castranova V, Baron P. Am J Physiol. 2005;289:L698–L708. doi: 10.1152/ajplung.00084.2005. [DOI] [PubMed] [Google Scholar]
- 12.Kisin ER, Murray AR, Keane MJ, Shi XC, Schwegler-Berry D, Gorelik O, Arepalli S, Castranova V, Wallace WE, Kagan VE, Shvedova AA. J Toxicol Environ Health, Part A. 2007;70:2071–2079. doi: 10.1080/15287390701601251. [DOI] [PubMed] [Google Scholar]
- 13.Shvedova AA, Fabisiak JP, Kisin ER, Murray AR, Roberts JR, Tyurina YY, Antonini JM, Feng WH, Kommineni C, Reynolds J, Barchowsky A, Castranova V, Kagan VE. Am J Respir Cell Mol Biol. 2008;38:579–590. doi: 10.1165/rcmb.2007-0255OC. [DOI] [PMC free article] [PubMed] [Google Scholar]
- 14.Shvedova AA, Pietroiusti A, Fadeel B, Kagan VE. Toxicol Appl Pharmacol. 2012;261:121–133. doi: 10.1016/j.taap.2012.03.023. [DOI] [PMC free article] [PubMed] [Google Scholar]
- 15.Pérez S, Farré Ml, Barceló D. TrAC, Trends Anal Chem. 2009;28:820–832. [Google Scholar]
- 16.Petersen EJ, Zhang L, Mattison NT, O’Carroll DM, Whelton AJ, Uddin N, Nguyen T, Huang Q, Henry TB, Holbrook RD, Chen KL. Environ Sci Technol. 2011;45:9837–9856. doi: 10.1021/es201579y. [DOI] [PubMed] [Google Scholar]
- 17.Lowry GV, Gregory KB, Apte SC, Lead JR. Environ Sci Technol. 2012;46:6893–6899. doi: 10.1021/es300839e. [DOI] [PubMed] [Google Scholar]
- 18.Krug HF, Wick P. Angew Chem, Int Ed. 2011;50:1260–1278. doi: 10.1002/anie.201001037. [DOI] [PubMed] [Google Scholar]
- 19.Bianco A, Kostarelos K, Prato M. Chem Commun. 2011;47:10182–10188. doi: 10.1039/c1cc13011k. [DOI] [PubMed] [Google Scholar]
- 20.Allen BL, Kichambare PD, Gou P, Vlasova A, II, Kapralov A, Konduru N, Kagan VE, Star A. Nano Lett. 2008;8:3899–3903. doi: 10.1021/nl802315h. [DOI] [PubMed] [Google Scholar]
- 21.Allen BL, Kotchey GP, Chen Y, Yanamala NVK, Klein-Seetharaman J, Kagan VE, Star A. J Am Chem Soc. 2009;131:17194–17205. doi: 10.1021/ja9083623. [DOI] [PubMed] [Google Scholar]
- 22.Russier J, Menard-Moyon C, Venturelli E, Gravel E, Marcolongo G, Meneghetti M, Doris E, Bianco A. Nanoscale. 2011;3:893–896. doi: 10.1039/c0nr00779j. [DOI] [PubMed] [Google Scholar]
- 23.Zhao Y, Allen BL, Star A. J Phys Chem A. 2011;115:9536–9544. doi: 10.1021/jp112324d. [DOI] [PMC free article] [PubMed] [Google Scholar]
- 24.Kotchey GP, Allen BL, Vedala H, Yanamala N, Kapralov AA, Tyurina YY, Klein-Seetharaman J, Kagan VE, Star A. ACS Nano. 2011;5:2098–2108. doi: 10.1021/nn103265h. [DOI] [PMC free article] [PubMed] [Google Scholar]
- 25.Kotchey GP, Hasan SA, Kapralov AA, Ha SH, Kim K, Shvedova AA, Kagan VE, Star A. Acc Chem Res. 2012;45:1770–1781. doi: 10.1021/ar300106h. [DOI] [PMC free article] [PubMed] [Google Scholar]
- 26.Kagan VE, Konduru NV, Feng W, Allen BL, Conroy J, Volkov Y, Vlasova II, Belikova NA, Yanamala N, Kapralov A, Tyurina YY, Shi J, Kisin ER, Murray AR, Franks J, Stolz D, Gou P, Klein-Seetharaman J, Fadeel B, Star A, Shvedova AA. Nat Nanotechnol. 2010;5:354–359. doi: 10.1038/nnano.2010.44. [DOI] [PMC free article] [PubMed] [Google Scholar]
- 27.Vlasova I, Sokolov A, Chekanov A, Kostevich V, Vasilyev V. Russ J Bioorg Chem. 2011;37:453–463. [Google Scholar]
- 28.Shvedova AA, Kapralov AA, Feng WH, Kisin ER, Murray AR, Mercer RR, StCroix CM, Lang MA, Watkins SC, Konduru NV, Allen BL, Conroy J, Kotchey GP, Mohamed BM, Meade AD, Volkov Y, Star A, Fadeel B, Kagan VE. PLoS One. 2012;7:e30923. doi: 10.1371/journal.pone.0030923. [DOI] [PMC free article] [PubMed] [Google Scholar]
- 29.Vlasova II, Vakhrusheva TV, Sokolov AV, Kostevich VA, Gusev AA, Gusev SA, Melnikova VI, Lobach AS. Toxicol Appl Pharmacol. 2012;264:131–142. doi: 10.1016/j.taap.2012.07.027. [DOI] [PubMed] [Google Scholar]
- 30.Nunes A, Bussy C, Gherardini L, Meneghetti M, Herrero MA, Bianco A, Prato M, Pizzorusso T, Al-Jamal KT, Kostarelos K. Nanomedicine. 2012 doi: 10.2217/nnm.12.33. [DOI] [PubMed] [Google Scholar]
- 31.Di Mascio P, Murphy M, Sies H. Am J Clin Nutr. 1991;53:194S–200S. [PubMed] [Google Scholar]
- 32.Padayatty SJ, Katz A, Wang Y, Eck P, Kwon O, Lee JH, Chen S, Corpe C, Dutta A, Dutta SK, Levine M. J Am Coll Nutr. 2003;22:18–35. doi: 10.1080/07315724.2003.10719272. [DOI] [PubMed] [Google Scholar]
- 33.Traber MG, Stevens JF. Free Radical Biol Med. 2011;51:1000–1013. doi: 10.1016/j.freeradbiomed.2011.05.017. [DOI] [PMC free article] [PubMed] [Google Scholar]
- 34.Perricone C, De Carolis C, Perricone R. Autoimmun Rev. 2009;8:697–701. doi: 10.1016/j.autrev.2009.02.020. [DOI] [PubMed] [Google Scholar]
- 35.Pattison DI, Davies MJ. Curr Med Chem. 2006;13:3271–3290. doi: 10.2174/092986706778773095. [DOI] [PubMed] [Google Scholar]
- 36.Nauseef WM. Immunol Rev. 2007;219:88–102. doi: 10.1111/j.1600-065X.2007.00550.x. [DOI] [PubMed] [Google Scholar]
- 37.Arnhold J. Biochemistry. 2004;69:4–9. doi: 10.1023/b:biry.0000016344.59411.ee. [DOI] [PubMed] [Google Scholar]
- 38.Winterbourn CC, Hampton MB, Livesey JH, Kettle AJ. J Biol Chem. 2006;281:39860–39869. doi: 10.1074/jbc.M605898200. [DOI] [PubMed] [Google Scholar]
- 39.Lide DR, editor. Potentials. CRC Press; Boca Raton: 2004. [Google Scholar]
- 40.Yang JC, Yen CH, Wang WJ, Horng JJ, Tsai YP. J Chem Technol Biotechnol. 2010;85:699–707. [Google Scholar]
- 41.Value reported for P3 SWCNTs by Carbon Solutions, Inc.
- 42.Dresselhaus MS, Jorio A, Hofmann M, Dresselhaus G, Saito R. Nano Lett. 2010;10:751–758. doi: 10.1021/nl904286r. [DOI] [PubMed] [Google Scholar]
- 43.Chen J, Rao AM, Lyuksyutov S, Itkis ME, Hamon MA, Hu H, Cohn RW, Eklund PC, Colbert DT, Smalley RE, Haddon RC. J Phys Chem B. 2001;105:2525–2528. [Google Scholar]
- 44.Kuzmany H, Kukovecz A, Simon F, Holzweber M, Kramberger C, Pichler T. Synth Met. 2004;141:113–122. [Google Scholar]
- 45.Kukovecz A, Kramberger C, Holzinger M, Kuzmany H, Schalko J, Mannsberger M, Hirsch A. J Phys Chem B. 2002;106:6374–6380. [Google Scholar]
- 46.Martínez MT, Callejas MA, Benito AM, Cochet M, Seeger T, Ansón A, Schreiber J, Gordon C, Marhic C, Chauvet O, Fierro JLG, Maser WK. Carbon. 2003;41:2247–2256. [Google Scholar]
- 47.Sarkar S, Gurjarpadhye AA, Rylander CG, Rylander MN. J Biomed Opt. 2011;16:051304–051311. doi: 10.1117/1.3574762. [DOI] [PMC free article] [PubMed] [Google Scholar]
- 48.Gao W, Song J. Electrochem Commun. 2009;11:1285–1288. [Google Scholar]
- 49.Zhao B, Hu H, Yu A, Perea D, Haddon RC. J Am Chem Soc. 2005;127:8197–8203. doi: 10.1021/ja042924i. [DOI] [PubMed] [Google Scholar]
- 50.Klebanoff SJ. J Leukocyte Biol. 2005;77:598–625. doi: 10.1189/jlb.1204697. [DOI] [PubMed] [Google Scholar]
- 51.Zhang J, Zou H, Qing Q, Yang Y, Li Q, Liu Z, Guo X, Du Z. J Phys Chem B. 2003;107:3712–3718. [Google Scholar]
- 52.Zhang J, Yang H, Shen G, Cheng P, Zhang J, Guo S. Chem Commun. 2010;46:1112–1114. doi: 10.1039/b917705a. [DOI] [PubMed] [Google Scholar]
- 53.Pham TA, Kim JS, Kim JS, Jeong YT. Colloids Surf, A. 2011;384:543–548. [Google Scholar]
- 54.Dyke CA, Tour JM. J Am Chem Soc. 2003;125:1156–1157. doi: 10.1021/ja0289806. [DOI] [PubMed] [Google Scholar]
- 55.Kagan VE, Kuzmenko AI, Shvedova AA, Kisin ER, Li R, Martin I, Quinn PJ, Tyurin VA, Tyurina YY, Yalowich JC. Biochim Biophys Acta. 2003;1620:72–84. doi: 10.1016/s0304-4165(02)00509-3. [DOI] [PubMed] [Google Scholar]
- 56.Borsook H, Keighley G. Proc Natl Acad Sci U S A. 1933;19:875–878. doi: 10.1073/pnas.19.9.875. [DOI] [PMC free article] [PubMed] [Google Scholar]
- 57.Borisenko GG, Martin I, Zhao Q, Amoscato AA, Kagan VE. J Am Chem Soc. 2004;126:9221–9232. doi: 10.1021/ja0495157. [DOI] [PubMed] [Google Scholar]
- 58.Buettner GR. Arch Biochem Biophys. 1993;300:535–543. doi: 10.1006/abbi.1993.1074. [DOI] [PubMed] [Google Scholar]
- 59.Finley JW, Wheeler EL, Witt SC. J Agric Food Chem. 1981;29:404–407. doi: 10.1021/jf00104a045. [DOI] [PubMed] [Google Scholar]
- 60.Folkes LK, Candeias LP, Wardman P. Arch Biochem Biophys. 1995;323:120–126. doi: 10.1006/abbi.1995.0017. [DOI] [PubMed] [Google Scholar]
- 61.Winterbourn CC, Brennan SO. Biochem J. 1997;326:87–92. doi: 10.1042/bj3260087. [DOI] [PMC free article] [PubMed] [Google Scholar]
- 62.Shvedova AA, Kisin ER, Murray AR, Gorelik O, Arepalli S, Castranova V, Young SH, Gao F, Tyurina YY, Oury TD, Kagan VE. Toxicol Appl Pharmacol. 2007;221:339–348. doi: 10.1016/j.taap.2007.03.018. [DOI] [PMC free article] [PubMed] [Google Scholar]
Associated Data
This section collects any data citations, data availability statements, or supplementary materials included in this article.