

Abstract
A bacteria-targeted MR contrast agent, Zn-1, consisting of two Zn-dipicolylamine (Zn-dpa) groups conjugated to a GdIII chelate has been synthesized and characterized. In vitro studies with S. aureus and E. coli show that Zn-1 exhibits a significant improvement in bacteria labeling efficiency vs. control. Studies with a structural analogue, Zn-2, indicate that removal of one Zn-dpa moiety dramatically reduces the agent's affinity for bacteria. The ability of Zn-1 to significantly reduce the T1 of labeled vs. unlabeled bacteria, resulting in enhanced MR image contrast, demonstrates its potential for visualizing bacterial infections in vivo.
Keywords: Medicinal chemistry, Imaging agents, Magnetic resonance imaging, Bacteria labeling, Zinc
Introduction
With the advancement of medical treatments and technologies, bacterial infection has become a growing concern in the course of patient care.[1] In the United States, approximately 2 million hospital patients develop a hospital-acquired infection each year.[1] Due to illness, organ transplantation, or specific disease treatments, many patients possess a depressed immune system that renders the individual more susceptible to infection.[2] Further, prosthetic materials such as stents, mesh grafts, and catheters can provide additional microenvironments for bacterial growth.[3] Antibiotic-resistant bacteria strains increase the severity of illness, length of hospital stay and mortality from infection.[4] Consequently, new agents and techniques to prevent, diagnose, and treat bacterial infection are of interest.
Typically an accurate diagnosis of bacterial infection is derived from cultures of samples obtained from the site of suspected infection. Other clinical methods to identify infection include monitoring of body temperature, white blood cell count, erythrocyte sedimentation rate and cytokine reactions – none of which are a specific response to infection.[5] Consequently, these tests cannot differentiate between bacterial infection and sterile inflammation, and are prone to false positive results due to contamination.[6]
As a result, there is a need to develop molecular imaging probes that can specifically identify bacterial infection, monitor therapeutic response, and ultimately guide clinical decisions. Additionally, bacteria-specific contrast agents could aid in the study of infection pathology. Bacteria-targeted imaging probes would allow for in vivo monitoring of both infection progression and antibiotic effectiveness in animal models. This could potentially lead to the development of new antibiotics capable of targeting bacterial strains that have developed resistance to current medications.
To date, several molecular imaging probes have been developed for the specific recognition of bacterial infection. Targeting moieties that have been studied include antibodies,[7] antibiotic drugs,[8] cationic peptides,[9] maltohexose units,[10] and cationic coordination complexes such as ZnII dipicolylamine (Zn-dpa).[11] The interaction between cationic Zn-dpa complexes and bacteria is primarily electrostatic. Zn-dpa groups have a high affinity for the anionic phosphate groups of phospholipids and phosphorylated amphiphiles on the bacterial cell surface.[11e,12] This affinity is affected by the number of Zn-dpa moieties present on the molecule, indicating that cooperative coordination of several targeting groups is involved in binding to the bacterial surface.[11e,12] In contrast to the near-neutral plasma membrane of healthy mammalian cells, which is primarily composed of zwitterionic phospholipids, the phospholipids that compose bacterial membranes are primarily anionic.[13] Thus, Zn-dpa complexes have a high affinity for the negatively-charged bacterial membrane, rendering them selective for bacteria over the neighboring healthy mammalian cells.[11c,11d]
Several optical agents incorporating Zn-dpa groups as bacteria targeting domains have shown promising results both in vitro and in mouse models.[11] However, the inherent limitations of optical imaging, including shallow depth of penetration and surface weighting of images, limit the clinical applicability of such agents.[14] Here we describe the extension of Zn-dpa optical probes for the detection of bacterial infection into the more clinically relevant field of magnetic resonance imaging (MRI). The use of targeted MR contrast agents increases the local concentration of GdIII at the site of interest, enhancing the sensitivity of the probe.[15]
To specifically identify bacterial infection by MRI, two Zn-dpa moieties were conjugated to a GdIII chelate to form the bacteria-targeted MR contrast agent Zn-1 which has an overall charge of 4+ (see Figures 1 and 2). Previous studies with bacteria-targeted optical agents have indicated that the number of Zn-dpa units affects the labeling efficiency of the compound.[11e] To explore whether this effect is observed for MR agents, two previously published ZnII-binding contrast agents, Zn-2 and Zn-3 (Figure 2), were synthesized and examined as control probes.[16] As expected, Zn-1 was found to bind to Staphylococcus aureus (S. aureus) to a much greater extent than either Zn-2 or Zn-3. The high affinity of Zn-1 for bacterial cells permits MR imaging of cells in vitro and suggests the use of Zn-1 for in vivo detection of bacterial infection.
Figure 1.
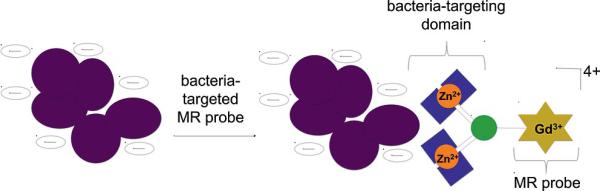
Two bacteria-targeted Zn-dpa domains were conjugated to a macrocyclic GdIII chelate to develop a bacteria-targeted MR probe. The probe's affinity for bacteria is due to the electrostatic attraction between the anionic bacteria membrane and the positive charge of the Zn-dpa moieties.
Figure 2.
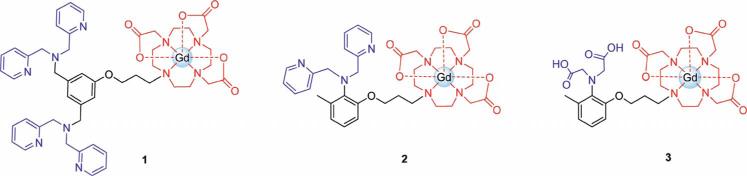
Structures of complexes used for bacteria labeling studies. The ZnII-binding domains of the complexes are shown in blue, the GdIII chelate is shown in red. After the addition of ZnII, Zn-1 and Zn-2 have charges of 4+ and 2+, respectively, while Zn-3 is charge neutral.[16] The positive charge of Zn-1 and Zn-2 is expected to enhance the complex's affinity for anionic bacterial cell membranes. Zn-3 was used as a control for low-affinity binding.
Results and Discussion
Synthesis of Bacteria-Targeted MRI Contrast Agents
A series of ZnII-binding MR contrast agents composed of a bacteria-targeted ZnII-binding domain conjugated to a GdIII chelate were synthesized (Figure 2). The number and overall charge of the ZnII-binding domains incorporated in the complexes was varied to examine the effect of the derivatives on bacterial cell labeling.
Complexes 2 and 3 were synthesized and characterized as described previously.[16] Both 2 and 3 contain two flexible pendant arms capable of coordinating one ZnII ion. Zn-3 was used as a control for low-affinity binding to bacteria. The binding domain of 3 is composed of two anionic acetate groups, making the ZnII-bound complex (Zn-3) charge neutral. This complex does not possess any electrostatic affinity for the anionic bacterial membrane. In contrast, the binding domain of 2 consists of two neutral picolyl arms, giving the ZnII-bound complex, Zn-2, an overall charge of 2+ (Figure 2). The positive charge of the Zn-2 complex is expected to moderately enhance its affinity for bacteria over Zn-3. Previous studies by Smith et al.[11e] have suggested that addition of a second Zn-dpa moiety significantly improves bacteria labeling, leading us to synthesize 1. This agent contains two dpa groups, each of which is capable of binding one ZnII ion to give the final ZnII-bound complex, Zn-1, an overall charge of 4+ (Figure 2).
The synthesis of 1 begins with methylation of the carboxylic acids of 5-hydroxyisophthalic acid to give the diester 4, in accordance with literature procedures (Scheme 1).[17] The phenol was protected with ethoxymethyl chloride and the esters reduced with lithium aluminum hydride to produce the diol 6. The alcohol groups were converted to chlorides using trichlorotriazine and DMF to form the dichloride 7.[18] Displacement of the chlorides with dipicolylamine gave the protected, bis-dpa compound 8. The phenol was deprotected with trifluoroacetic acid (TFA) in dichloromethane to give 9 in nearly quantitative yield. The bis-dpa phenol 9 was allowed to react with a bromoalkane derivative of tris-tert-butyl-protected DO3A to give the final, protected ligand 10. Deprotection of the tert-butyl groups with TFA and subsequent metallation with Gd(OAc)3, yielded the final compound 1, which was purified by semi-preparative HPLC.
Scheme 1.

Synthesis of the bacteria-targeted MR contrast agent 1 that contains two dipicolyl moieties, each of which is capable of binding one ZnII ion to give the final ZnII-bound complex an overall charge of 4+. The europium and terbium analogues were synthesized in a similar manner, using EuCl3 and Tb(OAc)3 in place of Gd(OAc)3.
Characterization of Zn-1
Relaxation times (T1 and T2) of Zn-1 suspended in 1.0% (w/v) agarose (all subsequent bacterial samples were suspended in agarose) were measured at 1.41 (37 °C) and 7 T (25 °C) in order to provide data at both clinical and research field strengths. The r1 increases from 4.7 mm–1s–1 to 5.6 mm–1s–1 and the r2 increases from 9.0 mm–1s–1 to 21.5 mm–1s–1 at 1.41 T and 7 T respectively.
The hydration number, q, of Zn-1 was determined by comparing the fluorescence lifetimes of the TbIII analogue, Zn-1-Tb, in D2O and H2O. The fluorescence lifetimes were measured and fit to an exponential curve. The decay times, 1.06 ms in H2O and 1.89 ms in D2O, were related to the hydration number using Equation (1), giving a q value of 1.5.[19] The q value is an average measure of how many water molecules are directly bound to the lanthanide at a given time. The non-integer value of 1.5 indicates that that in solution, the complex coordinates either one or two inner sphere water molecules.
| (1) |
1H NMR spectroscopy was used to confirm that 1 binds two ZnII ions per complex. The EuIII analogue of 1 (1-Eu) was synthesized and the 1H NMR chemical shifts of the dpa groups were monitored as ZnII was titrated into solution. The 1H peaks of the macrocycle and the propylene linker could not be assigned because the peaks are significantly broadened and shifted due to their proximity to the EuIII. However, there is enough separation between the lanthanide and the protons of the ZnII-binding dpa groups to make assignment possible, and a COSY spectrum was acquired to assign the aromatic dpa peaks (Figure 3).
Figure 3.

Aromatic region of 1-Eu COSY spectrum (60 °C, DMSO) used to assign peaks of the ZnII binding domains of 1. The addition of ZnII produces significant changes in the chemical shift of the protons on the ZnII binding domain until a ZnII:1-Eu ratio of 2 is reached.
ZnCl2 was added in 0.16 equiv. aliquots until a ZnII:1-Eu ratio of 3.82 was obtained. During the titration significant changes in the chemical shift of the dpa protons were observed until a ZnII:1-Eu ratio of 2 was reached. The addition of excess ZnII beyond this stoichiometry produced only negligible changes in chemical shift, confirming that 1-Eu binds two ZnII ions per complex (Figure 4).
Figure 4.

Top: aromatic region of 1H NMR spectrum of Eu-1 with increasing amounts of ZnII. Bottom: Chemical shift of peaks c, e, f, and d (see Figure 3) as a function of ZnII/Eu-1 ratio. It is clear that the peaks of the ZnII binding domain shift only until a ZnII/Eu-1 ratio of 2 is obtained, confirming that each Eu-1 binds two ZnII ions.
In vitro Labeling of Bacteria with MRI Contrast Agents
The relative affinity of Zn-1, Zn-2, and Zn-3 for bacteria was determined by quantifying the amount of GdIII bound to bacterial cells after incubation with various concentrations of each contrast agent. The binding affinity was examined for both a Gram-positive strain, S. aureus, and a Gram-negative strain, E. coli (Figure 5).
Figure 5.

In vitro cellular labeling of S. aureus and E. coli with Zn-1, Zn-2, and Zn-3. S. aureus (top) or E. coli (bottom) were incubated with increasing concentrations of Zn-1 (black bars), Zn-2 (gray bars), or Zn-3 (white bars) at room temperature in LB broth. GdIII content was analyzed by ICP-MS and is represented as the total amount of GdIII per sample. Data are represented as the means ±SEM.
Zn-1 binds readily to S. aureus in a dose-dependent manner, with maximum binding occurring at an incubation concentration of 100 μm (Figure 5). However, S. aureus incubated with Zn-2 and Zn-3 show only minor increases in GdIII content with increasing incubation concentrations, likely due to non-specific binding of the agents to the cell surface. At all incubation concentrations the GdIII content of Zn-2 and Zn-3 incubated S. aureus is significantly less than cells incubated with Zn-1. Specifically, the GdIII content of S. aureus incubated with 100 μm Zn-1 is approximately 16-fold higher than bacteria incubated with 100 μm Zn-2 and 18-fold higher than bacteria incubated with Zn-3 (Figure 5).
Interestingly, Zn-2 does not show an increased affinity for the anionic bacterial membrane despite its positive charge. This suggests that for bacteria-targeted MR contrast agents, the mechanism of interaction between the Zndpa groups and the membrane phospholipids requires the presence of two Zn-dpa moieties, possibly due to a cooperative-binding effect of multiple Zn-dpa moieties on the same molecule coordinating to anionic phosphates on the bacterial surface.[11e,12] We speculate that this cooperative interaction, in addition to the greater charge of the complex, is responsible for the increased affinity of Zn-1 for S. aureus.
In vitro labeling experiments with E. coli indicate that Zn-1 exhibits an affinity for Gram-negative strains; however, the extent of non-specific binding exhibited by Zn-2 and Zn-3 is much greater for E. coli than S. aureus. For lower concentrations of contrast agent (≤ 100 μm), Zn-1 incubated E. coli retains more GdIII than Zn-2 or Zn-3 treated cells (Figure 5). Similar to S. aureus, the GdIII content of Zn-1 incubated E. coli increases in a concentration-dependent manner and plateaus at 50 μm (contrast agent incubation concentration) whereas the GdIII content of Zn-2 and Zn-3 incubated E. coli continues to increase even above 50 μm incubation concentrations. This supports the hypothesis that these increases are due to non-specific binding to the surface of E. coli.
MR Imaging of Bacterial Cells Labeled with Zn-1, Zn-2, Zn-3
To evaluate the potential of Zn-1 as a molecular imaging probe, T1 and T2 relaxation times of S. aureus labeled with Zn-1, Zn-2, and Zn-3 were acquired at 1.41 T and 7 T. (T2 data can be found in the Supporting Information). Bacteria were labeled as described above, using an incubation concentration of 300 μm contrast agent. The samples were washed with LB media and diluted in agarose to create a uniform suspension of bacteria. The T1-weighted image acquired at 7 T shows significant contrast enhancement in the Zn-1 labeled sample compared to untreated bacteria; conversely, Zn-2 and Zn-3 labeled bacteria show no such contrast enhancement (Figure 6).
Figure 6.

S. aureus cultures were incubated with 300 μm Zn-1, Zn-2 or Zn-3. Cells were washed 3 times with LB-broth and resuspended in 1% agarose. Scale bar represents 300 μm. Top: T1-weighted map was acquired at 7 T at 25 °C (TR/TE = 500/11 ms). Cells labeled with Zn-1 are clearly brighter than both unlabeled bacteria and bacteria treated with Zn-2 or Zn-3. Bottom: T1 relaxation times of agarose suspensions of S. aureus were measured using a saturation recovery pulse sequence with an echo time (TE) of 11 ms and repetition times (TR) as indicated in the Experimental Procedures at 7 T and 1.41 T. Data are presented as the percent reduction in T1 vs. bacteria incubated with LB media, washed, and suspended in agarose.
At 7 T, the T1 relaxation time of S. aureus cultures labeled with Zn-1 is approximately 21% lower than the T1 of untreated cultures. At 1.41 T the reduction in T1 increases to 44% (Figure 6). Conversely, the T1 of Zn-2 and Zn-3 labeled bacteria is reduced by only 10 and 28% vs. control at 7 T and 1.41 T, respectively (Figure 6).
The pronounced reduction in T1 relaxation observed at 1.41 T as compared to 7 T may be explained by the field strength dependence of the relationship between rotational correlation time (τR) and relaxivity.[20] Binding of MR contrast agents to large macromolecules is known to increase the τR, and subsequently the r1, of contrast agents.[20–21] Zn-1 is presumed to adhere to the bacterial surface, so it is reasonable to expect both the τR and r1 of the agent to increase upon binding. However, the influence of τR on relaxivity is dependent on the field strength; at lower field strengths (i.e. 1.41 T), the effect of τR enhancement on relaxivity is more pronounced.[20] Consequently, it is reasonable that bacteria labeled with Zn-1 exhibit greater decrease in T1 at lower field strengths.
Equation (1) used to calculate q of Zn-1-Tb. τH20 and τD20 are the time constants for the exponential fluorescence decay in H2O and D2O, respectively.
Conclusions
We have developed a MR contrast agent (Zn-1) that is capable of labeling bacteria cells in vitro. The agent is composed of two cationic, bacteria-targeting ZnII-dpa groups conjugated to a macrocyclic GdIII complex. NMR studies confirm that each dpa group on the complex binds one ZnII ion, giving the final Zn-1 complex an overall charge of 4+.
Zn-1 shows a dose-dependent affinity for S. aureus nearly 20 times higher than the charge neutral control compound Zn-3. The low labeling efficiency of Zn-2, a contrast agent containing only one Zn-dpa group, indicates that the interaction between the Zn-dpa groups of Zn-1 and the anionic phosphate groups of the bacterial membrane require the presence of two Zn-dpa groups for effective binding. The reduction in the T1 relaxation time of bacteria labeled with Zn-1 corresponds to a significant contrast enhancement at 7 T, though as expected is more pronounced at lower field strengths, verifying the potential of Zn-1 as an in vivo MR probe for detection of bacterial infection.
Experimental Section
Bacterial Culture
Staphylococcus aureus (29213) and Escherichia coli K-12 (29425) were obtained from ATCC (Rockville, MD). Bacteria were grown from glycerol stocks, cultured in Luria–Bertani (LB) growth media with agitation overnight at 37 °C. All experiments were performed after the bacteria had reached stationary phase to ensure that bacterial growth did not affect labeling efficiency. The optical density at 600 nm (OD600) was measured before and after labeling to confirm that the number of bacteria did not change significantly during the course of the experiment.
Synthesis of Zn-1
Chloromethyl ethyl ether and 2,2’-dipicolylamine were obtained from TCI America. All other chemicals were obtained from Sigma Aldrich and used without further purification. EMD 60F 254 silica gel plates were used for thin layer chromatography and visualized using UV light, iodoplatinate stain, or cerium ammonium molybdate (CAM) stain. Column chromatography was performed using standard grade 60 Å 230–400 mesh silica gel (Sorbent Technologies). Unless otherwise noted, 1H and 13C NMR were obtained on a Bruker Avance III 500 MHz NMR Spectrometer. A Varian 1200 L single-quadrupole mass spectrometer was used to acquire electrospray ionization mass spectra (ESI-MS). Semi-preparative HPLC was performed on a Waters 19 × 250 mm Atlantis C18 Column. Analytical HPLC-MS was performed using a Waters 4.6 × 250 mm 5 μm Atlantis C18 column using the Varian Prostar 500 system equipped with a Varian 380 LC ELSD system, a Varian 363 fluorescence detector, and a Varian 335 UV/Vis detector. 1H NMR of 1-Eu as a function of ZnII concentration was performed on a Bruker Avance III 600 MHz spectrometer at 60 °C in d6-DMSO.
Dimethyl 5-hydroxyisophthalate (4) was synthesized according to literature procedure.[17]
Dimethyl 5-(Ethoxymethoxy)isophthalate (5)
To a solution of 4 (4.42 g, 21 mmol) in acetone (50 mL) was added K2CO3 (11.5 g, 84 mmol). The reaction was cooled to 0 °C, and chloromethylethyl ether (2.74 g, 29 mmol) was added. After 12 h, TLC (30% ethyl acetate/hexanes) confirmed completion of the reaction. The reaction mixture was filtered and the solvent evaporated. The residue was purified on a silica gel column, eluting with 15% ethyl acetate/hexanes, to give 4.72 g of product as a white solid (84% yield). 1H NMR (500 MHz, CDCl3): δ = 8.29 (t, J = 1.5 Hz, 1 H, Haryl), 7.84 (d, J = 1.5 Hz, 2 H, Haryl), 5.27 (s, 2 H, O-CH2-O), 3.91 (s, 6 H, O-CH3), 3.71 (q, J = 7.0 Hz, 2 H, CH2CH3), 1.19 (t, J = 7.1 Hz, 3 H, CH2CH3) ppm. 13C NMR (126 MHz, CDCl3): δ = 166.08 (COOMe), 157.38 (Car-OCH2), 131.83 (Car-COOMe), 124.00 (Car), 121.55 (Car), 93.14 (O-CH2-O), 64.68 (CH2-CH3), 52.48 (COO-CH3), 15.12 (CH3) ppm.
[5-(Ethoxymethoxy)-1,3-phenylene]dimethanol (6)
Lithium aluminum hydride (1.22 g, 32.8 mmol) was suspended in THF (50 mL), and the mixture cooled to 0 °C. A solution of 5 (4 g, 14.9 mmol) in THF (40 mL) was added dropwise to the LAH suspension. After 2 h, completion of the reaction was confirmed by TLC (5% MeOH/DCM). The reaction was quenched with 15 mL of water. The reaction mixture was filtered and the solvent evaporated. The residue was brought up in ethyl acetate and washed with water and brine. The organic layer was dried with Na2SO4, filtered, and the solvent evaporated to give 2.63 g of product as a white, oily solid (83% yield). 1H NMR (500 MHz, CDCl3): δ = 6.99 (s, 1 H, Har), 6.94 (d, J = 1.4 Hz, 2 H, Har), 5.22 (s, 2 H, O-CH2-O), 4.64 (d, J = 3.7 Hz, 4 H, CH2-OH), 3.72 (q, J = 7.0 Hz, 2 H, CH2CH3), 2.15 (s, 2 H, OH), 1.22 (t, J = 7.1 Hz, 3 H, CH CH3) ppm. 13C NMR (126 MHz, CDCl3): δ = 157.85 (Car-OCH2), 142.97 (Car-CH2OH), 118.73 (Car), 113.92 (Car), 93.15 (O-CH2-O), 65.15 (CH2-OH), 64.51 (CH2CH3), 15.23 (CH2-CH3) ppm.
1,3-Bis(chloromethyl)-5-(ethoxymethoxy)benzene (7)
Trichlorotriazine (4.35 g, 23.58 mmol) was dissolved in DMF (10 mL) at room temperature and allowed to stir for one hour until the formation of a yellow precipitate was observed. A solution of 6 (2 g, 9.43 mmol) in DCM (30 mL) was added and the reaction allowed to stir overnight at room temperature. After confirming completion of the reaction by TLC (15% ethyl acetate/hexanes), the reaction mixture was transferred to a separatory funnel and washed successively with water, a saturated solution of Na2CO3, and brine. The organics were dried with Na2SO4, filtered and the solvent evaporated. The residue was adsorbed to silica and purified on a silica gel column, eluting with 5% ethyl acetate/hexanes to give 1.29 g of product as a clear oil (55% yield). 1H NMR (500 MHz, CDCl3): δ = 7.06 (d, J = 1.5 Hz, 1 H, Har), 7.03 (d, J = 1.6 Hz, 2 H, Har), 5.24 (s, 2 H, O-CH2-O), 4.54 (s, 4 H, CH2-Cl), 3.73 (q, J = 7.1 Hz, 2 H, CH2-CH3), 1.23 (t, J = 7.1 Hz, 3 H, CH2-CH3) ppm. 13C NMR (126 MHz, CDCl3): δ = 157.85 (Car-OCH2), 139.38 (Car-CH2Cl), 121.96 (Car), 116.37 (Car), 93.15 (O-CH2-O), 64.46 (CH2CH3), 45.76 (CH2Cl), 15.13 (CH2CH3) ppm.
[5-(Ethoxymethoxy)benzene-1,3-diyl]bis[N,N-bis(pyridin-2-ylmethyl)methanamine] (8)
DIEA (1.74 g, 13.5 mmol) and 2,2’-dipicolylamine were stirred in DCM (10 mL) for 10 min. A solution of 7 in DCM (10 mL) was added and the reaction allowed to stir at room temperature. After 4 d, completion of the reaction was confirmed by MS. The solvent was evaporated and the residue purified on a silica column eluting with 4 % methanol/chloroform to give 3.5 g of product as a yellow oil (99% yield). 1H NMR (500 MHz, CDCl3): δ = 8.48 (dd, J = 3.8, 2.3 Hz, 4 H, o-Hpy), 7.66–7.54 (m, 8 H, Hpy), 7.11 [td, J = 5.1, 3.3 Hz, 5 H, Hpy (4 H), Har (1 H)], 7.02 (d, J = 1.4 Hz, 2 H, Har), 5.20 (s, 2 H, O-CH2-O), 3.78 (s, 8 H, N-CH2-Cpy), 3.71 (q, J = 7.1 Hz, 2 H, CH2-CH3), 3.63 (s, 4 H, Car-CH2-N), 1.19 (t, J = 7.1 Hz, 3 H, CH2CH3) ppm. 13C NMR (126 MHz, CDCl3): δ = 159.88 (CH2-o-Cpy-Npy), 157.74 (Car-OCH2), 149.02 (o-Cpy-Npy), 140.85 (Car-CH2N), 136.53 (c-Cpy), 122.78 (m-Cpy), 122.44 (Car), 122.04 (m-Cpy), 115.12 (Car), 93.32 (O-CH2-O), 64.27 (CH2CH3), 60.16 (N-CH2-Cpy), 58.57 (Ca r-CH2-N), 15.26 (CH2CH3) ppm. MS (ESI-positive): m/z = 575.3 [M+], 597.3 [M + Na+].
3,5-Bis{[bis(pyridin-2-ylmethyl)amino]methyl}phenol (9)
A solution of 8 (2.21 g, 3.84 mmol) in DCM was heated to 40 °C. Trifluoroacetic acid (2.38 mL, 23 mmol) was added and the reaction allowed to stir for 12 h (monitored by TLC: 10% methanol/DCM). The protonated product was extracted from DCM with water. The aqueous layer was neutralized and the product extracted into DCM. The organic layers were combined, dried with Na2SO4, filtered and the solvent evaporated to give 1.73 g of product as a yellow oil. 1H NMR (500 MHz, CDCl3): δ = 8.52–8.40 (m, 4 H, o-Hpy), 7.65–7.54 (m, 8 H, Hpy), 7.12 (td, J = 5.7, 2.4 Hz, 4 H, Hpy), 7.02 (s, 1 H, Har), 6.79 (d, J = 1.2 Hz, 2 H, Har), 3.77 (s, 8 H, CH2-Cpy), 3.56 (s, 4 H, Car-CH2-N), 2.60–2.20 (m, 1 H, OH) ppm. 13C NMR (126 MHz, CDCl3): δ = 159.88 (CH2-Cpy-Npy), 157.57 (Car-OH), 148.80 (o-Cpy), 140.74 (Car-CH2N), 136.86 (p-Cpy), 123.03 (m-Cpy), 122.24 (m-Cpy), 120.07 (Car), 114.86 (Car), 60.05 (N-CH2-Cpy), 58.77 (Car-CH2-N) ppm. MS (ESI-positive): m/z = 517.2 [M+], 539.2 [M + Na+].
Tri-tert-butyl 10-[3-(3,5-Bis{[bis(pyridin-2-ylmethyl)amino]methyl}-phenoxy)propyl]-1,4,7,10-tetraazacyclododecane-1,4,7-tricarboxylate (10)
Tri-tert-butyl 10-(3-bromopropyl)-1,4,7,10-tetraazacyclododecane-1,4,7-tricarboxylate (tris-tert-butyl-DO3A) was synthesized by reacting tris-tert-butyl-DO3A with a large excess of 1,3-dibromopropane. K2CO3 (1.85 g, 13.48 mmol) and dibromopro-pane (3.4 mL, 30.36 mmol) were dissolved in acetonitrile (400 mL) and cooled to 0 °C. Tris-tert-butyl-DO3A (2 g, 3.36 mmol), synthesized according to literature procedure, was dissolved in acetonitrile (50 mL) and added to the above solution via dropping funnel. Reaction progress was monitored by MS. After three days the reaction was filtered, the solvent evaporated, and the crude product run on a silica gel column, eluting with 2–4% methanol in DCM. The bromopropyl-DO3A was added to a solution of K2CO3 (1.25 g, 9.05 mmol) and 9 (937 mg, 1.81 mmol) in acetonitrile (60 mL). The reaction was heated to 70 °C and allowed to reflux under nitrogen for 48 h. The reaction mixture was filtered and the solvent evaporated. The crude product was purified on a silica gel column, eluting with 7–10% methanol in chloroform to give 460 mg of yellow oil (25% yield). 1H NMR (500 MHz, CDCl3): δ = 8.51 (dt, J = 4.9, 1.4 Hz, 4 H, o-Hpy), 7.75–7.52 (m, 8 H, Hpy), 7.15 [ddd, J = 6.9, 4.8, 1.5 Hz, 5 H, 4 Hpy (4 H), Har (1 H)], 6.75 (d, J = 1.5 Hz, 2 H, Har), 3.92 (s, 2 H, CH2-CH2-OH), 3.79 (s, 8 H, N-CH2-Cpy), 3.64 (s, 4 H, Car-CH2-N), 3.41–1.80 [m, 26 H, N-CH2-CH2-N (16 H), N-CH2-COOH (6 H), N-CH2-CH2-CH2 (4 H)], 1.44 (d, J = 9.8 Hz, 27 H) ppm. 13C NMR (126 MHz, CDCl3): δ = 172.68 (COO-tBu), 171.77 (COO-tBu), 158.68 (CH2-Cpy-Npy), 157.96 (Car-OCH2), 148.01 (o-Cpy), 139.57 (Car-CH2-N), 135.56 (p-Cpy), 121.76 (m-Cpy), 121.10 (m-Cpy), 120.50 (Car), 112.46 (Car), 81.76 (O-C-CH3), 81.45 (O-C-CH3), 80.91 (O-C-CH3), 65.29 (O-CH2-CH2), 59.03 (N-CH2-Cpy), 57.65 (Car-CH2-N), 55.64 (N-CH2-CH2-N), 54.86 (N-CH2-CH2-N), 49.48 (N-CH2-COOH), 27.17 (C-CH3), 27.03 (C-CH3), 26.87 (C-CH3), 25.18 (CH2-CH2-CH2) ppm. MS (ESI-positive): m/z = 1071 [M+], 1093 [M + Na+], 547.6 [(M+ + Na+)/2], 558.3 [(M + 2Na+)/2], 573.4 [(M + Na+ + K+)/2], 595.3 [(M + 3K+)/2].
Bis-dpa-Gd (1)
The protected ligand 10 (338 mg, 0.315 mmol) was dissolved in a mixture of 95:2.5:2.5 TFA/triisopropylsilane/water and allowed to stir for four hours. The acid was evaporated under nitrogen. Removal of the tert-butyl protecting groups was confirmed by ESI-MS. The residue was brought up in water (5 mL) and the pH adjusted to 6.5 with NaOH (1 m). Gd(OAc)3 6 H2O (148 mg, 0.47 mmol) was added, and the solution allowed to stir at 50 °C for 4 d, adjusting the pH back to 6.5 with NaOH (1 m) as needed. The product was purified with reverse phase semi-preparative HPLC using a C18 column and eluting with a gradient of 0– 100% acetonitrile in water over 35 min, tr = 23 min. The purity and identity of the product was confirmed using analytical HPLC-MS on a C18 column, eluting with a gradient of 20–100% acetonitrile in water over 35 min, tr = 19.5 min. The solvent was evaporated from pure fractions, and the residue brought up in DMSO and freeze dried. MS (ESI-positive) m/z = 1058.3 [M+], 530.6 [M2+/2].
Bis-dpa-Eu (1-Eu)
The same procedure was followed as for 1, using EuCl3·6H2O for metallation. Retention times were the same as for 1. MS (ESI-positive): m/z = 1053.2 [M+] 527.2 [M2+/2].
Bis-dpa-Tb (1-Tb)
The same procedure was followed as for 1, using Tb(OAc)3·6H2O for metallation. Retention times were the same as for 1. MS (ESI-positive): m/z = 1059.2 [M+] 530.2 [M2+/2].
Luminesence Lifetime Measurements
The luminescence lifetime of a 200 mm solution of Zn-1-Tb was measured H2O and D2O on a Hitachi (San Francisco, CA) F4500 fluorimeter, using a λx = 254 nm and λem = 544 nm. Twenty-five scans were acquired, averaged and fit to a monoexponential decay function.
Quantification of Bacterial Cell Labeling by Inductively Coupled Plasma Mass Spectrometry (ICP-MS)
Stock solutions (1 mm) of 1, 2, and 3 were prepared by dissolving each contrast agent in a solution of 2% DMSO in LB media. One molar equivalent of ZnCl2 was added to 2 and 3, while two molar equivalents of ZnCl2 were added to 1. The solutions were incubated at room temperature for 20 min (to form the ZnII-bound complexes), and were placed in a sonicating water bath (Branson 5510; Branson Ultrasonics, Danbury, CT) for an additional 10 min to ensure that all material was dissolved. The stock solutions were diluted to the desired concentrations with LB media.
S. aureus or E. coli cells were grown from a glycerol stock in LB media overnight. One mL aliquots of bacteria were taken and centrifuged at 6000 g for 3 min. The bacterial cell pellets were re-suspended in various concentrations of Zn-1, Zn-2 or Zn-3 and allowed to incubate at room temperature for 1 h while rotating. Bacteria were then centrifuged at 6000 g for 3 min, the supernatant was decanted, and the bacterial cell pellets were re-suspended in 1 mL LB media. This was repeated two more times for a total of three washes to remove any unbound contrast agent and decrease non-specific binding.
After washing, quantification of gadolinium was accomplished using inductively coupled plasma mass spectrometry (ICP-MS) of acid-digested samples. Specifically, bacterial cell pellets were digested in 100 μL of concentrated nitric acid (> 69%, Sigma, St. Louis, MO, USA) and placed at 70 °C for at least 12 h to allow for complete sample digestion. Ultra pure H2O (18.2 MΩ·cm) and multi-element internal standard containing Bi, Ho, In, Li(6), Sc, Tb, and Y (CLISS-1, Spex Certiprep, Metuchen, NJ, USA) were then added to produce a final solution of 3.0% nitric acid (v/v) and 5.0 ng/mL internal standard up to a total sample volume of 10 mL. Samples were then syringe filtered using 0.2 μm polyamide filters (Macherey–Nagel, Germany) into new 15 mL conical tubes. Individual Gd elemental standards were prepared at 1.00, 5.00, 10.0, 25.0, 50.0, 100, and 250 ng/mL concentrations with 3.0% nitric acid (v/v) and 5.0 ng/mL internal standards up to a total sample volume of 25 mL (using volumetric flasks).
ICP-MS was performed on a computer-controlled (Plasmalab software) Thermo X series II ICP-MS (Thermo Fisher Scientific, Waltham, MA, USA) equipped with a CETAC 260 autosampler (Omaha, NE, USA). Each sample was acquired using 1 survey run (10 sweeps) and 3 main (peak jumping) runs (100 sweeps). The isotopes selected for analysis were 157,158Gd, and 115In and 165Ho (chosen as internal standards for data interpolation and machine stability).
Relaxation Time Measurements at 1.41 T
T1 and T2 relaxation times were measured on a Bruker mq60 NMR analyzer equipped with Minispec v. 2.51 Rev.00/NT software (Billerica, MA, USA) operating at 1.41 T (60 MHz) and 37 °C. T1 relaxation times were measured using an inversion recovery pulse sequence (t1_ir_mb) with the following parameters: four scans per point, 10 data points for fitting, mono-exponential curve fitting, phase cycling, 10 ms first pulse separation, and a recycle delay and final pulse separation ≥ 5T1. T2 relaxation times were measured using a Carr–Purcell–Meiboom–Gill (CPMG) pulse sequence (t2_cp_mb) with the following parameters: four scans per point, mono-exponential curve fitting, phase cycling, 10 ms first pulse separation, 15 second recycle delay, 1 ms 90°–180° pulse separation (tau), while altering the number of data points to ensure accurate mono-exponential curve fitting (500–10000 data points for fitting). Relaxivities were determined by taking the slope of a plot of 1/T1(s–1) or 1/T2(s–1) vs. gadolinium concentration (mM) of each compound in either LB broth or in 1% (w/v) agarose.
MR Imaging and Relaxation Time Measurements at 7.05 T
All MR imaging was performed on an 89 mm bore size PharmaScan 7.05 T MR imaging spectrometer fitted with shielded gradient coils (Bruker BioSpin, Billerica, MA, USA) using a RF RES 300 1H 089/023 quadrature transmit/receive mouse brain volume coil (Bruker BioSpin, Billerica, MA, USA). All MR images were acquired using Paravision 5.0.1 software (Bruker BioSpin, Billerica, MA, USA).
S. aureus cultures were labeled with 300 μM Zn-1, Zn-2, and Zn-3 and then washed three times the LB broth as described previously. After the final wash samples were centrifuged at 6000 g for 3 min to pellet the bacteria, which were then suspended in 1.0 % (w/v) low melting point agarose (Sigma, St. Louis, MO) in 7.5 mm outer diameter NMR tubes and incubated on ice to allow for gelation of the agarose. Samples were then positioned in a 23 mm mouse brain volume transmit/receive coil prior to imaging.
T1-weighted images were acquired using a rapid-acquisition rapid-echo variable-repetition time (RAREVTR) pulse sequence using the following parameters: RARE factor: 1, echo time (TE): 11 ms, averages: 3, matrix size (MTX): 128 × 128, field of view (FOV): 25 × 25 mm2, 6 slices, slice thickness: 1.5 mm, interslice distance: 2.0 mm, repetition times, TR = 15000, 10000, 8000, 6000, 3000, 1500, 1000, 750, 500, 300, 200, and 150 ms, and a total scan time of ca. 3 h 45 min. T1 values of selected regions of interest (ROIs) of 5 out of 6 slices were calculated using the T1 saturation recovery mono-exponential curve fitting formula provided by the image sequence analysis (ISA) tool in Paravision 5.0.1 software (Bruker BioSpin, Billerica, MA, USA).
Color T1 maps were generated using using Jim v. 6.0 software (Xinapse Systems Ltd., Aldwincle, UK). Briefly, the desired ROIs were masked using the contour ROI function T1 maps were then generated using the saturation-recovery T1 fit function in the image-least-squares fitter entering TRs in the single input image configuration. Color maps were generated using an inverted rainbow color lookup table setting the maximum T1 to 3000 ms. Images were processed using the image resampler by resizing pixels to smooth the image by converting a 128 × 128 MTX to 384 × 384 MTX (changing the number of columns and rows under pixel resizing specifications).
T2-weighted images were acquired using a multi-slice multi-echo (MSME) pulse sequence with variable echo times using the following parameters: TR = 6000 ms, averages: 3, MTX = 128 × 128, FOV = 25 × 25 mm2, 6 slices, slice thickness: 1.5 mm, interslice distance: 2.0 mm, TE = 11, 22, 33, 44, 55, ... 352 ms, and a total scan time of ca. 29 min. T2 values of selected regions of interest (ROIs) of 5 out of 6 slices were calculated using a T2 mono-exponential decay curve fitting formula provided by the image sequence analysis (ISA) tool in Paravision 5.0.1 software (Bruker BioSpin, Billerica, MA, USA).
Color T2 maps were generated using using Jim v. 6.0 software (Xinapse Systems Ltd., Aldwincle, UK). Briefly, the desired ROIs were masked using the contour ROI function T2 maps were then generated using the single-exponential T2 decay fit function in the image-least-squares fitter entering TEs in the single input image configuration. Color maps were generated using an inverted rainbow color lookup Table setting the maximum T2 to 200 ms and the minimum T2 to 75 ms. Images were processed using the image resampler by resizing pixels to smooth the image by converting a 128 × 128 MTX to 384 × 384 MTX (changing the number of columns and rows under pixel resizing specifications).
Supplementary Material
Acknowledgments
The authors gratefully acknowledge Daniel Mastarone for assistance with NMR experiments. This work was generously supported by the National Institutes of Health (NIH) (grant nuber R01EB005866). Imaging work was performed at the Northwestern University Center for Advanced Molecular Imaging generously supported by the National Cancer Institute Cancer Center Support Grant (NCI CCSG P30 CA060553 awarded to the Robert H. Lurie Comprehensive Cancer Center). MRI was performed on the 7 T Bruker Pharmascan system purchased with the support of the National Center for Research Resources (NCRR) (grant number 1S10RR025624-01). NMR studies were completed at the Northwestern University Integrated Molecular Structure Education and Research Center. A description of the facility and full funding dis closure can be found at http://pyrite.chem.northwestern.edu/analyticalserviceslab/asl.htm. Metal analysis was performed at the Northwestern University Quantitative Bioelemental Imaging Center generously supported by the NASA Ames Research Center (grant number NNA04CC36G). L. M. M. acknowledges support from the National Science Foundation Graduate Research Fellowship. A. S. H. acknowledges support from the Natural Sciences and Engineering Research Council of Canada for a post-graduate fellowship.
Footnotes
Supporting information for this article is available on the WWW under http://dx.doi.org/10.1002/ejic.201101362.
Supporting Information (see footnote on the first page of this article): 1H NMR, 13C NMR, and mass spectra of synthetic intermediates, HPLC traces of Zn-1, Zn-1-Eu, and Zn-1-Tb, luminescence lifetime measurements of Zn-1-Tb, relaxivity plots of Zn-1; 1H NMR of Zn titration into 1-Eu, and T2 imaging data.
References
- 1.Singh A, Goering RV, Simjee S, Foley SL, Zervos MJ. Clin. Microbiol. Rev. 2006;19:512–530. doi: 10.1128/CMR.00025-05. [DOI] [PMC free article] [PubMed] [Google Scholar]
- 2.a Caly WR, Strauss E. J. Hepatol. 1993;18:353–358. doi: 10.1016/s0168-8278(05)80280-6. [DOI] [PubMed] [Google Scholar]; b Kollef MH, Sherman G, Ward S, Fraser VJ. Chest. 1999;115:462–474. doi: 10.1378/chest.115.2.462. [DOI] [PubMed] [Google Scholar]; c Rayes N, Seehofer D, Theruvath T, Schiller Reinhold A, Langrehr Jan M, Jonas S, Bengmark S, Neuhaus P. Am. J. Transplant. 2005;5:125–130. doi: 10.1111/j.1600-6143.2004.00649.x. [DOI] [PubMed] [Google Scholar]
- 3.a Aydinuraz K, Ağalar C, Ağalar F, Çeken S, Duruyürek N, Vural T. J. Surg. Res. 2009;157:e79–e86. doi: 10.1016/j.jss.2009.04.008. [DOI] [PubMed] [Google Scholar]; b Ben H. Chew, Lange D. Nat. Rev. Urol. 2009;6:440–448. doi: 10.1038/nrurol.2009.124. [DOI] [PubMed] [Google Scholar]
- 4.Hirsch Elizabeth B, Tam Vincent H. Expert Rev. Pharmacoecon Outcomes Res. 2010;10:441–451. doi: 10.1586/erp.10.49. [DOI] [PMC free article] [PubMed] [Google Scholar]
- 5.Pourakbari B, Mamishi S, Zafari J, Khairkhah H, Ashtiani MH, Abedini M, Afsharpaiman S, Rad SS. Braz. J. Infect. Dis. 2010;14:252–255. [PubMed] [Google Scholar]
- 6.Pien BC, Sundaram P, Raoof N, Costa SF, Mirrett S, Woods CW, Reller LB, Weinstein MP. Am. J. Med. 2010;123:819–828. doi: 10.1016/j.amjmed.2010.03.021. [DOI] [PubMed] [Google Scholar]
- 7.Wang L, Zhao W, O'Donoghue Meghan B, Tan W. Bioconjugate Chem. 2007;18:297–301. doi: 10.1021/bc060255n. [DOI] [PubMed] [Google Scholar]
- 8.Zhang S, Zhang W, Wang Y, Jin Z, Wang X, Zhang J, Zhang Y. Bioconjugate Chem. 2011;22:369–375. doi: 10.1021/bc100357w. [DOI] [PubMed] [Google Scholar]
- 9.Brouwer CPJM, Sarda-Mantel L, Meulemans A, Le Guludec D, Welling MM. Mini-Rev. Med. Chem. 2008;8:1039–1052. doi: 10.2174/138955708785740670. [DOI] [PubMed] [Google Scholar]
- 10.Ning X-H, Lee S-J, Wang Z-R, Kim D-I, Stubblefield B, Gilbert E, Murthy N. Nat. Mater. 2011;10:602–607. doi: 10.1038/nmat3074. [DOI] [PMC free article] [PubMed] [Google Scholar]
- 11.a Leevy WM, Gammon ST, Johnson JR, Lampkins AJ, Jiang H, Marquez M, Piwnica-Worms D, Suckow MA, Smith BD. Bioconjugate Chem. 2008;19:686–692. doi: 10.1021/bc700376v. [DOI] [PMC free article] [PubMed] [Google Scholar]; b DiVittorio KM, Leevy WM, O'Neil EJ, Johnson JR, Vakulenko S, Morris JD, Rosek KD, Serazin N, Hilkert S, Hurley S, Marquez M, Smith BD. ChemBioChem. 2008;9:286–293. doi: 10.1002/cbic.200700489. [DOI] [PMC free article] [PubMed] [Google Scholar]; c Leevy WM, Johnson JR, Lakshmi C, Morris J, Marquez M, Smith BD. Chem. Commun. 2006:1595–1597. doi: 10.1039/b517519d. [DOI] [PubMed] [Google Scholar]; d Leevy WM, Gammon ST, Jiang H, Johnson JR, Maxwell DJ, Jackson EN, Marquez M, Piwnica-Worms D, Smith BD. J. Am. Chem. Soc. 2006;128:16476–16477. doi: 10.1021/ja0665592. [DOI] [PMC free article] [PubMed] [Google Scholar]; e Lakshmi C, Hanshaw RG, Smith BD. Tetrahedron. 2004;60:11307–11315. [Google Scholar]
- 12.Surman AJ, Bonnet CS, Lowe MP, Kenny GD, Bell JD, Toth E, Vilar R. Chem. Eur. J. 2011;17:223–230. S223/221–S223/216. doi: 10.1002/chem.201001397. [DOI] [PubMed] [Google Scholar]
- 13.Koga Y. J. Mol. Evol. 2011;72:274–282. doi: 10.1007/s00239-011-9428-5. [DOI] [PubMed] [Google Scholar]
- 14.Jaffer FA, Weissleder R. JAMA J. Am. Med. Assoc. 2005;293:855–862. doi: 10.1001/jama.293.7.855. [DOI] [PubMed] [Google Scholar]
- 15.a Sukerkar PA, MacRenaris KW, Meade TJ, Burdette JE. Mol. Pharm. 2011;8:1390–1400. doi: 10.1021/mp200219e. [DOI] [PMC free article] [PubMed] [Google Scholar]; b Sukerkar PA, MacRenaris KW, Townsend TR, Ahmed RA, Burdette JE, Meade TJ. Bioconjugate Chem. 2011;22:2304–2316. doi: 10.1021/bc2003555. [DOI] [PMC free article] [PubMed] [Google Scholar]
- 16.a Major JL, Boiteau RM, Meade TJ. Inorg. Chem. 2008;47:10788–10795. doi: 10.1021/ic801458u. [DOI] [PMC free article] [PubMed] [Google Scholar]; b Major JL, Parigi G, Luchinat C, Meade TJ. Proc. Natl. Acad. Sci. USA. 2007;104:13881–13886. doi: 10.1073/pnas.0706247104. [DOI] [PMC free article] [PubMed] [Google Scholar]
- 17.Ashton PR, Anderson DW, Brown CL, Shipway AN, Stoddart JF, Tolley MS. Chem. Eur. J. 1998;4:781–795. [Google Scholar]
- 18.De Luca L, Giacomelli G, Porcheddu A. Org. Lett. 2002;4:553–555. doi: 10.1021/ol017168p. [DOI] [PubMed] [Google Scholar]
- 19.Quici S, Cavazzini M, Marzanni G, Accorsi G, Armaroli N, Ventura B, Barigelletti F. Inorg. Chem. 2005;44:529–537. doi: 10.1021/ic0486466. [DOI] [PubMed] [Google Scholar]
- 20.a Strauch RC, Mastarone DJ, Sukerkar PA, Song Y, Ipsaro JJ, Meade TJ. J. Am. Chem. Soc. 2011;133:16346–16349. doi: 10.1021/ja206134b. [DOI] [PMC free article] [PubMed] [Google Scholar]; b Hermann P, Kotek J, Kubicek V, Lukes I. Dalton Trans. 2008:3027–3047. doi: 10.1039/b719704g. [DOI] [PubMed] [Google Scholar]
- 21.a Manus LM, Mastarone DJ, Waters EA, Zhang X-Q, Schultz-Sikma EA, MacRenaris KW, Ho D, Meade TJ. Nano Lett. 2010;10:484–489. doi: 10.1021/nl903264h. [DOI] [PMC free article] [PubMed] [Google Scholar]; b Song Y, Xu X, MacRenaris KW, Zhang X-Q, Mirkin CA, Meade TJ. Angew. Chem. 2009;121:9307. doi: 10.1002/anie.200904666. [DOI] [PMC free article] [PubMed] [Google Scholar]; Angew. Chem. Int. Ed. 2009;48:9143–9147. S9143/9141–S9143/9124. doi: 10.1002/anie.200904666. [DOI] [PMC free article] [PubMed] [Google Scholar]; c Song Y, Kohlmeir EK, Meade TJ. J. Am. Chem. Soc. 2008;130:6662–6663. doi: 10.1021/ja0777990. [DOI] [PMC free article] [PubMed] [Google Scholar]; d Cilliers R, Song Y, Kohlmeir EK, Larson AC, Omary RA, Meade TJ. Magn. Reson. Med. 2008;59:898–902. doi: 10.1002/mrm.21518. [DOI] [PubMed] [Google Scholar]
Associated Data
This section collects any data citations, data availability statements, or supplementary materials included in this article.