

Abstract
An interaction between genes and the environment is a critical component underlying the pathogenesis of the hyperglycemia of type 2 diabetes. The development of more sophisticated techniques for studying gene variants and for analyzing genetic data has led to the discovery of some 40 genes associated with type 2 diabetes. Most of these genes are related to changes in β-cell function, with a few associated with decreased insulin sensitivity and obesity. Interestingly, using quantitative traits based on continuous measures rather than dichotomous ones, it has become evident that not all genes associated with changes in fasting or post-prandial glucose are also associated with a diagnosis of type 2 diabetes. Identification of these gene variants has provided novel insights into the physiology and pathophysiology of the β-cell, including the identification of molecules involved in β-cell function that were not previously recognized as playing a role in this critical cell.
Keywords: incretins, insulin secretion, insulin sensitivity, islet, proinsulin, zinc, glucokinase, TCF7L2, KCNJ11, ABCC8, SLC30A8
With the prevalence of type 2 diabetes continuing to increase and the condition now presenting itself as one of the major non-communicable diseases of our time, it is important that we use our knowledge of the disease process to develop approaches to predict and effectively treat those at risk and those who are already hyperglycemic. Methods for assessing insulin sensitivity and β-cell function have advanced and clearly demonstrated that type 2 diabetes and its forerunner prediabetes (impaired glucose metabolism) are characterized by insulin resistance and β-cell dysfunction, the latter comprising impaired insulin release and inefficient proinsulin processing [1].
With the continual development of new tools for genotyping and advanced statistical approaches for assessment of the association between genotype and disease, some 40 genes have been identified that are associated with type 2 diabetes [2,3]. Further, better phenotyping and the use of continuous rather than categorical variables have also proved advantageous in identifying genes related to glucose metabolism. The identification of these genes, many of which were previously not considered to have a relationship to type 2 diabetes, has been insightful regarding the pathogenesis of hyperglycemia and opened new avenues for research.
In this review, we examine the genetics of type 2 diabetes with a particular focus on a few genes and highlight how approaches to measuring insulin sensitivity and insulin release provide novel insight into the impact of these genes on glucose metabolism.
Assessing Insulin Sensitivity and β-cell Function – Lessons Learned and Relevance to the Risk of Developing Diabetes
Glucose metabolism is a highly integrated process that involves a number of different organ systems. Traditionally, the pancreas, liver, skeletal muscle and adipose tissue have been considered the critical components in assuring the maintenance of normal glucose metabolism. More recently, the role of the brain and gastrointestinal tract have become areas of active investigation as they also appear to be critical features of this complex regulatory system. The brain, and especially the hypothalamus, is extremely important in determining body weight and regulating the liver, with the neural action of peptides, including insulin, being critical [4,5]. The gastrointestinal tract is proving to be vitally important, largely in determining the β-cell’s response to oral nutrient ingestion through the release of the incretin hormones [6].
It has been well accepted for many years that type 2 diabetes is associated with decreased insulin action in liver, muscle and adipose tissue accompanied by abnormalities of β-cell function that result in inadequate insulin secretion [7]. However, the pathogenesis of lesser rises in glucose in the fasting state and post-prandially, as observed in those at high risk, has been a topic of greater debate. A better understanding of this issue has developed with the demonstration of the importance of the feedback loop system that regulates glucose levels exquisitely [1].
In our initial examination of the relationship between insulin sensitivity and insulin responses to β-cell stimulation, we demonstrated that the relationship is hyperbolic in nature and that this relationship exists when examining the acute insulin response to intravenous glucose as well as the effect of glucose to potentiate the response to arginine [8]. Subsequently, we have demonstrated that this relationship with insulin sensitivity also applies to the early insulin response (insulinogenic index) during an oral glucose tolerance test (Figure 1) [9]. Based on this hyperbolic relationship, the product of insulin sensitivity and the insulin response can be calculated and provides an estimate of β-cell function that accounts for the modulating effect of insulin sensitivity. This measure is frequently termed the disposition index. It has been and continues to be used extensively in physiological and intervention studies as well as for phenotyping individuals to better understand the pathogenesis and genetics of type 2 diabetes.
Figure 1.

The hyperbolic curves for normal glucose tolerance (NGT), impaired glucose metabolism (IGM; impaired glucose tolerance and/or impaired fasting glucose), and diabetes, are plotted for the insulinogenic index (ΔI0–30/ΔG0–30) versus 1/fasting insulin, the latter as a surrogate measure of insulin sensitivity. Reproduced with permission from [9].
Interpreting the insulin response as a function of insulin sensitivity has also emphasized that the pathogenesis of type 2 diabetes is essentially similar in a number of different ethnic/racial groups [10] (Figure 2). In both adult and adolescent populations with impaired glucose metabolism (impaired glucose tolerance with or without impaired fasting glucose), β-cell function is reduced compared to those with normal glucose tolerance and is further reduced in those with type 2 diabetes [9–11]. Further, even in individuals with a fasting glucose in the normal range, the disposition index declines with increasing fasting glucose concentrations [12]. In longitudinal studies, a reduced disposition index has been shown to predict the subsequent development of more marked hyperglycemia [9] and to decrease as individuals transition from normal glucose tolerance to impaired glucose tolerance and then to diabetes [11]. Finally, intervening to alter the relationship between insulin sensitivity and insulin release towards a higher disposition index improves glucose disposal in individuals with impaired glucose tolerance [13] and diabetes [14].
Figure 2.

β-cell function quantified as the insulinogenic index (ΔI30/ΔG30) (A) and the disposition index ([ΔI30/ΔG30])/HOMA-IR (B) from an oral glucose tolerance test in 531 first-degree relatives of whom 55 were African-American (first bar of each set), 66 were Asian-American (second bar of each set), 217 were Caucasian (third bar of each set), and 193 were Hispanic-American (fourth bar of each set). Individuals who had impaired fasting glucose (IFG) or impaired glucose tolerance (IGT) and had diabetes by the 2-hour or fasting glucose criteria, respectively, were classified as having diabetes. Reproduced with permission from [10].
Application of the disposition index concept has also provided insight relevant to the determination of genetic risk and type 2 diabetes. Studies have demonstrated that both insulin sensitivity (30–40%) and the insulin response (38%) are heritable, but that the disposition index is heritable to a greater extent (67%) [15,16]. Thus, it is not surprising that offspring of individuals with established type 2 diabetes have decreased β-cell function, even at a time when they are still considered to be normal, and that this declines over time leading to the development of glucose intolerance [17]. The importance of interpreting β-cell function in the context of the prevailing insulin sensitivity when examining the relationships between genotypic and phenotypic relationships in type 2 diabetes is discussed further later.
Genetics of Type 2 Diabetes – Approaches and General Observations
Discovery of genes associated with type 2 diabetes has progressed from an initial approach of examining candidate genes to association studies, both linkage and genome wide. The candidate gene approach assumes that a particular gene is associated with the disease based on the gene’s known function and the understood pathogenesis of the disease. On the other hand, the association approach does not rely on a specific hypothesis examining a particular gene product, but rather looks for associations with gene markers that appear to link with the disease. These different approaches have identified some 40 genes that appear to be linked to glucose metabolism, the vast majority likely related to the β-cell with others to insulin resistance, obesity and height (Table 1). Interestingly, the risk allele frequency for these gene variants is quite similar across different racial/ethnic groups [18] (Figure 3), which may in part also explain why β-cell function is much the same in these groups when they have IGT and diabetes [10].
Table 1.
Relationship of identified gene variants to glycemia-related traits determined by genome wide association studies (GWAS) and odds ratio of type 2 diabetes for the relevant genes.
| Gene Locus | Phenotype
|
Odds Ratio (95% CI) for Type 2 Diabetes per Allele | References to GWAS for Phenotypic Characteristics | |||||||||
|---|---|---|---|---|---|---|---|---|---|---|---|---|
| Fasting Glucose | 2-hour Glucose | HbA1c | Insulin Sensitivity | HOMA-IR | Fasting Insulin | HOMA-B | Insulin Release | Fasting Proinsulin | Type 2 Diabetes | |||
|
2000
| ||||||||||||
| PPARγ | X | X | 1.14 (1.08–1.20) | [24–26] | ||||||||
|
| ||||||||||||
|
2003
| ||||||||||||
| KCNJ11/ABCC8 | X | 1.15 (1.09–1.21) | [24] | |||||||||
|
| ||||||||||||
|
2006
| ||||||||||||
| TCF7L2 | X | X | X | X | 1.37 (1.28–1.47) | [29,70,71] | ||||||
|
| ||||||||||||
|
2007
| ||||||||||||
| IGF2BP2 | X | 1.17 (1.10–1.25) | [24–26,70] | |||||||||
| CDKAL1 | X | 1.12 (1.08–1.16) | [24–26] | |||||||||
| SLC30A8 | X | X | X | 1.12 (1.07–1.16) | [24–26,36,53] | |||||||
| CDKN2A/B | X | 1.20 (1.14–1.25) | [24–26] | |||||||||
| HHEX | X | 1.13 (1.08–1.17) | [24,53] | |||||||||
| FTO | X | 1.15 (1.09–1.22) | [25,26,70] | |||||||||
| HNF1B | X | 1.12 (1.07–1.18) | [72] | |||||||||
|
| ||||||||||||
|
2008
| ||||||||||||
| NOTCH2 | X | 1.13 (1.08–1.17) | [70] | |||||||||
| THADA | X | 1.15 (1.10–1.20) | [70] | |||||||||
| ADAMSTS9 | X | 1.09 (1.06–1.12) | [70] | |||||||||
| JAZF1 | X | 1.10 (1.07–1.13) | [70] | |||||||||
| CDC123/CAMKID | X | 1.11 (1.07–1.14) | ||||||||||
| KCNQ1 | X | 1.40 (1.34–1/47) 1.08 (1.06–1.10) |
[73] | |||||||||
| TSPAN8/LGR5 | X | 1.09 (1.06–1.12) | [70] | |||||||||
|
| ||||||||||||
|
2009
| ||||||||||||
| IRS1 | X | 1.19 (1.13–1.25) | [27] | |||||||||
|
| ||||||||||||
|
2010
| ||||||||||||
| DUSP9 | X | 1.27 (1.18–1.37) | ||||||||||
| PROX1 | X | X | 1.07 (1.05–1.09) | [29] | ||||||||
| BCL11A | X | 1.08 (1.06–1.10) | [72] | |||||||||
| G6PC2 | X | X | X | [29] | ||||||||
| GCKR | X | X | X | X | X | X | 1.06 (1.04–1.08) | [24,29] | ||||
| ADCY5 | X | X | X | X | 1.12 (1.09–1.15) | [29,71,74] | ||||||
| SLC2A2 | X | [29] | ||||||||||
| WFS1 | X | 1.13 (1.07–1.18) | [72] | |||||||||
| ZBED3 | X | 1.08 (1.06–1.11) | [72] | |||||||||
| DGKB/TMEM195 | X | X | 1.06 (1.04–1.08) | [29] | ||||||||
| GCK | X | X | X | 1.07 (1.05–1.10) | [29] | |||||||
| KLF14 | X | 1.07 (1.05–1.10) | [72] | |||||||||
| TP531NP1 | X | 1.06 (1.04–1.09) | [72] | |||||||||
| GLIS3 | X | X | [29] | |||||||||
| TLE4 | X | 1.11 (1.07–1.15) | [72] | |||||||||
| ADRA2A | X | [29] | ||||||||||
| CENTD2/ARAP1 | X | X | 1.14 (1.11–1.17) | [36,72] | ||||||||
| CRY2 | X | [29] | ||||||||||
| FADS1 | X | X | [29] | |||||||||
| MADD | X | X | [29,36] | |||||||||
| MTNR1B | X | X | X | X | 1.09 (1.06–1.12) | [29] | ||||||
| HMGA2 | X | 1.10 (1.07–1.14) | [72] | |||||||||
| HNF1A | X | 1.07 (1.05–1.10) | [72] | |||||||||
| IGF1 | X | X | X | [29] | ||||||||
| C2CD4B | X | [29] | ||||||||||
| PRC1 | X | 1.07 (1.05–1.09) | [72] | |||||||||
| VPS13C/C2CD4A/B | X | X | [36,71] | |||||||||
| ZFAND6 | X | 1.06 (1.04–1.08) | [72] | |||||||||
| GIPR | X | [71] | ||||||||||
|
| ||||||||||||
|
2011
| ||||||||||||
| LARP6 | X | [36] | ||||||||||
| SGSM2 | X | [36] | ||||||||||
| PCSK1 | X | [36] | ||||||||||
Figure 3.

Risk allele frequencies by racial/ethnic group in the United States. Risk allele frequencies for each variant are shown for European Americans (blue), African Americans (yellow), Latinos (purple), Japanese Americans (red), and Native Hawaiians (green). The order of the variants is based on the frequency of the risk allele in European Americans, and is depicted from high to low. Reproduced with permission from [18].
When considering the single nucleotide polymorphisms (SNPs) that have been associated with the diabetes trait, it is important to understand that their designation in a particular part of the chromosome does not necessarily imply a direct link to that portion of DNA. Rather, these sites are frequently in linkage disequilibrium with a region nearby, which is where the causative gene resides. Thus, while a number of different polymorphisms have been identified, the exact molecule affected by each of them is not always known.
The early breakthroughs in understanding the relationship between genes and altered glucose metabolism came about through the study of maturity onset diabetes of the young (MODY), where an autosomal dominant inheritance pattern underlies the development of hyperglycemia [19]. Some of these genes were subsequently demonstrated to also be associated with typical type 2 diabetes, where the inheritance pattern is not as simple [2,3]. In the process of searching for genes linked to altered glucose metabolism, it also became clear that examining glycemia as a dichotomous quantitative trait made it more difficult to find relationships between genes and a phenotype. Thus, adoption of an approach examining glucose traits as continuous variables helped further our understanding of their relationship with gene markers. In fact, as discussed in a little more detail later, this approach has also demonstrated that different genes have dissimilar effects on fasting and postprandial glucose concentrations and that not all genetic associations with increased glucose levels are necessarily associated with type 2 diabetes.
With identification of different genes linked to diabetes, the sum of the affected alleles can be used to calculate a genotype risk score. Interestingly, in the original studies using 16 or 17 SNPs, inclusion of this risk score along with age, sex, family history and risk factors typically associated with diabetes only slightly increased the ability to predict the subsequent development of diabetes [20,21]. With subsequent genome wide association studies (GWAS) and identification of additional markers, the use of a genotype risk score based on 40 diabetes-associated SNPs enhanced the ability to predict diabetes in younger individuals (<50 years of age) in the Framingham cohort [22]. However, whether this approach will prove useful on a broader scale to predict the development of type 2 diabetes will require further study.
Physiological and Pathophysiological Insights Obtained from the Identification of Genes Linked to Glucose Metabolism
Identification of markers linked to genes that previously were not known to be associated with glycemic traits has provided us an opportunity to further explore the impact of these newly identified molecules on physiology and pathophysiology. Given that most of these genetic changes involve alterations in β-cell function, we have gained tremendous new insight into the workings of this critical cell. A few examples of genes linked to type 2 diabetes that impact the β-cell and some of what we have learned based on their identification are described in a subsequent section.
When one considers the identified genes, it is also very apparent that their effects differ and ultimately portend different effects on glucose levels. This observation has become apparent when glycemic traits were examined as continuous variables (fasting, 2-hour glucose levels during an oral glucose tolerance test and HbA1c), rather than simply as a categorical presence or absence of diabetes (Table 1). Unfortunately, as not all subjects who have been included in GWAS had this information available, the relationship between particular SNPs, glucose concentrations and the diagnosis of diabetes is incomplete. However, even with this limitation, as illustrated in Table 1, the genes associated with fasting glucose, 2-hour glucose, and HbA1c differ. Further, within each glucose phenotype, the genetic change associated with an increase in fasting glucose, 2-hour glucose or HbA1c is not necessarily associated with the diagnosis of diabetes. Thus, it appears that variation in the physiology and pathophysiology of glucose metabolism overlaps only partially.
This discrimination of gene effects is perhaps not surprising considering the complexity of the type 2 diabetes disease process and suggests that the interaction of a number of gene variants together with the effects of the environment is needed for hyperglycemia to develop. While a number of genetic alterations linked to type 2 diabetes have been identified and are summarized briefly in the next two sections, we clearly understand that they only explain about 10% of the heritability and further genome sequencing and analysis is required for us to add to the cadre of currently recognized variants.
Insulin Sensitivity and Obesity Genes
The first gene demonstrated to be associated with type 2 diabetes was PPARγ2, a gene for insulin sensitivity in which a Pro12Ala substitution found in Japanese American and Finnish subjects was shown to be associated with decreased receptor activity, lower body mass index and improved insulin sensitivity [23]. Subsequently, the association of this gene with type 2 diabetes was confirmed in three different GWAS analyses [24–26]. Insulin receptor substrate-1 (IRS-1), which is phosphorylated as part of the pathway of insulin action, has also been shown to be linked to diabetes [27]. As this molecule is involved in the insulin signaling cascade, extrapolation to humans of findings of decreased insulin secretion and progressive deterioration in glucose intolerance in mice null for the β-cell insulin receptor [28] would suggest that resistance to insulin action at the level of the β-cell may also be an important component linking IRS-1 to hyperglycemia. Finally, in a recent GWAS variants in GCKR and IGF1 were demonstrated to be associated with insulin sensitivity, although the latter gene has not been shown to be associated with diabetes [29].
While obesity is a critical determinant of insulin resistance, few of the 40 or so gene variants demonstrated to be linked to obesity have been shown to be associated with diabetes [3]. Most work has focused on a variant in FTO, which codes for fat mass and obesity-associated protein. Individuals who are homozygous for the FTO risk allele were about 3 kilograms heavier and had a 67% increased risk of developing obesity than those who did not have the risk allele [30]. However, many, but not all studies, suggest that after accounting for the differences in body mass index, any effect of FTO on diabetes is negated [30,31]. The FTO gene variant has been shown to be associated with increased food intake rather than modulation of energy expenditure [32,33], with the product appearing to be a nuclear demethylase that likely activates genes that have been silenced by DNA methylation [34]. However, the genes activated by this process have not yet been identified. It is also possible, given that the polymorphism in FTO is intronic, that it does not change function but is rather a marker for another gene close by that may involve obesity and diabetes.
β-Cell Genes
By pooling of subjects for GWAS analyses, greater numbers of SNPs have been identified in regions that are linked to abnormalities of the β-cell. These genetic variants appear to affect different components of β-cell function: cellular glucose metabolism, insulin biosynthesis, peptide processing and hormone secretion. Further, some may impact β-cell mass [2,3]; however, this is clearly far more difficult to demonstrate in humans.
Whereas type 2 diabetes is associated with impairments of insulin release and alterations in proinsulin processing, analysis of the impact of these gene variants demonstrates that they do not provide a complete recapitulation of the β-cell defect of type 2 diabetes. A few examples of these “dissociations” are as follows. Loci in TCF7L2, SLC30A8, GIPR and C2CD4B have been shown to be associated with higher proinsulin levels and reduced insulin release [35]. A number of other loci were recently also associated with fasting proinsulin levels but not with other traits related to glucose levels or β-cell function, suggesting that these loci may regulate β-cell peptide release in response to obesity or insulin resistance [36]. Interestingly, one of these variants related to PCSK1, which encodes for the prohormone convertase PC1/3, one of the enzymes responsible for processing proinsulin to insulin in the β-cell secretory granule [36]. Variants in TCF7L2 are also felt to alter the response of the β-cell to the incretins, particularly glucagon like peptide-1 (GLP-1) [37–39]. SNPs related to MTNR1B, FADS1, DGKB and GCK have been demonstrated to be associated with a reduced early insulin response (insulinogenic index) during an OGTT [29]. Finally, as type 2 diabetes is associated with a reduction in β-cell volume, the etiology of which is not always clear, it is not surprising that a number of the gene variants that have been documented to be associated with hyperglycemia are linked to cell cycling and thus would be compatible with a scenario of reduced β-cell survival [40].
For much of the remainder of this review, we focus on four particular variants that have been identified and linked to the β-cell. These will highlight GCK, a gene that is the cause of MODY2 but also associated with type 2 diabetes and hyperinsulinemic hypoglycemia; TCF7L2, a transcription factor that has been shown to be associated with the greatest risk of developing hyperglycemia; SLC30A8, a zinc transporter that is involved in maintaining appropriate amounts of zinc in the β-cell’s secretory granule; and KCNJ11/ABCC8 which is related to the potassium channel that is critical for exocytosis and thereby insulin release from the β-cell and which has also been demonstrated to be linked to syndromes of hypoglycemia and hyperglycemia.
Glucokinase – From MODY to Mainstream Type 2 Diabetes
Glucokinase is the rate-limiting step in glucose metabolism in the β-cell and for many years has been considered a good target for intervention. Mutations of the gene have been associated with hypoglycemia and hyperglycemia, with activating ones producing the former and inactivating the latter.
Diabetes as a result of inactivating mutations in glucokinase presents in a number of ways. Rare homozygous or compound heterozygous mutations result in a severe hyperglycemia that presents in the neonatal period. More commonly, heterozygous mutations result in MODY, an autosomal dominant form of diabetes characterized by mild fasting hyperglycemia. Glucokinase was the first MODY gene to be identified and, to date, over 600 mutations have been described, most in European populations. Given that the condition is typically associated with only mild elevations in fasting glucose, it is frequently not diagnosed. In children and adolescent populations presenting with mild fasting hyperglycemia it has been observed in up to 40% or so of subjects [41], while in overweight or obese adults with fasting hyperglycemia, mutations have been observed in <1% of individuals [42]. The condition is characterized by β-cell dysfunction and is relatively easily treated, frequently not requiring medications. Further, because of the mild changes in glucose, it is not commonly associated with microvascular complications. Despite the well-established link to MODY, it was not until relatively recently and only with a GWAS involving a large number of subjects that an association between glucokinase and type 2 diabetes was demonstrated.
Glucokinase has tissue specific promoters that give rise to the three different sized first exons. Exon 1a is expressed in the islet while exons 1b and 1c are expressed in the liver. A common variant of the promoter in the β-cell occurs at position -30 and has been observed to have a minor allele frequency of 30% in a population in the United Kingdom [43]. We examined the effect of this gene variant on β-cell function in a cohort of Japanese Americans who did not have diabetes and observed that it is associated with a reduced insulinogenic index with no difference in fasting insulin, the latter in keeping with it not affecting insulin sensitivity [44]. This relatively small effect on β-cell function was discerned by studying individuals without diabetes, but would be more difficult to demonstrate in a cohort of subjects with hyperglycemia given that all of them would likely have reduced insulin responses to oral glucose.
The glucokinase activating mutations are rare and associated with hyperinsulinemic hypoglycemia, the severity of which can vary. Given that the activating gene variants frequently do not produce profound hypoglycemia, attempts have been made at producing glucokinase activators as approaches to treat type 2 diabetes. So far these have been unsuccessful, having been noted to be associated initially with improved glucose control and hypoglycemia but ultimately an inability to sustain a lowering of the glucose concentrations [45]. Whether advances in drug development will produce a better outcome on this front will be something to look for in the future.
TCF7L2 – The Type 2 Diabetes Gene Associated With the Greatest Risk
TCF7L2 has been consistently observed to be associated with type 2 diabetes and has in fact been demonstrated to have the strongest effect size of any gene associated with the disease. The gene encodes for the TCF7L2 protein, which is a transcription factor that acts in the Wnt signaling pathway to induce the expression of a number of genes including those for insulin [46], intestinal proglucagon [47], processing enzymes [48] and some involved in β-cell proliferation [49].
Some interesting additional aspects of biology have been elucidated in relationship to TCF7L2. The intronic SNP rs7903146 associated with type 2 diabetes has been shown to be associated with an open chromatin region in the human islet, with the high risk T allele being associated with greater enhancer activity. Open chromatin sites are evolutionary conserved and can be used to identify regions that are bound by regulatory factors. It is likely that this more open chromatin region results in increased transcription of TCF7L2, which is in keeping with the observation that the presence of two copies of this particular allele is linked to a five-fold increase in transcripts in isolated islets from patients with type 2 diabetes compared to controls [37]. Support for this increase in transcription being associated with β-cell dysfunction comes from the finding that overexpression of TCF7L2 is associated with decreased glucose-stimulated insulin release from cultured human islets [37].
β-cell function in individuals with gene variants in TCF7L2 is clearly altered. Those with variants of this gene, and particularly rs7903146, demonstrate a reduced insulin response following glucose ingestion [37,38,50], while the response to intravenous arginine has been shown to be variably impacted [37,38]. It would appear that the decreased β-cell response to oral nutrients is the result of incretin resistance at the level of the β-cell. This conclusion has been reached based on the observation that the magnitude of the responses of the incretin hormones GLP-1 and glucose-dependent insulinotropic peptide (GIP) to an oral stimulus are normal in individuals with one or both copies of the at risk T allele [37–39], while the β-cell response to intravenous GLP-1 is decreased [38]. From a treatment perspective, individuals with TCF7L2 gene variants appear to respond less well to sulfonylureas, but their response to metformin is not affected [51]. Interestingly, the response of the islet alpha cell in terms of glucagon release does not appear to be influenced [37].
Consideration of the interaction between insulin sensitivity and the insulin response is of particular interest when one considers β-cell function in individuals with the rs7903146 variant. The presence of either one or two T alleles is associated with a reduced early insulin response following glucose ingestion. However, it also appears that the presence of the T allele is associated with better insulin sensitivity, with this effect being greater in those with two copies of the high-risk allele [38,50]. When one then accounts for the impact of differences in insulin sensitivity on insulin release, it is apparent that the insulin response may be lower in the CT individuals not as a result of an impairment in β-cell function, but rather because the β-cell is appropriately modulating its response given the difference in tissue responsiveness to insulin [50] (Figure 4). The potential importance of this interesting observation in the rs7903146 variant is underscored by the observation that in the Diabetes Prevention Program, those in the placebo arm who were TT had a greater risk of developing diabetes (hazard ratio 1.81, 95% CI 1.21–2.70) compared to those who were CC, while those who were CT did not exhibit any increased risk [50]. Similar findings regarding the risk of developing diabetes have been made in individuals with the TCF7L2 variant at rs12255372 who participated in the Finnish Diabetes Prevention Study. Individuals with this variant, which is in linkage disequilibrium with rs7903146, who had the TT genotype had a marked increase in the risk of developing diabetes compared to those with GG and GT genotypes [52]. In both these diabetes prevention studies, the lifestyle interventions were able to negate the effect of these high-risk gene variants [50,52].
Figure 4.
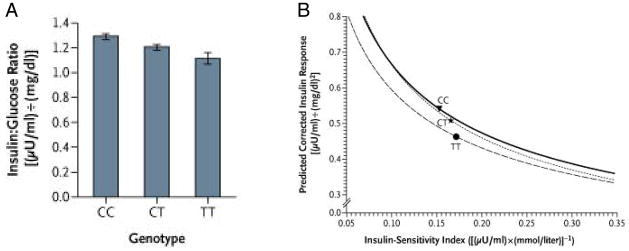
Effect of the rs7903146 gene variant in TCF7L2 on β-cell function measured as the insulinogenic index (insulin:glucose ratio) in subject with impaired glucose tolerance at baseline in the Diabetes Prevention Program. (A) The presence of the T allele is associated with a decrease in the insulin response. (B) β-cell function estimated by the relationship between insulin secretion (the insulin:glucose ratio) and insulin sensitivity (1/fasting insulin). The curves represent the regression line of the logarithm of estimated insulin secretion as a linear function of the logarithm of estimated insulin sensitivity for all participants at baseline, distributed according to the TCF7L2 genotype. The mean for each group is indicated by the point estimate in each curve. Carriers of the T allele have decreased insulin secretion accompanied by an increase in insulin sensitivity. The shift of the curve downward and to the left in TT homozygotes suggests a defect in β-cell function, which is not present in those who are heterozygotes. Reproduced with permission from [50].
In summary, the TCF7L2 gene variant has the strongest effect to increase the risk of developing diabetes, doing so primarily by altering the β-cell’s response to incretin peptides. Given its role as a transcription factor, whether TCF7L2 also has an effect to reduce β-cell mass remains unclear and will require future studies where the relationship between genotype and the size and number of islets/β-cells can be explored in a systematic manner. Despite the lack of an answer to this intriguing question, it is clear that the discovery of the association of this gene with type 2 diabetes has resulted in a greater appreciation of the complexity of the regulation of the β-cell by genes that were never previously considered as candidates to modulate this critical cell.
SLC30A8 – The ZnT-8 Transporter and the β-Cell Secretory Granule
The product of SLC30A8 is ZnT-8, a member of a zinc transporter family that is critical for the maintenance of a normal concentration of this metal ion in the β-cell secretory granule. Zinc in the secretory granule is bound to insulin allowing it to exist as a hexamer within the granule where it is processed from its precursor proinsulin. A variant in this gene results in an R to W change at position 325 and has been strongly associated with type 2 diabetes in a number of GWAS [24–26,53].
The identification of the relationship between this zinc transporter and type 2 diabetes has resulted in a number of studies that subsequently elucidated its function. Overexpression of SLC30A8 in insulinoma cells was associated with increased glucose-stimulated insulin secretion [54]. Subsequently, knockout mice were developed by different groups and provided somewhat different findings [55,56]. A global lack of this transporter did not affect the size or number of islets, but the concentration of zinc in the islet was reduced. Electron microscopy demonstrated abnormal granule morphology with many granules lacking the typical dense core and halo that is associated with insulin hexamer formation and normal processing of proinsulin (Figure 5). Glucose tolerance and insulin secretion findings differed between the various null mice. Some exhibited mild glucose intolerance with decreased insulin secretion in vivo, while others showed no secretory or glucose tolerance changes. Surprisingly, proinsulin processing did not appear to be impacted in these studies of mice with a global deficiency of the transporter. However, more recently, one of these same groups of investigators that had produced global null mice created another mouse that only lacked SLC30A8 in the β-cell. In this instance they were able to demonstrate the presence of atypical β-cell secretory granules, little change in glucose tolerance, reduced insulin secretion, reduced transcripts of the enzymes required to process proinsulin and, in keeping with this latter observation, increased proinsulin levels [57].
Figure 5.
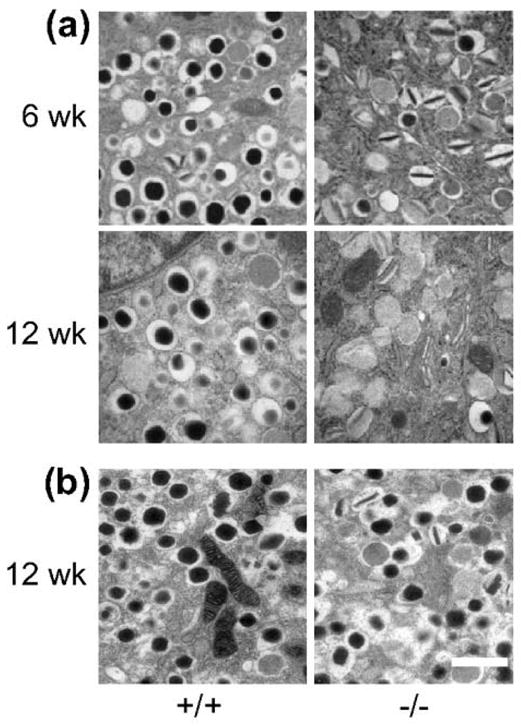
Electron micrographs of isolated islets from ZnT-8 null (−/−)mice and wild-type (+/+) littermate controls at the indicated ages. Two colonies, one from Toronto (a) and the other from London (b) were studied. The granules in the −/− mice show evidence of incomplete dense core formation compatible with lack of the normal hexamer formation, which is more apparent in the mice from Toronto. Scale bar = 1 μm. Reproduced with permission from [55].
The findings in humans are also somewhat discordant. In one study, the response to intravenous but not oral glucose was shown to be reduced in individuals with the at risk genotype [58]. However, this difference disappeared after accounting for differences in insulin sensitivity. In another large study, an increase in proinsulin levels occurred without a simultaneous increase in the insulin response in individuals carrying either one or both of the variant alleles, suggesting that both insulin release and proinsulin processing were abnormal [35]. Quite understandably, there is no information currently available regarding islet morphology in humans with the defective transporter.
Thus, demonstration of a gene variant in the ZnT-8 transporter has resulted in the elucidation of a β-cell functional abnormality that includes a number of features of the type 2 diabetes phenotype. Interestingly, this same gene product is also important in type 1 diabetes, where it has been shown to be an autoantigen [59].
KCNJ11/ABCC8 – From Neonatal Diabetes to More Mainstream Hyperglycemia
These interesting β-cell-related genes have taught us much about type 2 diabetes and provide a good example of the use of genetics to determine the choice of therapeutics. Both gene variants are in the KATP channel that is a critical component of the β-cell’s exocytotic machinery in response to glucose and sulfonylureas. KCNJ11 encodes the Kir6.2 subunit of the KATP channel in the β-cell, while ABCC8 encodes the sulfonylurea receptor 1 (SUR1) subunit of this complex. These two genes are located in close proximity on chromosome 11p15.1, separated by only 4.5 kb [60].
Mutations of KCNJ11 and ABCC8 have been demonstrated to be responsible for two different forms of altered glucose metabolism in neonates/infants. One is the autosomal recessive form of persistent hyperinsulinemic hypoglycemia of infancy (PHHI), which is the result of a loss of function mutation of the complex resulting in channel closure [61]. On the other hand, mutations that result in the channel remaining open even in the presence of glucose result in reduced insulin secretion and permanent neonatal diabetes, a condition not associated with the development of antibodies as found in type 1 diabetes [62,63]. The mutations in the KATP channel causing diabetes resemble the findings in a transgenic mouse model that has reduced ATP sensitivity of the β-cell-specific Kir6.2 channel protein [64]. Interestingly, the nature of the KCNJ11 mutations led to the finding that children with this disorder can be treated successfully with a sulfonylurea, rather than insulin [65].
In older individuals, the E23K variant in KCNJ11 is associated with an approximate odds ratio of developing type 2 diabetes of 1.15 per risk allele. This variant has also taught us that the obvious is not always so, and that knowledge of physiology and genetics are intimately linked. As the KATP channel complex is comprised of the inward rectifying channel Kir6.2 and the sulfonylurea receptor and these genes are located close to each other on chromosome 11p15.1, it is not surprising that the sulfonylurea gene ABCC8 is in perfect linkage disequilibrium with E23K [66]. Interestingly, functional studies also suggest that the variant in ABCC8 may in fact be the stronger of the two mediating the effect on type 2 diabetes risk [67].
Demonstration of the association of the KCNJ11 gene variant with type 2 diabetes required larger sample sizes. Only when three cohorts were combined did it reach statistical significance in a GWAS [24]. The mechanism by which this variant results in the development of hyperglycemia in the polygenic form of diabetes appears to be through an impairment in insulin secretion from an overactive Kir6.2 channel that exhibits decreased sensitivity to ATP [68]. To demonstrate an effect of the E23K variant in KCNJ11 on β-cell function required a sufficient number of subjects and evaluation in individuals without diabetes. In a study of over 500 non-diabetic subjects, it was demonstrated that the insulinogenic index was decreased in those with the E23K variant in KCNJ11 as was the insulin response during the entire OGTT [69]. It is likely that earlier studies failed to demonstrate an association between this variant and decreased insulin release due to inadequate sample sizes or inclusion of individuals in whom glucose tolerance was no longer normal. Finally, while this gene variant is associated with changes in β-cell function, it does not appear to be linked to alterations in glucagon release or insulin sensitivity.
Conclusions
Our understanding of the pathogenesis of type 2 diabetes has been enhanced by advances in genetics, which have identified a number of gene variants associated with this complex disease. Due to the fact that most of these have turned out to be β-cell genes, these advances have provided new insights into the control of this intricate cell, and further underscored its vital role in the development of hyperglycemia. The development of new methods for identifying genes linked to type 2 diabetes and determination of their relationship to the phenotype will hopefully in time provide the opportunity for more personalized medicine allowing us to better predict those who will progress and how best to treat them.
Acknowledgments
This work was supported by the United States Department of Veterans Affairs and National Institutes of Health Grants DK-017047 and DK-007247.
Footnotes
The authors declare that there is no relevant duality of interest.
References
- 1.Kahn SE. The relative contributions of insulin resistance and beta-cell dysfunction to the pathophysiology of type 2 diabetes. Diabetologia. 2003;46:3–19. doi: 10.1007/s00125-002-1009-0. [DOI] [PubMed] [Google Scholar]
- 2.Florez JC. Newly identified loci highlight beta cell dysfunction as a key cause of type 2 diabetes: where are the insulin resistance genes? Diabetologia. 2008;51:1100–1110. doi: 10.1007/s00125-008-1025-9. [DOI] [PubMed] [Google Scholar]
- 3.McCarthy MI. Genomics, type 2 diabetes, and obesity. N Engl J Med. 2010;363:2339–2350. doi: 10.1056/NEJMra0906948. [DOI] [PubMed] [Google Scholar]
- 4.Morton GJ, Cummings DE, Baskin DG, Barsh GS, Schwartz MW. Central nervous system control of food intake and body weight. Nature. 2006;443:289–295. doi: 10.1038/nature05026. [DOI] [PubMed] [Google Scholar]
- 5.Lam TK, Schwartz GJ, Rossetti L. Hypothalamic sensing of fatty acids. Nat Neurosci. 2005;8:579–584. doi: 10.1038/nn1456. [DOI] [PubMed] [Google Scholar]
- 6.Drucker DJ. The biology of incretin hormones. Cell Metab. 2006;3:153–165. doi: 10.1016/j.cmet.2006.01.004. [DOI] [PubMed] [Google Scholar]
- 7.Kahn SE, Hull RL, Utzschneider KM. Mechanisms linking obesity to insulin resistance and type 2 diabetes. Nature. 2006;444:840–846. doi: 10.1038/nature05482. [DOI] [PubMed] [Google Scholar]
- 8.Kahn SE, Prigeon RL, McCulloch DK, et al. Quantification of the relationship between insulin sensitivity and β-cell function in human subjects. Evidence for a hyperbolic function. Diabetes. 1993;42:1663–1672. doi: 10.2337/diab.42.11.1663. [DOI] [PubMed] [Google Scholar]
- 9.Utzschneider KM, Prigeon RL, Faulenbach MV, et al. Oral disposition index predicts the development of future diabetes above and beyond fasting and 2-h glucose levels. Diabetes Care. 2009;32:335–341. doi: 10.2337/dc08-1478. [DOI] [PMC free article] [PubMed] [Google Scholar]
- 10.Jensen CC, Cnop M, Hull RL, Fujimoto WY, Kahn SE American Diabetes Association GENNID Study Group. β-cell function is the major determinant of oral glucose tolerance in four ethnic groups in the United States. Diabetes. 2002;51:2170–2178. doi: 10.2337/diabetes.51.7.2170. [DOI] [PubMed] [Google Scholar]
- 11.Pratley RE, Weyer C. The role of impaired early insulin secretion in the pathogenesis of Type II diabetes mellitus. Diabetologia. 2001;44:929–945. doi: 10.1007/s001250100580. [DOI] [PubMed] [Google Scholar]
- 12.Stancakova A, Javorsky M, Kuulasmaa T, Haffner SM, Kuusisto J, Laakso M. Changes in insulin sensitivity and insulin release in relation to glycemia and glucose tolerance in 6,414 Finnish men. Diabetes. 2009;58:1212–1221. doi: 10.2337/db08-1607. [DOI] [PMC free article] [PubMed] [Google Scholar]
- 13.The Diabetes Prevention Program Research Group. Role of insulin secretion and sensitivity in the evolution of type 2 diabetes in the Diabetes Prevention Program: effects of lifestyle intervention and metformin. Diabetes. 2005;54:2404–2414. doi: 10.2337/diabetes.54.8.2404. [DOI] [PMC free article] [PubMed] [Google Scholar]
- 14.Kahn SE, Lachin JM, Zinman B, et al. Effects of rosiglitazone, glyburide and metformin on β-cell function and insulin sensitivity in ADOPT. Diabetes. 2011;60:1552–1560. doi: 10.2337/db10-1392. [DOI] [PMC free article] [PubMed] [Google Scholar]
- 15.Elbein SC, Hasstedt SJ, Wegner K, Kahn SE. Heritability of pancreatic beta-cell function among nondiabetic members of Caucasian familial type 2 diabetic kindreds. J Clin Endocrinol Metab. 1999;84:1398–1403. doi: 10.1210/jcem.84.4.5604. [DOI] [PubMed] [Google Scholar]
- 16.Bergman RN, Zaccaro DJ, Watanabe RM, et al. Minimal model-based insulin sensitivity has greater heritability and a different genetic basis than homeostasis model assessment or fasting insulin. Diabetes. 2003;52:2168–2174. doi: 10.2337/diabetes.52.8.2168. [DOI] [PubMed] [Google Scholar]
- 17.Cnop M, Vidal J, Hull RL, et al. Progressive loss of β-cell function leads to worsening glucose tolerance in first-degree relatives of subjects with type 2 diabetes. Diabetes Care. 2007;30:677–682. doi: 10.2337/dc06-1834. [DOI] [PubMed] [Google Scholar]
- 18.Waters KM, Stram DO, Hassanein MT, et al. Consistent association of type 2 diabetes risk variants found in Europeans in diverse racial and ethnic groups. PLoS Genet. 2010;6 doi: 10.1371/journal.pgen.1001078. [DOI] [PMC free article] [PubMed] [Google Scholar]
- 19.Fajans SS, Bell GI, Polonsky KS. Molecular mechanisms and clinical pathophysiology of maturity-onset diabetes of the young. N Engl J Med. 2001;345:971–980. doi: 10.1056/NEJMra002168. [DOI] [PubMed] [Google Scholar]
- 20.Meigs JB, Shrader P, Sullivan LM, et al. Genotype score in addition to common risk factors for prediction of type 2 diabetes. N Engl J Med. 2008;359:2208–2219. doi: 10.1056/NEJMoa0804742. [DOI] [PMC free article] [PubMed] [Google Scholar]
- 21.Lyssenko V, Jonsson A, Almgren P, et al. Clinical risk factors, DNA variants, and the development of type 2 diabetes. N Engl J Med. 2008;359:2220–2232. doi: 10.1056/NEJMoa0801869. [DOI] [PubMed] [Google Scholar]
- 22.de Miguel-Yanes JM, Shrader P, Pencina MJ, et al. Genetic risk reclassification for type 2 diabetes by age below or above 50 years using 40 type 2 diabetes risk single nucleotide polymorphisms. Diabetes Care. 2011;34:121–125. doi: 10.2337/dc10-1265. [DOI] [PMC free article] [PubMed] [Google Scholar]
- 23.Deeb SS, Fajas L, Nemoto M, et al. A Pro12Ala substitution in PPARgamma2 associated with decreased receptor activity, lower body mass index and improved insulin sensitivity. Nat Genet. 1998;20:284–287. doi: 10.1038/3099. [DOI] [PubMed] [Google Scholar]
- 24.Diabetes Genetics Initiative of Broad Institute of Harvard and MIT Lund University and Novartis Institutes for BioMedical Research. Genome-wide association analysis identifies loci for type 2 diabetes and triglyceride levels. Science. 2007;316:1331–1336. doi: 10.1126/science.1142358. [DOI] [PubMed] [Google Scholar]
- 25.Zeggini E, Weedon MN, Lindgren CM, et al. Replication of genome-wide association signals in UK samples reveals risk loci for type 2 diabetes. Science. 2007;316:1336–1341. doi: 10.1126/science.1142364. [DOI] [PMC free article] [PubMed] [Google Scholar]
- 26.Scott LJ, Mohlke KL, Bonnycastle LL, et al. A genome-wide association study of type 2 diabetes in Finns detects multiple susceptibility variants. Science. 2007;316:1341–1345. doi: 10.1126/science.1142382. [DOI] [PMC free article] [PubMed] [Google Scholar]
- 27.Rung J, Cauchi S, Albrechtsen A, et al. Genetic variant near IRS1 is associated with type 2 diabetes, insulin resistance and hyperinsulinemia. Nat Genet. 2009;41:1110–1115. doi: 10.1038/ng.443. [DOI] [PubMed] [Google Scholar]
- 28.Kulkarni RN, Bruning JC, Winnay JN, Postic C, Magnuson MA, Kahn CR. Tissue-specific knockout of the insulin receptor in pancreatic beta cells creates an insulin secretory defect similar to that in type 2 diabetes. Cell. 1999;96:329–339. doi: 10.1016/s0092-8674(00)80546-2. [DOI] [PubMed] [Google Scholar]
- 29.Dupuis J, Langenberg C, Prokopenko I, et al. New genetic loci implicated in fasting glucose homeostasis and their impact on type 2 diabetes risk. Nat Genet. 2010;42:105–116. doi: 10.1038/ng.520. [DOI] [PMC free article] [PubMed] [Google Scholar]
- 30.Frayling TM, Timpson NJ, Weedon MN, et al. A common variant in the FTO gene is associated with body mass index and predisposes to childhood and adult obesity. Science. 2007;316:889–894. doi: 10.1126/science.1141634. [DOI] [PMC free article] [PubMed] [Google Scholar]
- 31.Hertel JK, Johansson S, Sonestedt E, et al. FTO, type 2 diabetes, and weight gain throughout adult life: a meta-analysis of 41,504 subjects from the Scandinavian HUNT, MDC, and MPP studies. Diabetes. 2011;60:1637–1644. doi: 10.2337/db10-1340. [DOI] [PMC free article] [PubMed] [Google Scholar]
- 32.Wardle J, Carnell S, Haworth CM, Farooqi IS, O’Rahilly S, Plomin R. Obesity associated genetic variation in FTO is associated with diminished satiety. J Clin Endocrinol Metab. 2008;93:3640–3643. doi: 10.1210/jc.2008-0472. [DOI] [PubMed] [Google Scholar]
- 33.Cecil JE, Tavendale R, Watt P, Hetherington MM, Palmer CN. An obesity-associated FTO gene variant and increased energy intake in children. N Engl J Med. 2008;359:2558–2566. doi: 10.1056/NEJMoa0803839. [DOI] [PubMed] [Google Scholar]
- 34.Gerken T, Girard CA, Tung YC, et al. The obesity-associated FTO gene encodes a 2-oxoglutarate-dependent nucleic acid demethylase. Science. 2007;318:1469–1472. doi: 10.1126/science.1151710. [DOI] [PMC free article] [PubMed] [Google Scholar]
- 35.Ingelsson E, Langenberg C, Hivert MF, et al. Detailed physiologic characterization reveals diverse mechanisms for novel genetic Loci regulating glucose and insulin metabolism in humans. Diabetes. 2010;59:1266–1275. doi: 10.2337/db09-1568. [DOI] [PMC free article] [PubMed] [Google Scholar]
- 36.Strawbridge RJ, Dupuis J, Prokopenko I, et al. Genome-wide association identifies nine common variants associated with fasting proinsulin levels and provides new insights into the pathophysiology of type 2 diabetes. Diabetes. 2011;60:2624–2634. doi: 10.2337/db11-0415. [DOI] [PMC free article] [PubMed] [Google Scholar]
- 37.Lyssenko V, Lupi R, Marchetti P, et al. Mechanisms by which common variants in the TCF7L2 gene increase risk of type 2 diabetes. J Clin Invest. 2007;117:2155–2163. doi: 10.1172/JCI30706. [DOI] [PMC free article] [PubMed] [Google Scholar]
- 38.Schafer SA, Tschritter O, Machicao F, et al. Impaired glucagon-like peptide-1-induced insulin secretion in carriers of transcription factor 7-like 2 (TCF7L2) gene polymorphisms. Diabetologia. 2007;50:2443–2450. doi: 10.1007/s00125-007-0753-6. [DOI] [PMC free article] [PubMed] [Google Scholar]
- 39.Villareal DT, Robertson H, Bell GI, et al. TCF7L2 variant rs7903146 affects the risk of type 2 diabetes by modulating incretin action. Diabetes. 2010;59:479–485. doi: 10.2337/db09-1169. [DOI] [PMC free article] [PubMed] [Google Scholar]
- 40.Jurgens CA, Toukatly MN, Fligner CL, et al. β-cell loss and β-cell apoptosis in human type 2 diabetes are related to islet amyloid deposition. Am J Pathol. 2011;178:2632–2640. doi: 10.1016/j.ajpath.2011.02.036. [DOI] [PMC free article] [PubMed] [Google Scholar]
- 41.Feigerlova E, Pruhova S, Dittertova L, et al. Aetiological heterogeneity of asymptomatic hyperglycaemia in children and adolescents. Eur J Pediatr. 2006;165:446–452. doi: 10.1007/s00431-006-0106-3. [DOI] [PubMed] [Google Scholar]
- 42.Gloyn AL, van de Bunt M, Stratton IM, et al. Prevalence of GCK mutations in individuals screened for fasting hyperglycaemia. Diabetologia. 2009;52:172–174. doi: 10.1007/s00125-008-1188-4. [DOI] [PubMed] [Google Scholar]
- 43.Weedon MN, Frayling TM, Shields B, et al. Genetic regulation of birth weight and fasting glucose by a common polymorphism in the islet cell promoter of the glucokinase gene. Diabetes. 2005;54:576–581. doi: 10.2337/diabetes.54.2.576. [DOI] [PubMed] [Google Scholar]
- 44.Stone LM, Kahn SE, Fujimoto WY, Deeb SS, Porte D., Jr A variation at position -30 of the beta-cell glucokinase gene promoter is associated with reduced beta-cell function in middle-aged Japanese-American men. Diabetes. 1996;45:422–428. doi: 10.2337/diab.45.4.422. [DOI] [PubMed] [Google Scholar]
- 45.Meininger GE, Scott R, Alba M, et al. Effects of MK-0941, a novel glucokinase activator, on glycemic control in insulin-treated patients with type 2 diabetes. Diabetes Care. 2011;34:2560–2566. doi: 10.2337/dc11-1200. [DOI] [PMC free article] [PubMed] [Google Scholar]
- 46.Loder MK, da Silva Xavier G, McDonald A, Rutter GA. TCF7L2 controls insulin gene expression and insulin secretion in mature pancreatic beta-cells. Biochem Soc Trans. 2008;36:357–359. doi: 10.1042/BST0360357. [DOI] [PubMed] [Google Scholar]
- 47.Yi F, Brubaker PL, Jin T. TCF-4 mediates cell type-specific regulation of proglucagon gene expression by beta-catenin and glycogen synthase kinase-3beta. J Biol Chem. 2005;280:1457–1464. doi: 10.1074/jbc.M411487200. [DOI] [PubMed] [Google Scholar]
- 48.Loos RJ, Franks PW, Francis RW, et al. TCF7L2 polymorphisms modulate proinsulin levels and β-cell function in a British Europid population. Diabetes. 2007;56:1943–1947. doi: 10.2337/db07-0055. [DOI] [PMC free article] [PubMed] [Google Scholar]
- 49.Rulifson IC, Karnik SK, Heiser PW, et al. Wnt signaling regulates pancreatic beta cell proliferation. Proc Natl Acad Sci U S A. 2007;104:6247–6252. doi: 10.1073/pnas.0701509104. [DOI] [PMC free article] [PubMed] [Google Scholar]
- 50.Florez JC, Jablonski KA, Bayley N, et al. TCF7L2 polymorphisms and progression to diabetes in the Diabetes Prevention Program. N Engl J Med. 2006;355:241–250. doi: 10.1056/NEJMoa062418. [DOI] [PMC free article] [PubMed] [Google Scholar]
- 51.Pearson ER, Donnelly LA, Kimber C, et al. Variation in TCF7L2 influences therapeutic response to sulfonylureas: a GoDARTs study. Diabetes. 2007;56:2178–2182. doi: 10.2337/db07-0440. [DOI] [PubMed] [Google Scholar]
- 52.Wang J, Kuusisto J, Vanttinen M, et al. Variants of transcription factor 7-like 2 (TCF7L2) gene predict conversion to type 2 diabetes in the Finnish Diabetes Prevention Study and are associated with impaired glucose regulation and impaired insulin secretion. Diabetologia. 2007;50:1192–1200. doi: 10.1007/s00125-007-0656-6. [DOI] [PubMed] [Google Scholar]
- 53.Sladek R, Rocheleau G, Rung J, et al. A genome-wide association study identifies novel risk loci for type 2 diabetes. Nature. 2007;445:881–885. doi: 10.1038/nature05616. [DOI] [PubMed] [Google Scholar]
- 54.Chimienti F, Devergnas S, Pattou F, et al. In vivo expression and functional characterization of the zinc transporter ZnT8 in glucose-induced insulin secretion. J Cell Sci. 2006;119:4199–4206. doi: 10.1242/jcs.03164. [DOI] [PubMed] [Google Scholar]
- 55.Nicolson TJ, Bellomo EA, Wijesekara N, et al. Insulin storage and glucose homeostasis in mice null for the granule zinc transporter ZnT8 and studies of the type 2 diabetes-associated variants. Diabetes. 2009;58:2070–2083. doi: 10.2337/db09-0551. [DOI] [PMC free article] [PubMed] [Google Scholar]
- 56.Pound LD, Sarkar SA, Benninger RK, et al. Deletion of the mouse Slc30a8 gene encoding zinc transporter-8 results in impaired insulin secretion. Biochem J. 2009;421:371–376. doi: 10.1042/BJ20090530. [DOI] [PMC free article] [PubMed] [Google Scholar]
- 57.Wijesekara N, Dai FF, Hardy AB, et al. Beta cell-specific Znt8 deletion in mice causes marked defects in insulin processing, crystallisation and secretion. Diabetologia. 2010;53:1656–1668. doi: 10.1007/s00125-010-1733-9. [DOI] [PMC free article] [PubMed] [Google Scholar]
- 58.Staiger H, Machicao F, Stefan N, et al. Polymorphisms within novel risk loci for type 2 diabetes determine beta-cell function. PLoS ONE. 2007;2:e832. doi: 10.1371/journal.pone.0000832. [DOI] [PMC free article] [PubMed] [Google Scholar]
- 59.Wenzlau JM, Juhl K, Yu L, et al. The cation efflux transporter ZnT8 (Slc30A8) is a major autoantigen in human type 1 diabetes. Proc Natl Acad Sci U S A. 2007;104:17040–17045. doi: 10.1073/pnas.0705894104. [DOI] [PMC free article] [PubMed] [Google Scholar]
- 60.Inagaki N, Gonoi T, Clement JPt, et al. Reconstitution of IKATP: an inward rectifier subunit plus the sulfonylurea receptor. Science. 1995;270:1166–1170. doi: 10.1126/science.270.5239.1166. [DOI] [PubMed] [Google Scholar]
- 61.Aguilar-Bryan L, Bryan J. Molecular biology of adenosine triphosphate-sensitive potassium channels. Endocr Rev. 1999;20:101–135. doi: 10.1210/edrv.20.2.0361. [DOI] [PubMed] [Google Scholar]
- 62.Gloyn AL, Pearson ER, Antcliff JF, et al. Activating mutations in the gene encoding the ATP-sensitive potassium-channel subunit Kir6. 2 and permanent neonatal diabetes. N Engl J Med. 2004;350:1838–1849. doi: 10.1056/NEJMoa032922. [DOI] [PubMed] [Google Scholar]
- 63.Sagen JV, Raeder H, Hathout E, et al. Permanent neonatal diabetes due to mutations in KCNJ11 encoding Kir6. 2: patient characteristics and initial response to sulfonylurea therapy. Diabetes. 2004;53:2713–2718. doi: 10.2337/diabetes.53.10.2713. [DOI] [PubMed] [Google Scholar]
- 64.Koster JC, Marshall BA, Ensor N, Corbett JA, Nichols CG. Targeted overactivity of beta cell K(ATP) channels induces profound neonatal diabetes. Cell. 2000;100:645–654. doi: 10.1016/s0092-8674(00)80701-1. [DOI] [PubMed] [Google Scholar]
- 65.Pearson ER, Flechtner I, Njolstad PR, et al. Switching from insulin to oral sulfonylureas in patients with diabetes due to Kir6. 2 mutations. N Engl J Med. 2006;355:467–477. doi: 10.1056/NEJMoa061759. [DOI] [PubMed] [Google Scholar]
- 66.Gloyn AL, Weedon MN, Owen KR, et al. Large-scale association studies of variants in genes encoding the pancreatic beta-cell KATP channel subunits Kir6. 2 (KCNJ11) and SUR1 (ABCC8) confirm that the KCNJ11 E23K variant is associated with type 2 diabetes. Diabetes. 2003;52:568–572. doi: 10.2337/diabetes.52.2.568. [DOI] [PubMed] [Google Scholar]
- 67.Hamming KS, Soliman D, Matemisz LC, et al. Coexpression of the type 2 diabetes susceptibility gene variants KCNJ11 E23K and ABCC8 S1369A alter the ATP and sulfonylurea sensitivities of the ATP-sensitive K(+) channel. Diabetes. 2009;58:2419–2424. doi: 10.2337/db09-0143. [DOI] [PMC free article] [PubMed] [Google Scholar]
- 68.Schwanstecher C, Meyer U, Schwanstecher M. K(IR)6. 2 polymorphism predisposes to type 2 diabetes by inducing overactivity of pancreatic beta-cell ATP-sensitive K(+) channels. Diabetes. 2002;51:875–879. doi: 10.2337/diabetes.51.3.875. [DOI] [PubMed] [Google Scholar]
- 69.Nielsen EM, Hansen L, Carstensen B, et al. The E23K variant of Kir6. 2 associates with impaired post-OGTT serum insulin response and increased risk of type 2 diabetes. Diabetes. 2003;52:573–577. doi: 10.2337/diabetes.52.2.573. [DOI] [PubMed] [Google Scholar]
- 70.Zeggini E, Scott LJ, Saxena R, et al. Meta-analysis of genome-wide association data and large-scale replication identifies additional susceptibility loci for type 2 diabetes. Nat Genet. 2008;40:638–645. doi: 10.1038/ng.120. [DOI] [PMC free article] [PubMed] [Google Scholar]
- 71.Saxena R, Hivert MF, Langenberg C, et al. Genetic variation in GIPR influences the glucose and insulin responses to an oral glucose challenge. Nat Genet. 2010;42:142–148. doi: 10.1038/ng.521. [DOI] [PMC free article] [PubMed] [Google Scholar]
- 72.Voight BF, Scott LJ, Steinthorsdottir V, et al. Twelve type 2 diabetes susceptibility loci identified through large-scale association analysis. Nat Genet. 2010;42:579–589. doi: 10.1038/ng.609. [DOI] [PMC free article] [PubMed] [Google Scholar]
- 73.Yasuda K, Miyake K, Horikawa Y, et al. Variants in KCNQ1 are associated with susceptibility to type 2 diabetes mellitus. Nat Genet. 2008;40:1092–1097. doi: 10.1038/ng.207. [DOI] [PubMed] [Google Scholar]
- 74.Orho-Melander M, Melander O, Guiducci C, et al. Common missense variant in the glucokinase regulatory protein gene is associated with increased plasma triglyceride and C-reactive protein but lower fasting glucose concentrations. Diabetes. 2008;57:3112–3121. doi: 10.2337/db08-0516. [DOI] [PMC free article] [PubMed] [Google Scholar]