

SUMMARY
Understanding mechanisms that orchestrate cell behavior into appropriately patterned tissues and organs within the organism is an essential element of preventing, detecting and treating cancer. Bioelectric signals (resting transmembrane voltage potential gradients in all cells) underlie an important and broadly conserved set of control mechanisms that regulate pattern formation. We tested the role of transmembrane potential in tumorigenesis mediated by canonical oncogenes in Xenopus laevis. Depolarized membrane potential (Vmem) was a characteristic of induced tumor-like structures (ITLSs) generated by overexpression of Gli1, KrasG12D, Xrel3 or p53Trp248. This bioelectric signature was also present in precursor ITLS sites. Vmem is a bioelectric marker that reveals ITLSs before they become histologically and morphologically apparent. Moreover, voltage was functionally important: overexpression of hyperpolarizing ion transporters caused a return to normal Vmem and significantly reduced ITLS formation in vivo. To characterize the molecular mechanism by which Vmem change regulates ITLS phenotypes, we performed a suppression screen. Vmem hyperpolarization was transduced into downstream events via Vmem-regulated activity of SLC5A8, a sodium-butyrate exchanger previously implicated in human cancer. These data indicate that butyrate, a histone deacetylase (HDAC) inhibitor, might be responsible for transcriptional events that mediate suppression of ITLSs by hyperpolarization. Vmem is a convenient cellular parameter by which tumors induced by human oncogenes can be detected in vivo and represents a new diagnostic modality. Moreover, control of resting membrane potential is functionally involved in the process by which oncogene-bearing cells depart from normal morphogenesis programs to form tumors. Modulation of Vmem levels is a novel and promising strategy for tumor normalization.
INTRODUCTION
Resting voltage potential in non-excitable cells is an important regulator of cellular properties such as proliferation, migration and shape (Blackiston et al., 2009; Sundelacruz et al., 2009). Moreover, endogenous bioelectric signals (patterns of resting potential in all tissues) encode a set of morphogenetic cues that provide patterning control during regeneration (Levin, 2007; Levin, 2009), development (Adams, 2008; Levin, 2012a) and wound healing (Nuccitelli, 2003; McCaig et al., 2005; McCaig et al., 2009). Thus, ion flows and the resulting voltage gradients are highly relevant to the understanding of cancer as a developmental disorder and to the prediction and control of neoplastic cell behaviors (Rubin, 1985; Huang et al., 2009; Levin, 2012b).
A relationship between cancer and the bioelectric properties of host tissue was suggested long ago on the basis of physiological measurements (Burr et al., 1938; Burr, 1940; Cone, 1971). Interestingly, membrane voltage (Vmem) analysis in many different mammalian cell types reveals that proliferative potential is correlated with unique ranges of Vmem: quiescent cells tend to be hyperpolarized, whereas highly plastic cells such as embryonic cells, adult stem cells and tumors cells are depolarized (Binggeli and Weinstein, 1986; Levin, 2007). The relationship between resting potential and proliferative plasticity is not merely correlative: Vmem is a causal factor in the control of proliferation and differentiation. For example, prolonged depolarization induces mature central nervous system neurons to re-enter mitosis and causes fibroblasts to overproliferate (Cone, 1971; Cone and Tongier, 1971), and also prevents stem cells from differentiating (Sundelacruz et al., 2008).
Modern work using molecular genetics methods has linked several ion channel and pump genes to cancer (Saito et al., 1998; Pardo et al., 1999; Pei et al., 2003; Kunzelmann, 2005; Stühmer et al., 2006; Brackenbury et al., 2008; Becchetti, 2011), and small molecule compounds targeting ion channels have been suggested as candidates for cancer drugs (Arcangeli et al., 2009; Arcangeli et al., 2012). Not surprisingly, the normal expression patterns of a number of ion channels are altered in tumors (Schönherr, 2005; Fiske et al., 2006), and ion channel loci are starting to be identified as oncogenes in microarray studies of several cancer types (Pei et al., 2003; Onkal and Djamgoz, 2009; House et al., 2010; Roepke et al., 2010). Thus, an understanding of the roles of ion flow in cancer initiation and tumor progression is of high importance for basic biology and medicine.
During the early stages of tumor formation, Vmem is a key regulator of the cell cycle and determines the proliferative state of many different kinds of cells (Blackiston et al., 2009). Depolarization of a broadly distributed cell population in the Xenopus tadpole leads to upregulation of Sox10 and SLUG and induces a phenotype similar to metastatic melanoma: the pigment cells (melanocytes) overproliferate, acquire a highly arborized abnormal cell morphology and extensively colonize soft tissues in a manner dependent on matrix metalloproteases (Morokuma et al., 2008; Blackiston et al., 2011). Importantly, this phenotype is completely independent of which ion channel is used to control Vmem. The same effect was obtained (or rescued) by using the appropriate combination of several chloride, potassium, sodium or proton translocators (Morokuma et al., 2008; Blackiston et al., 2011).
TRANSLATIONAL IMPACT.
Clinical issue
Cancer is a major world-wide health problem for which definitive solutions remain elusive. Transmembrane voltage gradients in non-excitable somatic cells are important regulators of growth and form, and thus are potential candidates for altering developmental signaling whose dysregulation leads to cancer. Although specific ion channels have been implicated in carcinogenesis and shown to affect cell behavior in culture, the role of voltage gradients has not been examined in tumorigenesis in vivo. Could non-invasive methods of tracking bioelectrical cell states facilitate detection of tumors and their margins? Moreover, might targeted modulation of resting potential be used to suppress tumor formation by canonical oncogenes?
Results
In this paper, the authors induced tumors in the Xenopus laevis tadpole by misexpressing different oncogenes associated with human cancers. Tumor-like structures were clearly distinguishable by a unique physiological signature conferred by their depolarization, which could be visualized using a fluorescent voltage reporter dye. Remarkably, artificial hyperpolarization of oncogene-bearing cells via a variety of ion channels significantly reduced the formation of tumors in vivo. This effect is probably mediated by regulation of the cancer-linked butyrate transporter by transmembrane voltage.
Implications and future directions
These data implicate bioelectric signaling in the induction of tumors by oncogenes, revealing a new layer of regulation in cancer biology. The functional data highlight the importance of resting potential as the mediator of developmental signals that normally orchestrate cell activity towards the anatomical needs of the host, and show that a disruption of these gradients is a component of tumorigenesis. The ability to detect such tumors and their edges using a non-invasive (optical sensing) approach suggests exciting possibilities for a new detection and diagnostic modality. Most importantly, the ability of pharmacological or molecular-genetic methods of hyperpolarizing cells and thus preventing tumor formation despite strong oncogene presence points to a new class of therapies for suppressing tumors based on ion channel drugs that are already approved for human use.
Thus, several major open questions face this field today. First: how do the actions of ion channels and pumps in vivo, which normally work to establish and maintain anatomical structures, regulate the development of tumors? Second: how do these physiological gradients interact with the pathways activated during oncogene-induced carcinogenesis? Finally: how can bioelectric cues be harnessed for better prediction of tumor incidence and normalization of such abnormal growth? A better understanding of ionic controls of growth and form will have important implications for the development of strategies for prevention, detection and normalization that capitalize on bioelectric control points. Motivated by the known role of bioelectrical signals in morphogenesis and the possibility that cancer reveals a loss of morphogenetic control, we explored resting potential (Vmem) in non-excitable cells as a molecularly tractable parameter by which tumorigenesis can be detected and controlled.
Xenopus laevis is widely used as a model system due to its rapid development, accessibility and tractability for molecular, electrophysiological and optical studies. Even more than the zebrafish model, which has recently gained popularity for studies of cancer mechanisms (Jing and Zon, 2011), Xenopus facilitates biophysical and physiological approaches to understanding developmental signals (Adams and Levin, 2012a). The frog model also features well-characterized oncogenes (Gli1, Xrel3 and KrasG12D) and a mutant tumor suppressor (p53Trp248), whose mRNAs have been used to induce tumor-like structures in Xenopus or zebrafish embryos (Dahmane et al., 1997; Wallingford et al., 1997; Yang et al., 1998; Le et al., 2007). These induced tumor-like structures (hereafter referred to as ITLS) are caused by the same human oncogenes that are strongly associated with human tumors. Such growths are, strictly speaking, ‘tumors’, but because the amphibian system does not recapitulate the full complexity of the human tumor, we refer to them as tumor-like. ITLSs result from interference with canonical signaling pathways altered in human cancer, i.e. the Hedgehog/Patched pathway (Gli1), NF-κB transcription factor-dependent signal transduction pathway (Xrel3), RAS signaling pathway (KrasG12D) and p53 pathway (p53Trp248). Thus, ITLSs are relevant to several cancers such as melanoma, leukemia, lung cancer and rhabdomysarcoma (Stratton et al., 1989; Gilmore et al., 2004; McNulty et al., 2004; Clement et al., 2007).
Here we show that ITLSs induced by canonical oncogenes in vivo uniquely exhibit depolarized Vmem. This bioelectric signature is also present in precursor ITLS sites, allowing the use of Vmem as a bioelectric marker to predict the occurrence of ITLS foci before they become histologically and morphologically apparent. Moreover, we show that the partially depolarized nature of prospective ITLS sites is causal: partial rescue of ITLS formation is achieved by the overexpression of hyperpolarizing channels. Importantly, the effect is specific to changes in Vmem (not restricted to the function of one ion species or a particular channel protein) and is transduced into genetic responses via the Vmem-guided activities of SLC5A8 (sodium-butyrate exchanger). We suggest that the HDAC-inhibitory nature of butyrate is responsible for events contributing to suppression of ITLSs at the transcriptional level. These data indicate that Vmem is an essential cellular parameter by which ITLSs caused by genetic elements of high relevance to human cancer can be detected and controlled.
RESULTS
Canonical oncogenes and mutant tumor suppressor result in ITLSs in Xenopus laevis embryos
To establish an in vivo model in which to investigate the role of bioelectric cues in regulating cell behavior during tumorigenesis, we used Xrel3, Gli1, p53Trp248 and KrasG12D, which are gene products of high relevance to melanoma, leukemia, lung cancer and rhabdomyosarcoma that induce tumor-like structures. Microinjection of mRNAs encoding these genes into a single blastomere resulted in clearly identifiable ITLSs (and no other developmental defects) in as many as 50% of treated embryos (Fig. 1). These ITLSs resembled those observed and previously characterized in published studies, which showed that highly proliferative cells lacking differentiation (Wallingford et al., 1997) constitute such ITLSs (Dahmane et al., 1997) and that transplantation of oncogene-expressing tissue onto an unperturbed host results in formation of ITLSs (Le et al., 2007). Furthermore, we confirmed an additional hallmark property of ITLSs by demonstrating their ability to attract vasculature within ITLS. Immunohistochemistry with anti-H3B-p antibody on unperturbed control sections (Fig. 2A) and cross-sections of ITLS (Fig. 2B) revealed that tumors contain a significantly higher fraction of mitotic cells than do cells in ITLS-free regions of the same section or in untreated embryos (n=9 per treatment, P<0.05) (Fig. 2C). Cross-sections also revealed that ITLSs are not only ectodermal (Fig. 2E, red arrowhead) but can also be formed in underlying deep tissues (Fig. 2E, red circular traces). Demonstrating the ability of ITLS to attract vasculature, networks of blood vessels around Xrel3 ITLSs were observed in stage 45 embryos with tumors (Fig. 2F).
Fig. 1.
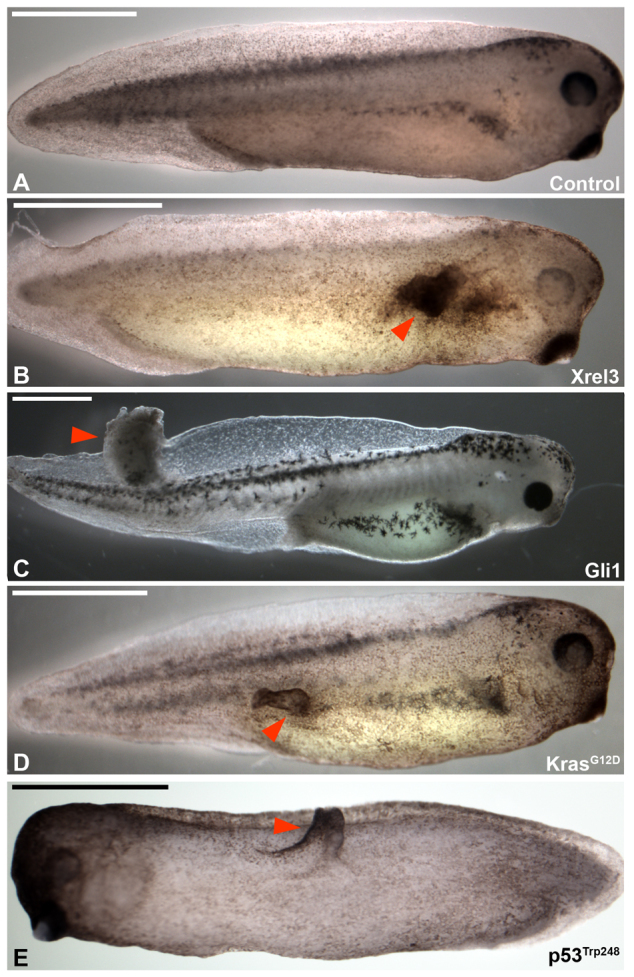
Overexpression of canonical oncogenes or a mutant tumor suppressor results in the formation of ITLSs in Xenopus laevis embryos. (A) Unperturbed embryo showing normal development at stage 34. (B–E) Embryos showing the presence of ITLS (red arrowheads). To generate ITLSs, 16-cell stage embryos were injected with 0.5–2 ng of Xrel3, Gli1, KrasG12D or p53Trp248 mRNA into a single blastomere. Injected embryos were raised to tail-bud stages (∼28–40), scored for the presence of ITLSs and imaged using brightfield microscopy. Scale bars: 1 mm.
Fig. 2.

Induced foci exhibit hallmark characteristics of tumors. (A,B) To analyze proliferation in ITLS regions, embryos were fixed, embedded in agarose, sectioned (as shown in the schematic), and processed for immunohistochemistry with anti-H3B-P antibody: (A) Control section and (B) section through ITLS showing signals of H3B-P-positive cells. The regions traced in white dashes and denoted by ‘Do’ is a region dorsal to the gut; the region traced in yellow dashes is an ITLS region. (C) Quantification of H3B-P signals per pixel area showed significantly higher numbers of proliferative cells in ITLS regions than in dorsal-to-the-gut regions of the same sections or control embryo sections (n=9); **P<0.01, ***P<0.001 (one-way ANOVA, Bonferroni post hoc analysis). (D) Unperturbed embryo sectioned through the red axis (see schematic); (E) Xrel3-induced ITLS sectioned through the same axis. High-magnification analysis reveals that ITLS (red arrowheads) induced by our method can affect not only the epidermis but can also form in internal tissues of the animal (red circular traces). (F) Xrel3-induced ITLS in the tail region showing the ability to attract vasculature (blue arrowheads), as would most real tumors. Red arrowheads represent normal tail vasculature. Scale bars: 100 μm (A,B,D,E); 500 μm (F).
ITLSs exhibit a unique depolarized Vmem signature
We next examined whether ITLSs (Fig. 3A, yellow circular trace) exhibit a unique Vmem. Embryos with ITLSs were immobilized with N-benzyl-p-toluene sulfonamide (a direct myosin inhibitor that is preferable in this case to the use of common ion channel-targeting anesthetics) and imaged in a solution of DiBAC4[3], a fluorescent reporter of Vmem that works well in vivo to reveal gradients of transmembrane potential (Adams et al., 2006; Adams et al., 2007; Oviedo et al., 2008). For these experiments, mRNA injections targeted the outer layers of the embryo to facilitate Vmem imaging through pigmented epidermis. This non-invasive imaging technique revealed that Xrel3 ITLSs are clearly demarcated from surrounding tissue by a depolarized transmembrane potential (Fig. 3B,C, yellow circular traces). The unique depolarization relative to surrounding tissue was also observed for Gli1 and KrasG12D ITLSs (data not shown), suggesting Vmem as a marker of ITLSs of diverse genetic origin.
Fig. 3.
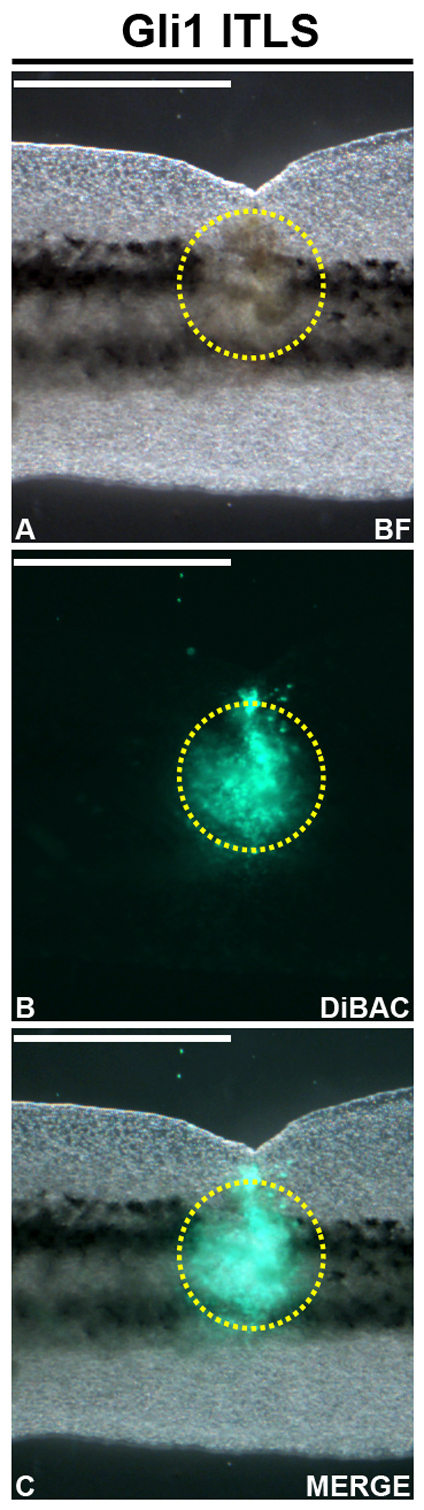
ITLSs exhibit depolarized Vmem. (A) Brightfield image of a Gli1-induced ITLS (outlined in yellow dashes) on the tail of a stage 40 embryo. (B) Depolarization of ITLSs regions was observed when the same embryo was imaged in DiBAC4(3), a fluorescent reporter of Vmem, using the FITC filter set of a fluorescent microscope. (C) Overlay of brightfield and DiBAC4(3) images showing a depolarized Vmem signature exclusive to the ITLS region. Scale bars: 1 mm.
Depolarized Vmem predicts the formation of ITLSs
We next asked whether the observed depolarization indicates an ITLS precursor site and predicts the development of morphologically apparent ITLSs later in development. We collected Xrel3-, Gli1- and KrasG12D-injected embryos at the neurula stage (stage 15), before ITLSs are directly apparent. Embryos were then imaged using CC2-DMPE and DiBAC4(3), and grouped into two categories based on the presence (or absence of) discrete depolarized area. Several days later, the stage 35 tadpoles in both categories were scored for the presence of ITLSs (Fig. 4A). To assess the effectiveness of depolarization in predicting ITLS formation, data collected were processed to calculate predictive metrics including true or false positives, true or false negatives, test sensitivity and test specificity (Table 1).
Fig. 4.

Depolarization predicts the formation of Xrel3 ITLSs. (A) Experimental design for predictive testing: 0.5 ng of Xrel3 mRNA was injected into a single blastomere of 16-cell stage embryos; injected embryos were raised to stage 15 and imaged with the voltage-sensitive dye pair DiBAC4(3) and CC2-DMPE using fluorescent confocal microscopy; imaged embryos were sorted into two categories based on the presence (or lack of) depolarized foci; and embryos were raised to stage 35 and scored for ITLSs to assess success rate of depolarization as a predictor of ITLS. Data were used to calculate true positives (cases in which depolarized signal was present and an ITLS formed), false positives (cases in which depolarized signal was present but no ITLS formed), false negatives (ITLS formation that was not preceded by depolarized signal), and sensitivity and specificity values (calculated as described in Materials and Methods). (B) Images showing positive outcome of predictive testing. At stage 15 (left), when there are still no histological or morphological signs of neoplasm, Xrel3-injected embryos show a depolarized area (red arrowhead), which later forms an ITLS at stage 34 (right). Depolarization along the neural tube (yellow arrowhead) is a bioelectric signature of neurulation (Vandenberg et al., 2011). Scale bars: 150 μm (left); 1 mm (right). (C) Depolarized foci were present in a significantly higher number of embryos injected with the oncogene mRNA (χ2 test compared with uninjected embryos, *P<0.001), >51% of which (red bar) formed morphologically apparent ITLSs by stage 35 (χ2 test compared with uninjected embryos, #P<0.001). Although depolarization was present in a small percentage of embryos injected with control mRNAs, no ITLSs were observed.
Table 1.
ITLS predictive parameters of depolarized foci
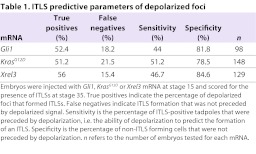
Depolarized foci (Fig. 4B left; 4C) were present in 19.4% of Xrel3-injected embryos (56% of which formed ITLSs (Fig. 4B right; 4C); in 29.5% of Gli1-injected embryos (52.4% of which formed ITLSs); and in 25.3% of KrasG12D-injected embryos (51.2% of which formed ITLSs) (Table 1). Although a small percentage of embryos displayed depolarized foci, no ITLSs were observed in uninjected controls or in those injected with control mRNAs encoding fluorescent proteins (tdTomato or GFP3) (Zernicka-Goetz et al., 1996; Waldner et al., 2009) (Fig. 4C). Depolarization of prospective tumor sites was further confirmed using electrophysiology: Xrel3-expressing cells, relative to unperturbed cells, are depolarized by an average of approximately −11 mv (n=5, P<0.001) (supplementary material Fig. S1). Taken together, these data indicate that relative depolarization is a bioelectrical signature of pre-neoplastic cells. Given that the usual conversion rate of a precancerous lesion into cancer is about 0.1–1% per year (e.g. actinic keratosis becoming squamous cell carcinoma), the ∼45–50% conversion rate revealed by these data show that the depolarization marker can be used as a reliable indicator of ITLS appearance.
Hyperpolarization suppresses the formation of ITLSs
We next performed functional experiments to test the hypothesis that forced hyperpolarization would negate the effects of depolarization and thus suppress tumorigenesis. We co-injected a hyperpolarizing ion channel and Xrel3 into the same blastomere of 16-cell stage embryos. Here, Xrel3 was fused with tdTomato (bright red fluorescent protein) to allow spatial detection of the areas that had received oncogene injections (Fig. 5A) and indicate the presence of the oncogene’s protein product (Fig. 5Ai, Aii; Fig. 5B). We used well-characterized hyperpolarizing ion channel mRNAs, including an inward rectifying potassium channel (Kir4.1) (Marcus et al., 2002; Aw et al., 2008; Blackiston et al., 2011) and a constitutively open, glycine-gated chloride channel (GlyR-F99A) (Vafa et al., 1999; Blackiston et al., 2011), both of which have been used in such ‘rescue’ studies and shown to be effective in controlling developmental voltage gradients in Xenopus in such rescue strategies. The use of two very different ion translocator constructs (Cl− and K+) allowed us to determine whether any ITLS suppression effect was due to changes in Vmem per se, or to ion-specific or channel-specific properties.
Fig. 5.

Hyperpolarization suppresses the formation of Xrel3 ITLSs. (A) To visualize and track ITLSs, mRNA encoding a fusion construct of Xrel3 and tdTomato was injected into a single blastomere of 16-cell stage embryos. (Ai,Aii) ITLSs resulting from Xrel3-2A-tdTomato injections were highly fluorescent when visualized under a TRITC filter set. (Aiii) Overlay of brightfield (BF) and TRITC images shows colocalization of ITLS and red fluorescent signal, confirming that foci of oncogene expression are the cells that form ITLS. (B) To test whether hyperpolarization (driving depolarized Vmem back to the normal state) suppresses ITLS formation, a constitutively open, glycine gate chloride channel (GlyRF99A-GFP3) was co-injected with Xrel3-2A-tdTomato into a single blastomere of a 16-cell stage embryo. (Bi) Morphologically apparent ITLSs were often missing from these embryos. (Bii,Biii) Nevertheless, there was expression of Xrel3 protein evidenced by the presence of tdTomato signal. (Biv,Bv) Expression of hyperpolarizing channel protein (GlyRF99A-GFP3) was driven in the same region (Bvi) as Xrel3-2A-tdTomato expressing cells. (C) Fold change in ITLS for embryos co-injected with Xrel3 plus channel mRNA compared with Xrel3-only injected embryos. Xrel3-only injected embryos with ITLS have a ratio of one; ratio values below and above one represent fewer and more embryos with ITLS, respectively. Two very different hyperpolarizing channels (based on Cl− and K+) both resulted in suppression of ITLSs, demonstrating that this effect is due to change in Vmem and not tied to one channel protein or one ion. Fold decreases of 1.54 and 1.62 in the number of embryos were observed for Kir4.1- (K+ hyperpolarizing channel) and GlyRF99A-injected embryos, respectively (one sample t-test, **P<0.01 compared with a normalized value of 1 that represents ITLS incidence in Xrel3-only injected embryos). The number of embryos with ITLS was also increased (1.4-fold) by further depolarizing Xrel3-only injected embryos via ivermectin (one sample t-test, *P=0.05 compared with Xrel3-only injected embryos). Scale bars: 1 mm
Whereas the Kir4.1 channel hyperpolarizes cells of an embryo in 0.1× Marc’s modified Ringers (MMR) (facilitating efflux of positive K+ ions), GlyR-F99A does so when 0.1× MMR is supplemented with high levels of chloride. The 0.1× MMR medium contains 10 mM of Cl− compared with ∼60 mM concentration of the intracellular environment. By introducing GlyRF99A and raising the extracellular concentration of Cl− to 70 mM, we were able to force inward flow of Cl−, thus hyperpolarizing cells, as previously described (Blackiston et al., 2011). Hyperpolarization (relative to surrounding tissue) by GlyRF99A + 70 mM Cl− was detected using CC2-DMPE (a Vmem-sensitive dye) imaging (supplementary material Fig. S2) as previously described (Blackiston et al., 2011; Adams and Levin, 2012c; Adams and Levin, 2012b). Hyperpolarization was further quantitatively confirmed using electrophysiological impalement. Tadpole cells expressing GlyRF99A in 70 mM Cl− were hyperpolarized by 19.4 mV compared with controls (untreated siblings) (n=5, P<0.001) (supplementary material Fig. S1). Embryos were co-injected with mRNAs encoding Xrel3-2A-tdTomato and GlyRF99A-GFP3 or Kir4.1-GFP3. Localization of Xrel3 and GlyRF99A proteins in the same regions was confirmed by fluorescently tracking tdTomato and GFP3 signals, respectively. The incidence of morphologically apparent ITLSs was reduced in embryos co-injected with Xrel3 and GlyRF99A (Fig. 5Bi). Although suppression of ITLSs could in principle be due to hyperpolarization-mediated degradation of the oncogene product, this was ruled out by confirming the presence of Xrel3 protein by bright signal from a fused fluorescent protein (Fig. 5Bii,Biii). Thus, hyperpolarization was able to significantly suppress formation of ITLSs even when the oncogene product (Fig. 5C) was still present in the tissue (Fig. 5Biv–Bvi). Crucially, similar results were observed when Kir4.1 (1.54-fold decrease in ITLS, P<0.05) was used in place of GlyRF99A (1.62-fold decrease in ITLS, P<0.05) (Fig. 5C), demonstrating that suppression of ITLSs is due to changes in Vmem per se and not specific to one ion channel protein or one ion species. Consistent with this conclusion, exposure to ivermectin, which opens native GlyR channels and depolarizes cells (Morokuma et al., 2008; Blackiston et al., 2011), resulted in a 1.4-fold increase in the number of embryos having Xrel3 ITLSs (Fig. 5C, red bar), demonstrating that the incidence of ITLS formation can be increased or decreased by alteration of resting potential.
Taken together, these data show that the relatively depolarized nature of prospective ITLS sites is not only a convenient detection marker, but is also functionally instructive. Moreover, expression of well-characterized ion translocators is a convenient technique by which Vmem can be artificially perturbed to lower the ITLS incidence.
Changes in Vmem are transduced via SLC5A8-dependent mechanisms
In order to regulate cell behavior, physical changes at the membrane must be transduced by second-messenger pathways into alterations of transcription. Bioelectrical events are coupled to downstream canonical biochemical pathways through various transduction mechanisms, which can include calcium signaling via voltage-gated Ca2+ channels (VGCC) (Munaron et al., 2004a; Munaron et al., 2004b), Vmem-dependent transport of small signaling molecules (e.g. serotonin) (Fukumoto et al., 2005a; Fukumoto et al., 2005b; Adams et al., 2006), electrophoresis of morphogens through gap junctional paths (Levin and Mercola, 1998; Brooks and Woodruff, 2004; Adams and Levin, 2012a) and Vmem-guided sodium and butyrate transport via the SLC5A8 exchanger (Li et al., 2003; Coady et al., 2004; Gupta et al., 2006; Tseng and Levin, 2012). These processes can be independently targeted, in a suppression screen (Adams and Levin, 2012a) to identify the specific mechanisms that, when blocked, inhibit the ability of hyperpolarizing channels to reduce ITLS incidence (Fig. 6A).
Fig. 6.
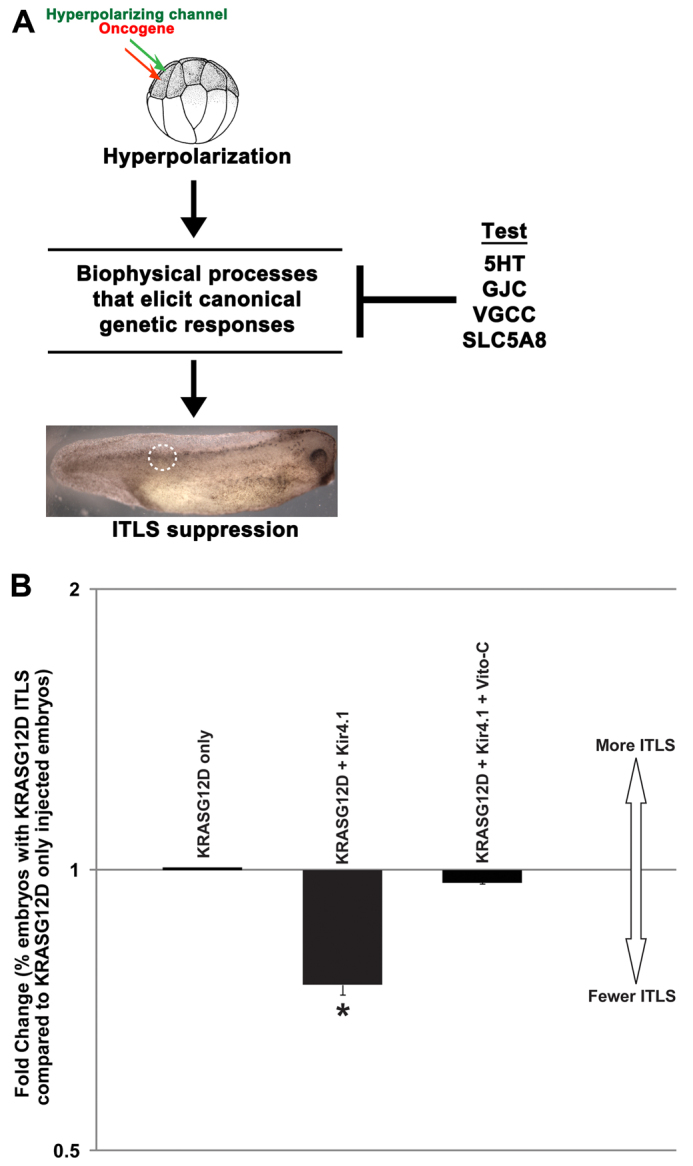
Suppression screen is employed to probe biophysical mechanisms that transduce Vmem changes into transcriptional responses. (A) Hyperpolarization can be transduced into transcriptional events and cell behavior changes by processes including calcium signaling via voltage-gated Ca2+ channels, Vmem-dependent transport of signaling molecules (e.g. serotonin), electrophoresis of morphogens through gap junctions and Vmem-guided movement of butyrate (tumor suppressor) via SLC5A8 (Levin, 2007; Levin, 2012a). 5HT, serotonin; GJC, gap junction; VGGC, voltage-gated calcium channels; SLC5A8, sodium/butyrate exchanger. To identify a biophysical transduction mechanism responsible for hyperpolarization-mediated tumor suppression, these processes were independently blocked in the ion channel ITLS suppression assay using pharmacological or molecular reagents: 10 μM fluoxetine, which blocks the voltage-gated serotonin transporter SERT; 1.7 mM lindane, which blocks GJC; 0.1 mM cadmium chloride; and 1 ng Vito-C mRNA injection, which inactivates native SLC5A8 transporters. (B) Fold change in the number of embryos with ITLSs: the number of embryos injected only with KrasG12D that exhibited ITLSs was normalized to 1. The embryos co-injected with Kir4.1 show a 1.3-fold decrease in the number of embryos with ITLS (one sample t-test, *P<0.01 compared with a normalized value of 1 that represents ITLS incidence in KrasG12D-only injected embryos). The observed significant decrease (ITLS suppression) was blocked only when Vito-C was injected together with KrasG12D and Kir4.1, implicating native SLC5A8 transporters in Vmem-mediated suppression of ITLS.
In order to begin to identify biophysical mechanisms that transduce Vmem changes to downstream events during voltage-mediated suppression of ITLSs, we performed a suppression screen using well-characterized inhibitors of Vmem sensing processes. Our four targets included serotonin transporter (inhibited via 10 μM fluoxetine); VGCC (blocked via 0.1 mM cadmium chloride); gap junctional communication (inhibited by 1.7 mM lindane); and sodium and butyrate transporter SLC5A8, which is targeted by Vito-C, a dominant-negative SLC5A8 mutant (Costa et al., 2003). Treatments targeting serotonin transport, VGCC and gap junctional communication did not significantly affect hyperpolarization-mediated suppression of ITLSs (not shown). However, misexpression of Vito-C in cells that are expressing oncogene plus hyperpolarizing channel resulted in significant reduction of hyperpolarization-mediated ITLS suppression events (P<0.05) (Fig. 6B), implicating SLC5A8 in voltage control of tumorigenic processes.
Vmem-guided uptake of butyrate through SLC5A8 results in tumor suppression
We next tested whether ITLS suppression is indeed due to butyrate influx, rather than some other role of SLC5A8. We treated KRAS- and KRAS/Kir4.1-injected embryos with 10 mM of sodium butyrate and analyzed butyric acid levels per 60 embryos in each group. The analysis showed that butyrate intake was higher when embryos received hyperpolarizing mRNA injection (253 μg compared with 175 μg of non-hyperpolarized embryos) (supplementary material Table S1). To demonstrate that butyrate uptake is responsible for tumor suppression, we treated KrasG12D-depolarized embryos with 75 μm butyric acid and scored for later ITLS incidence. The butyric-acid-treated group showed a 1.28-fold decrease (P<0.05) in the number of embryos with ITLS compared with the KrasG12D-injected (but not treated with butyric acid) group (Table 2). These results are consistent with the known tumor-suppressor role of butyrate, which exhibits HDAC inhibitory activity (Lagger et al., 2003; Bandyopadhyay et al., 2004; Bukreeva et al., 2009).
Table 2.
Vmem-directed suppression of ITLSs is mediated by butyrate
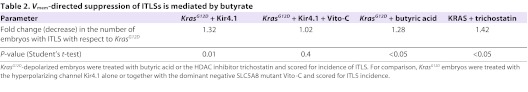
Finally, we determined that HDAC inhibition is important in Vmem-guided, butyrate-mediated tumor suppression by treating KrasG12D-injected embryos with trichostatin, a potent HDAC inhibitor. This resulted in significantly reduced ITLS incidence (1.42-fold decrease, P<0.05) (Table 2). Taken together, these data suggest the hypothesis that hyperpolarization is transduced to cell behavior changes via SLC5A8-mediated transport of Na+ and butyrate, and that the HDAC inhibitory property of butyrate could be responsible for suppression of ITLSs at the transcription level.
DISCUSSION
Given the importance of endogenous bioelectric signals in the regulation of normal cell function during pattern formation and morphostasis in vivo (McCaig et al., 2005; McCaig et al., 2009; Levin, 2012b; Levin, 2012a), we tested the hypothesis that transmembrane potential (Vmem) could be both a convenient predictive marker and a functional parameter that could be manipulated to affect tumorigenic progression. We established the Xenopus tadpole as a highly tractable system in which the molecular genetics, biophysical transduction and physiology of the in vivo activity of human oncogenes (Figs 1–3) could readily be dissected in molecular detail. The tumor-like structures (ITLSs) have a number of commonalities with classic tumors, including induction by canonical oncogenes strongly associated with mammalian cancers, increased mitotic activity (Fig. 2A–C), induced vasculogenesis (Fig. 2F) and disorganization of normal developmental architecture (Dahmane et al., 1997; Wallingford et al., 1997; Yang et al., 1998). Whether they more closely resemble highly invasive tumors or less invasive variants (e.g. skin papillomas or colon polyps) is currently under investigation. Regardless of whether they recapitulate all of the complexities of a warm-blooded model, the high conservation of molecular mechanisms on the development-cancer axis, as evidenced by the insights gained from yeast and zebrafish (Etchin et al., 2011; Liu and Leach, 2011; Pereira et al., 2012), strongly suggests that lessons learned from this tractable model will reveal highly relevant new biology.
Vmem as a predicative bioelectric signature
The detection of cancer by bioelectric parameters was one of the first uses of sensitive voltmeters applied to biological systems (Burr et al., 1938; Burr et al., 1940; Burr, 1941). More recently, tumor cells have been shown to exhibit unique expression patterns of ion channels and pumps as compared with normal tissues (Cameron et al., 1980; Moyer et al., 1982; Cameron and Smith, 1989; Arcangeli et al., 1995; Aberg et al., 2004; Farias et al., 2004; Stühmer et al., 2006; Prevarskaya et al., 2010). However, the physiological state of cells is a complicated function of all of the activities of the expressed ion translocators. Because channels and pumps are gated post-translationally and because voltage-mediated pathways are regulated by the sum total of the various ion gradients, there is rarely any one-to-one mapping between the expression of any single channel gene and the resultant bioelectrical properties. Thus, we tested direct readouts of the Vmem as a signature for early events in tumor formation that could be used as part of a detection strategy (Fig. 4A).
ITLSs induced in vivo by misexpression of mammalian oncogenes displayed a relatively depolarized Vmem (Fig. 4Bi left; supplementary material Fig. S1) and could readily be detected by fluorescent voltage reporter dyes before becoming morphologically apparent (Fig. 4B right). Our analysis revealed that depolarized Vmem has a predictive value of at least 45% (sensitivity >44% and specificity >78%) for Gli1-, KrasG12D- and Xrel3-induced ITLSs (Fig. 4C). For comparison, the prostate-specific antigen (PSA) level in serum is used as a biomarker for prostate cancer, but only has ∼29% predictive value (Thompson et al., 2004).
Thus, harnessing the potential of Vmem for clinical application will present several advantages over existing tumor biomarkers. First, almost all biomarkers that are currently in clinical use (Jiang et al., 2003; Ross et al., 2003; Thompson et al., 2004; Chatterjee and Zetter, 2005; Samowitz et al., 2005) are specific to only one type of cancer. By contrast, depolarized Vmem is associated with all three types of ITLSs tested (Table 1), implicating a universal role for Vmem change as an early indicator of tumorigenesis. Second, most biomarkers are, at best, minimally invasive, requiring microsurgery to acquire tissue samples and involving invasive procedures during the tumor detection process (Mitas et al., 2001; Song et al., 2001; Heneghan et al., 2010). By contrast, Vmem has much promising potential as a non-invasive, real-time, in vivo marker of tumors and their margins – an imaging modality that can be used on intact tissue (or during surgery), bypassing such steps as biopsy and avoiding adverse effects on healthy tissues. Finally, Vmem promises an added advantage over other markers due to its high predictive value, thus allowing early intervention measures against tumorigenesis via targeted therapeutics (Bast et al., 2001). Potential applications include use directly on skin, oral mucosa, regions easily accessible by orthoscopically delivered light sensors, or real-time detection of tumor boundaries during surgery.
Several current limitations suggest future work for improving the value of transmembrane monitoring as a tumor marker. Although Vmem measurements were made using a double dye system, CC2-DMPE and DiBAC4(3), that allowed us to obtain artifact-corrected images with more contrast between different regions of the embryo, high false-positive values (<48%) were still observed. False-positive values are, at least in part, dependent on the test sensitivity (the ability of depolarization to predict the formation of an ITLS). Although depolarization is an important parameter, future work will define a richer bioelectric profile (including Vmem, pH and specific ion content) of prospective tumors (Ouwerkerk et al., 2007) that can be used as a physiological signature to predict tumor formation with improved predictive success.
Control of tumorigenic process by Vmem
Although recent data indicate that depolarization can trigger cancer-like phenotypes (Morokuma et al., 2008; Blackiston et al., 2011), suppression of ITLS formation by hyperpolarization and the relationship between bona fide oncogenes and transmembrane potential had not previously been explored. Crucially, our results show that the cells’ unique depolarization of Vmem is not merely a marker, but is itself functionally instructive during the oncogenic process. The data show that misexpression of hyperpolarizing channels and oncogenes significantly suppresses formation of ITLSs in the same body regions (Fig. 5B,C). Although hyperpolarizing channels largely reversed the oncogene-induced depolarization (supplementary material Fig. S1), in 33% of the cases, Vmem was not driven back to normal levels. Thus, the ITLS suppression effect we report is an underestimate of the true efficacy of Vmem change to prevent tumor formation (because variability in ectopic channel expression prevented a sizable fraction of the animals from fully recovering a polarized resting potential). An additional factor contributing to incomplete suppression is likely to be the fact that our hyperpolarizing reagent is unable to mimic endogenous temporal variations in Vmem of healthy cells. Although significant differences in the profile of the resting potential over time (e.g. with the cell cycle) are observed between normal and transformed cells (reviewed by Blackiston et al., 2009), current technology allows only a simple hyperpolarization that might not recapitulate all of the subtle aspects of the Vmem signal that is responsible for keeping cells from neoplastic transformation. Future work, including the development of next-generation (temporally controllable) ion translocators and compilation of physiomics profiling data that reveal the full subtlety of desired spatiotemporal bioelectric states for normal cells, will be required to fully optimize this ITLS suppressive effect. Although we could not completely eradicate all ITLSs using doses of hyperpolarizing channel low enough to avoid inducing patterning defects in the host, even this simple method of hyperpolarization achieves a degree of ITLS suppression whose magnitude would certainly be significant and useful in a clinical setting.
The modulating effect of extracellular chloride levels in the GlyR-F99A experiments rules out ion-independent (e.g. scaffolding) roles of ion channels. Moreover, the observed suppression of ITLSs is also not the result of gene- or ion-specific roles of Cl− or K+ channels. As previously shown in the case of left-right patterning (Levin et al., 2002; Adams et al., 2006) and eye induction (Pai et al., 2012), the ability to achieve the same effect using hyperpolarization driven by completely different channels and ion species (potassium or chloride) strongly indicates a signaling role for resting potential per se. The functional relationship between Vmem and ITLS formation is further validated by the fact that driving Vmem in the opposite direction (depolarizing cells) increases the incidence of ITLS formation (Fig. 5C).
Our data are consistent with the growing body of literature implicating altered ion channel activities at different stages of neoplastic progression (Abdul and Hoosein, 2002b; Abdul and Hoosein, 2002a; Diss et al., 2004; Pardo et al., 2005; Roger et al., 2007; Wang et al., 2007), and with recent efforts to target specific ion channels as cancer therapies (Kunzelmann, 2005; Brackenbury and Isom, 2008; Arcangeli et al., 2009; Arcangeli et al., 2012). Indeed, a number of ion channels have been suggested as oncogenes (Saito et al., 1998; Pardo et al., 1999; Pei et al., 2003; Gupta et al., 2006; Onkal and Djamgoz, 2009; Roepke et al., 2010). However, it is important to note that overall Vmem might be the key control point and that focusing on individual channels as oncogenes might provide an incomplete picture of the fundamental biology of the control system that suppresses tumor formation during morphostasis of the organism. We suggest that although individual channels that dominate Vmem in some cells are exciting and appropriate targets for functional intervention using pharmacological or genetic hyperpolarizing reagents, it will be essential to think about cancer progression as the result of a fundamentally physiological cell state, rather than adding ion channels to the list of genes used in cancer profiles (Rubin, 1985).
Transduction of Vmem changes via SLC5A8
Having shown that membrane potential regulates the ability of oncogenes to induce tumor-like structures, it is important to identify the transduction machinery that converts a fundamentally physical signal into second-messenger pathways that regulate transcription and cell behavior. How does hyperpolarization suppress the formation of ITLSs? Recent advances have revealed the molecular details of how bioelectric cues integrate with canonical genetic and biochemical pathways in a variety of systems. Studies of the role of transmembrane potential in vertebrate and invertebrate morphogenesis revealed several possible transduction mechanisms (reviewed by Adams and Levin, 2012a; Levin, 2012a); these include calcium influx through voltage-gated calcium channels (Beane et al., 2011; Ring et al., 2012) and voltage-dependent transport of small regulatory molecules via transporters (Fukumoto et al., 2005a; Blackiston et al., 2011) and gap junctions (Fukumoto et al., 2005b) (Fig. 6A). However, blockade of these pathways did not affect ITLS suppression by hyperpolarization, making them unlikely candidates for mediating the voltage control of oncogene-driven tumorigenesis. However, a molecular-genetic loss-of-function experiment implicated that sodium-coupled monocarboxylate transporter (SLC5A8), as a dominant-negative mutant, suppresses the ability of hyperpolarization to modulate ITLS formation (Fig. 6B). A role for SLC5A8-mediated transduction of voltage was recently proposed as a likely Vmem transduction mechanism in the bioelectric control of appendage regeneration (Tseng and Levin, 2012). The functional role of butyrate is further validated by the reduced incidence of ITLS formation in oncogene-injected embryos treated with butyrate.
Butyrate analyses showed that influx of butyrate is closely linked with Vmem, with higher levels of butyrate content resulting from induced hyperpolarization (supplementary material Table S1). Our observation is consistent with a previous study showing Vmem-dependent butyrate transport via SLC5A8 (Gopal et al., 2004). However, under SLC5A8 inhibition, even hyperpolarized embryos would have low intracellular butyrate concentrations and high levels of ITLS incidence, in comparison with hyperpolarized oncogene-injected embryos with functional endogenous SLC5A8. Interestingly, downregulated expression of SLC5A8 is observed in colon cancer cells, which is attributed to limited intake of butyrate (a histone deacetylase inhibitor) that protects the host from colorectal cancer (Coady et al., 2004; Miyauchi et al., 2004; Gupta et al., 2006). Consistent with this fact, we confirmed that HDAC inhibition is important during butyrate-induced ITLS suppression, by using trichostatin, a potent inhibitor of HDAC I and HDAC II (Yoshida et al., 1990), to recapitulate Vmem-driven suppression of ITLSs.
Collectively, the data presented here suggest a model (Fig. 7) for Vmem and its instructive role in the regulation of normal morphostasis and dysregulation that leads to tumor formation. In unperturbed embryos, activities of several ion channels and pumps generate and maintain polarized Vmem (Fig. 7A). Pharmacological and/or molecular-genetic targeting of ion channels and pumps results in hyperpolarized Vmem, increasing influx of Na+ via SLC5A8, which powers the transport of butyrate into the cell (Fig. 7C). Within the nucleus of hyperpolarized cells, butyrate acts as an HDAC inhibitor to limit growth. Hyperacetyaltion of histones (as a result of butyrate-induced HDAC inhibition) has been shown to arrest cell proliferation and cause differentiation in cancer cell lines (McCue et al., 1984; Davie, 2003), providing a satisfying composite view for a pathway that unifies bioelectric state, epigenetic transduction machinery and control of cell proliferation and differentiation during neoplastic events.
Fig. 7.
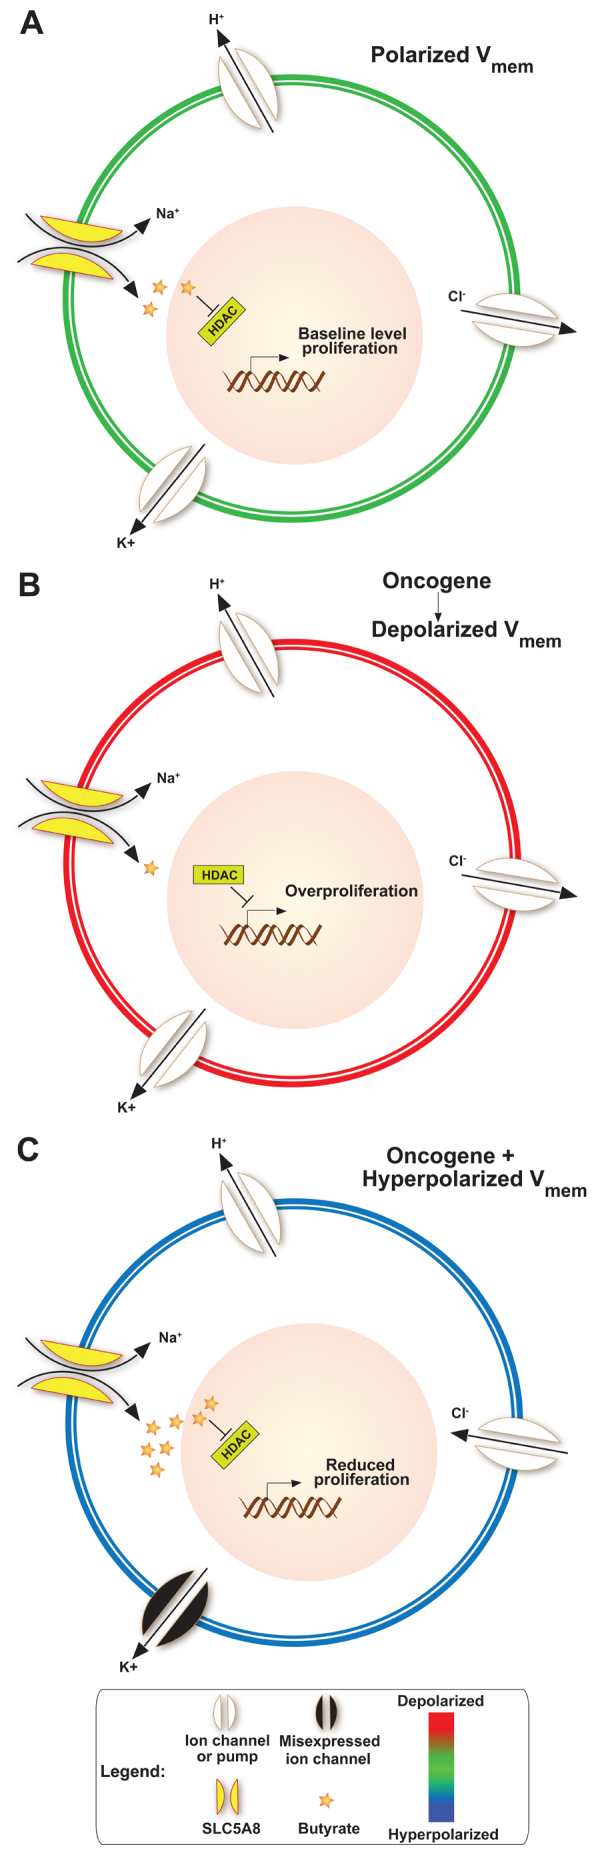
Model for Vmem-mediated control of cell dynamics during normal development and neoplastic transformation. (A) In unperturbed embryos, polarized Vmem is generated and maintained by several ion channels and pumps present in the plasma membrane; this condition allows moderate amounts of butyrate to influx through SLC5A8 and inhibits HDACs. This epigenetically regulates transcription machinery, thereby maintaining baseline level proliferation and differentiation compatible with normal somatic morphostasis. (B) Expression of oncogenes, or other physiological events [e.g. non-genetically induced depolarization (Morokuma et al., 2008; Blackiston et al., 2011)], results in the inability of SLC5A8 to import butyrate. Higher HDAC activity then leads to overproliferation and other neoplastic changes leading to appearance of tumor-like structures. (C) The effect can be blocked by forced hyperpolarization via molecular and/or pharmacological targeting of H+, K+ or Cl− ion translocators. Forced hyperpolarization of the overall transmembrane potential efficiently powers the uptake of Na+ through SLC5A8. This energetically favorable intake of Na+ drives the inward flux of butyrate through SLC5A8. High levels of butyrate continually block HDAC, which leads to hyperacetylation of important genes, resulting in cell cycle arrest and suppression of ITLS formation.
Conclusion
ITLSs formed in the Xenopus tadpole model by mammalian oncogenes exhibit a depolarized voltage potential. This is not only a convenient signature by which such regions can be detected in the organism before they become morphologically apparent, but is functionally instructive. Artificially hyperpolarizing the cells, by one of several convenient ion channel types, reduces the incidence of ITLSs formed, despite the high levels of oncogene expression in the tissue. The mechanism is mediated by SLC5A8 and the transport of small molecules that regulate epigenetic, cancer-relevant signaling. Collectively, these data identify a convenient new non-invasive marker for diagnosis, a strategy for normalization of tumors in vivo by control of resting potential, and a novel molecular pathway through which bioelectric events mediate morphostasis and the oncogene-driven escape of cells from the adaptive patterning program of the host organism.
MATERIALS AND METHODS
Animal husbandry
Xenopus laevis embryos were collected and fertilized in vitro according to standard protocols (Sive et al., 2000) in 0.1× MMR (pH 7.8) with 0.1% gentamicin. Xenopus embryos were housed at 14–18°C and staged according to Nieuwkoop and Faber (Nieuwkoop and Faber, 1967).
Microinjection
Fertilized Xenopus embryos at the 16-cell stage were transferred into mesh-bottomed dishes with 3% Ficoll and injected with capped, synthetic mRNAs (made using the Ambion Message Machine kit) dissolved in water at the stages indicated. At 2 hours post-injection, embryos were transferred into 0.75× MMR for 45 minutes before they were washed and cultured in 0.1× MMR until the desired stage was reached. All procedures involving the use of animals for experimental purposes were approved by the Institutional Animal Care and Use Committees (IACUC) and Tufts University Department of Lab Animal Medicine (DLAM) under the protocol number M2011-70.
Imaging Vmem using CC2-DMPE and DiBAC4(3)
CC2-DMPE [N-(6-chloro-7-hydroxycoumarin-3-carbonyl)-dimyristoylphosphatidyl ethanolamine from Invitrogen, Carlsbad, CA], used to measure hyperpolarization, and DiBAC4(3) [bis-(1,3-dibutylbarbituric acid) trimethine oxonol from Biotium, Hayward, CA], used to measure depolarization, were used as a ratio pair. A 5 mM stock solution of CC2-DMPE in DMSO was used at 1:1000 in 0.1× MMR to treat embryos for 1 hour. After a quick wash with 0.1× MMR, embryos were transferred into a DiBAC4(3) solution (1.9 mM stock solution in DMSO used at 1:1000 in 0.1× MMR). Imaging was done while embryos were still in the DiBAC4(3) solution. An Olympus BX-61 equipped with a Hamamatsu ORCA AG CCD camera, controlled by MetaMorph software, was used for imaging. CC2-DMPE filters were: EX 405/20; BS 425; and EM 460/50 (Chroma filter set 31036, Chroma Technology, Bellows Falls, VT). DiBAC4(3) filters were: EX 470/20; BS 485; and EM 517/23 (Chroma filter set 41001). After corrections to remove camera noise and uneven illumination, the software was used to calculate the ratio of hyperpolarization signal (CC2-DMPE) to depolarizing signal [DiBAC4(3)] for an artifact-corrected image with more contrast between different regions of the embryo; the brighter the pixel, the more polarized the region it represents (Adams and Levin, 2012c).
Predictive screening
Xrel3- and Gli-injected Xenopus embryos were collected at the neurula stage, before ITLSs are morphologically and histologically apparent. Collected embryos were imaged using CC2-DMPE and DiBAC4(3) (as described above), and divided into two categories based on the presence of depolarized group of cells (intensity of fluorescent signal) and size of depolarized foci (area of fluorescent signal). Given possible false signals coming from tiny cell debris that take up imaging dyes, only embryos with depolarized foci greater than 2.45% of the embryo in the viewing field (under 4× objective), were categorized as having a true signal. The effectiveness of depolarization in predicting ITLS formation was quantified by calculating false positives (how many embryos with no detectable aberrant Vmem showed visible ITLS in tadpoles), false negatives (ITLS-positive tadpoles not showing aberrant Vmem as embryos), true positives (fraction of embryos with aberrant Vmem that developed into ITLS-positive tadpoles), sensitivity (fraction of ITLS-positive tadpoles that were preceded by depolarization) and specificity values (fraction of the non-ITLS forming cells that were not preceded by depolarization).
Immunohistochemistry
Spatial analysis of cell proliferation was performed by immunohistochemistry in agarose sections, using an anti-H3B-P antibody (04-817; Millipore, Billerica, MA). Briefly, embryos were fixed overnight in MEMFA (Sive et al., 2000), embedded in agarose and sectioned at 150 μm using a Leica vibrotome. The sections were permeabilized in phosphate buffered saline (PBS) containing 0.1× Triton X-100 (PBTr) for 30 minutes, blocked with 10% goat serum in PBS containing 0.1% Tween-20 (PBST) for 1 hour, and incubated at 4°C overnight with anti-H3B-P primary antibody. Sections were then washed six times with PBST (1 hour each at room temperature) and incubated with Alexa-Fluor-647-conjugated secondary antibody at 1:1000 in PBST containing 10% goat serum overnight at 4°C. After five 1-hour washes in PBST, sections were mounted on a slide and photographed using an Alexa Fluor 647 filter set on an Olympus BX61 spinning-disk confocal microscope with Hamamatsu ORCA digital CCD camera.
Electrophysiology
Sharp electrode recordings of Vmem were made using an oocyte clamp OC-725C amplifier (Warner Instruments, Hamden, CA). A glass microelectrode was pulled to a fine tip (80–100 Ω resistance), back-filled with electrode solution (2 M potassium acetate, 10 mM KCl, 5 mM HEPES pH 7.5) and used on a three-axis-manipulator. Vmem recordings were then acquired by using 0.1× MMR as the extracellular reference solution.
Statistical analysis
Data were expressed as the mean unless otherwise noted. Error bars represent s.e.m. The differences between treatment groups were analyzed using Student’s t-test or one-way ANOVA (Bonferroni post hoc analysis) and the null hypothesis was rejected at the 0.05 level.
Acknowledgments
We thank Leonard Zon for the KRAS mutant construct, John Adelman for the Kir4.1 construct, Ariel Ruiz i Altaba for the Gli1 construct, John Wallingford for the Xrel3 and p53 mutant constructs, Aaron Zorn and Michael Romero for the vitoC construct and Trevor Smart for the GlyR-F99A construct. We thank Punita Koustubhan and Amber Currier for general laboratory assistance and frog husbandry, Joan Lemire and Claire Stevenson for molecular biology assistance, Tal Shormat for assistance with electrophysiology measurements, Dany Adams for help with imaging, Douglas Brash, Laura Vandenberg and Joan Lemire for valuable comments on the manuscript, and the members of the Levin laboratory and the bioelectricity community for many useful discussions.
Footnotes
COMPETING INTERESTS
The authors declare that they do not have any competing or financial interests.
AUTHOR CONTRIBUTIONS
M.L. conceived the experiments. B.T.C. and M.L. designed the experiments. B.T.C. performed the experiments. B.T.C. and M.L. analyzed the data and wrote the manuscript.
FUNDING
M.L. is grateful for support of the National Institutes of Health [grant numbers AR061988 and AR055993] and the G. Harold and Leila Y. Mathers Charitable Foundation.
SUPPLEMENTARY MATERIAL
Supplementary material for this article is available at http://dmm.biologists.org/lookup/suppl/doi:10.1242/dmm.010835/-/DC1
REFERENCES
- Abdul M., Hoosein N. (2002a). Voltage-gated potassium ion channels in colon cancer. Oncol. Rep. 9, 961–964 [PubMed] [Google Scholar]
- Abdul M., Hoosein N. (2002b). Voltage-gated sodium ion channels in prostate cancer: expression and activity. Anticancer Res. 22, 1727–1730 [PubMed] [Google Scholar]
- Aberg P., Nicander I., Hansson J., Geladi P., Holmgren U., Ollmar S. (2004). Skin cancer identification using multifrequency electrical impedance – a potential screening tool. IEEE Trans. Biomed. Eng. 51, 2097–2102 [DOI] [PubMed] [Google Scholar]
- Adams D. S. (2008). A new tool for tissue engineers: ions as regulators of morphogenesis during development and regeneration. Tissue Eng. Part A 14, 1461–1468 [DOI] [PubMed] [Google Scholar]
- Adams D. S., Levin M. (2012a). Endogenous voltage gradients as mediators of cell-cell communication: strategies for investigating bioelectrical signals during pattern formation. Cell Tissue Res. doi: 10.1007/s00441-012-1329-4 [Epub ahead of print]. [DOI] [PMC free article] [PubMed]
- Adams D. S., Levin M. (2012b). General principles for measuring resting membrane potential and ion concentration using fluorescent bioelectricity reporters. Cold Spring Harb. Protoc. 2012, 385–397 [DOI] [PMC free article] [PubMed] [Google Scholar]
- Adams D. S., Levin M. (2012c). Measuring resting membrane potential using the fluorescent voltage reporters DiBAC4(3) and CC2-DMPE. Cold Spring Harb. Protoc. 2012, 459–464 [DOI] [PMC free article] [PubMed] [Google Scholar]
- Adams D. S., Robinson K. R., Fukumoto T., Yuan S., Albertson R. C., Yelick P., Kuo L., McSweeney M., Levin M. (2006). Early, H+-V-ATPase-dependent proton flux is necessary for consistent left-right patterning of non-mammalian vertebrates. Development 133, 1657–1671 [DOI] [PMC free article] [PubMed] [Google Scholar]
- Adams D. S., Masi A., Levin M. (2007). H+pump-dependent changes in membrane voltage are an early mechanism necessary and sufficient to induce Xenopus tail regeneration. Development 134, 1323–1335 [DOI] [PubMed] [Google Scholar]
- Arcangeli A., Bianchi L., Becchetti A., Faravelli L., Coronnello M., Mini E., Olivotto M., Wanke E. (1995). A novel inward-rectifying K+current with a cell-cycle dependence governs the resting potential of mammalian neuroblastoma cells. J. Physiol. 489, 455–471 [DOI] [PMC free article] [PubMed] [Google Scholar]
- Arcangeli A., Crociani O., Lastraioli E., Masi A., Pillozzi S., Becchetti A. (2009). Targeting ion channels in cancer: a novel frontier in antineoplastic therapy. Curr. Med. Chem. 16, 66–93 [DOI] [PubMed] [Google Scholar]
- Arcangeli A., Pillozzi S., Becchetti A. (2012). Targeting ion channels in leukemias: a new challenge for treatment. Curr. Med. Chem. 19, 683–696 [DOI] [PubMed] [Google Scholar]
- Aw S., Adams D. S., Qiu D., Levin M. (2008). H,K-ATPase protein localization and Kir4.1 function reveal concordance of three axes during early determination of left-right asymmetry. Mech. Dev. 125, 353–372 [DOI] [PMC free article] [PubMed] [Google Scholar]
- Bandyopadhyay D., Mishra A., Medrano E. E. (2004). Overexpression of histone deacetylase 1 confers resistance to sodium butyrate-mediated apoptosis in melanoma cells through a p53-mediated pathway. Cancer Res. 64, 7706–7710 [DOI] [PubMed] [Google Scholar]
- Bast R. C., Jr, Ravdin P., Hayes D. F., Bates S., Fritsche H., Jr, Jessup J. M., Kemeny N., Locker G. Y., Mennel R. G., Somerfield M. R. (2001). 2000 update of recommendations for the use of tumor markers in breast and colorectal cancer: clinical practice guidelines of the American Society of Clinical Oncology. J. Clin. Oncol. 19, 1865–1878 [DOI] [PubMed] [Google Scholar]
- Beane W. S., Morokuma J., Adams D. S., Levin M. (2011). A chemical genetics approach reveals H,K-ATPase-mediated membrane voltage is required for planarian head regeneration. Chem. Biol. 18, 77–89 [DOI] [PMC free article] [PubMed] [Google Scholar]
- Becchetti A. (2011). Ion channels and transporters in cancer. 1. Ion channels and cell proliferation in cancer. Am. J. Physiol. Cell Physiol. 301, C255–C265 [DOI] [PubMed] [Google Scholar]
- Binggeli R., Weinstein R. C. (1986). Membrane potentials and sodium channels: hypotheses for growth regulation and cancer formation based on changes in sodium channels and gap junctions. J. Theor. Biol. 123, 377–401 [DOI] [PubMed] [Google Scholar]
- Blackiston D. J., McLaughlin K. A., Levin M. (2009). Bioelectric controls of cell proliferation: ion channels, membrane voltage and the cell cycle. Cell Cycle 8, 3527–3536 [DOI] [PMC free article] [PubMed] [Google Scholar]
- Blackiston D., Adams D. S., Lemire J. M., Lobikin M., Levin M. (2011). Transmembrane potential of GlyCl-expressing instructor cells induces a neoplastic-like conversion of melanocytes via a serotonergic pathway. Dis. Model. Mech. 4, 67–85 [DOI] [PMC free article] [PubMed] [Google Scholar]
- Brackenbury W. J., Isom L. L. (2008). Voltage-gated Na+channels: potential for beta subunits as therapeutic targets. Expert Opin. Ther. Targets 12, 1191–1203 [DOI] [PMC free article] [PubMed] [Google Scholar]
- Brackenbury W. J., Djamgoz M. B., Isom L. L. (2008). An emerging role for voltage-gated Na+channels in cellular migration: regulation of central nervous system development and potentiation of invasive cancers. Neuroscientist 14, 571–583 [DOI] [PMC free article] [PubMed] [Google Scholar]
- Brooks R. A., Woodruff R. I. (2004). Calmodulin transmitted through gap junctions stimulates endocytic incorporation of yolk precursors in insect oocytes. Dev. Biol. 271, 339–349 [DOI] [PubMed] [Google Scholar]
- Bukreeva E. I., Aksenov N. D., Bardin A. A., Pospelov V. A., Pospelova T. V. (2009). [Effect of histone deacetylases inhibitor sodium butyrate (NaB) on transformants E1A + cHa-Ras expressing wild type p53 with supressed transactivation function]. Tsitologiia 51, 697–705 [PubMed] [Google Scholar]
- Burr H. S. (1940). Biologic organization and the cancer problem. Yale J. Biol. Med. 12, 277–282 [PMC free article] [PubMed] [Google Scholar]
- Burr H. S. (1941). Changes in the field properties of mice with transplanted tumors. Yale J. Biol. Med. 13, 783–788 [PMC free article] [PubMed] [Google Scholar]
- Burr H. S., Strong L. C., Smith G. M. (1938). Bio-electric correlates of methylcolanthrene-induced Tumors in mice. Yale J. Biol. Med. 10, 539–544 [PMC free article] [PubMed] [Google Scholar]
- Burr H. S., Smith G. M., Strong L. C. (1940). Electrometric studies of tumors in mice induced by the external application of benzpyrene. Yale J. Biol. Med. 12, 711–717 [PMC free article] [PubMed] [Google Scholar]
- Cameron I. L., Smith N. K. (1989). Cellular concentration of magnesium and other ions in relation to protein synthesis, cell proliferation and cancer. Magnesium 8, 31–44 [PubMed] [Google Scholar]
- Cameron I. L., Smith N. K., Pool T. B., Sparks R. L. (1980). Intracellular concentration of sodium and other elements as related to mitogenesis and oncogenesis in vivo. Cancer Res. 40, 1493–1500 [PubMed] [Google Scholar]
- Chatterjee S. K., Zetter B. R. (2005). Cancer biomarkers: knowing the present and predicting the future. Future Oncol. 1, 37–50 [DOI] [PubMed] [Google Scholar]
- Clement V., Sanchez P., de Tribolet N., Radovanovic I., Ruiz i Altaba A. (2007). HEDGEHOG-GLI1 signaling regulates human glioma growth, cancer stem cell self-renewal, and tumorigenicity. Curr. Biol. 17, 165–172 [DOI] [PMC free article] [PubMed] [Google Scholar]
- Coady M. J., Chang M. H., Charron F. M., Plata C., Wallendorff B., Sah J. F., Markowitz S. D., Romero M. F., Lapointe J. Y. (2004). The human tumour suppressor gene SLC5A8 expresses a Na+-monocarboxylate cotransporter. J. Physiol. 557, 719–731 [DOI] [PMC free article] [PubMed] [Google Scholar]
- Cone C. D., Jr (1971). Unified theory on the basic mechanism of normal mitotic control and oncogenesis. J. Theor. Biol. 30, 151–181 [DOI] [PubMed] [Google Scholar]
- Cone C. D., Jr, Tongier M., Jr (1971). Control of somatic cell mitosis by simulated changes in the transmembrane potential level. Oncology 25, 168–182 [DOI] [PubMed] [Google Scholar]
- Costa R. M., Mason J., Lee M., Amaya E., Zorn A. M. (2003). Novel gene expression domains reveal early patterning of the Xenopus endoderm. Gene Expr. Patterns 3, 509–519 [DOI] [PubMed] [Google Scholar]
- Dahmane N., Lee J., Robins P., Heller P., Ruiz i Altaba A. (1997). Activation of the transcription factor Gli1 and the Sonic hedgehog signalling pathway in skin tumours. Nature 389, 876–881 [DOI] [PubMed] [Google Scholar]
- Davie J. R. (2003). Inhibition of histone deacetylase activity by butyrate. J. Nutr. 133 Suppl., 2485S–2493S [DOI] [PubMed] [Google Scholar]
- Diss J. K., Fraser S. P., Djamgoz M. B. (2004). Voltage-gated Na+channels: multiplicity of expression, plasticity, functional implications and pathophysiological aspects. Eur. Biophys. J. 33, 180–193 [DOI] [PubMed] [Google Scholar]
- Etchin J., Kanki J. P., Look A. T. (2011). Zebrafish as a model for the study of human cancer. Methods Cell Biol. 105, 309–337 [DOI] [PubMed] [Google Scholar]
- Farias L. M., Ocaña D. B., Díaz L., Larrea F., Avila-Chávez E., Cadena A., Hinojosa L. M., Lara G., Villanueva L. A., Vargas C., et al. (2004). Ether a go-go potassium channels as human cervical cancer markers. Cancer Res. 64, 6996–7001 [DOI] [PubMed] [Google Scholar]
- Fiske J. L., Fomin V. P., Brown M. L., Duncan R. L., Sikes R. A. (2006). Voltage-sensitive ion channels and cancer. Cancer Metastasis Rev. 25, 493–500 [DOI] [PubMed] [Google Scholar]
- Fukumoto T., Blakely R., Levin M. (2005a). Serotonin transporter function is an early step in left-right patterning in chick and frog embryos. Dev. Neurosci. 27, 349–363 [DOI] [PubMed] [Google Scholar]
- Fukumoto T., Kema I. P., Levin M. (2005b). Serotonin signaling is a very early step in patterning of the left-right axis in chick and frog embryos. Curr. Biol. 15, 794–803 [DOI] [PubMed] [Google Scholar]
- Gilmore T. D., Kalaitzidis D., Liang M. C., Starczynowski D. T. (2004). The c-Rel transcription factor and B-cell proliferation: a deal with the devil. Oncogene 23, 2275–2286 [DOI] [PubMed] [Google Scholar]
- Gopal E., Fei Y. J., Sugawara M., Miyauchi S., Zhuang L., Martin P., Smith S. B., Prasad P. D., Ganapathy V. (2004). Expression of slc5a8 in kidney and its role in Na(+)-coupled transport of lactate. J. Biol. Chem. 279, 44522–44532 [DOI] [PubMed] [Google Scholar]
- Gupta N., Martin P. M., Prasad P. D., Ganapathy V. (2006). SLC5A8 (SMCT1)-mediated transport of butyrate forms the basis for the tumor suppressive function of the transporter. Life Sci. 78, 2419–2425 [DOI] [PubMed] [Google Scholar]
- Heneghan H. M., Miller N., Lowery A. J., Sweeney K. J., Newell J., Kerin M. J. (2010). Circulating microRNAs as novel minimally invasive biomarkers for breast cancer. Ann. Surg. 251, 499–505 [DOI] [PubMed] [Google Scholar]
- House C. D., Vaske C. J., Schwartz A. M., Obias V., Frank B., Luu T., Sarvazyan N., Irby R. B., Strausberg R. L., Hales T. G., et al. (2010). Voltage-gated Na+channel SCN5A is a key regulator of a gene transcriptional network that controls colon cancer invasion. Cancer Res. 70, 6957–6967 [DOI] [PMC free article] [PubMed] [Google Scholar]
- Huang S., Ernberg I., Kauffman S. (2009). Cancer attractors: a systems view of tumors from a gene network dynamics and developmental perspective. Semin. Cell Dev. Biol. 20, 869–876 [DOI] [PMC free article] [PubMed] [Google Scholar]
- Jiang X. M., Kong J., Lin T., Yu X. Y., Chen Y., Dai Y., Yang H. Y., Sun X. L., Yang J., Yang Y. Q., et al. (2003). [Study on the clinical use of alpha-fetoprotein (AFP) colloidal gold diagnostic strip]. Zhonghua Liu Xing Bing Xue Za Zhi 24, 210–212 [PubMed] [Google Scholar]
- Jing L., Zon L. I. (2011). Zebrafish as a model for normal and malignant hematopoiesis. Dis. Model. Mech. 4, 433–438 [DOI] [PMC free article] [PubMed] [Google Scholar]
- Kunzelmann K. (2005). Ion channels and cancer. J. Membr. Biol. 205, 159–173 [DOI] [PubMed] [Google Scholar]
- Lagger G., Doetzlhofer A., Schuettengruber B., Haidweger E., Simboeck E., Tischler J., Chiocca S., Suske G., Rotheneder H., Wintersberger E., et al. (2003). The tumor suppressor p53 and histone deacetylase 1 are antagonistic regulators of the cyclin-dependent kinase inhibitor p21/WAF1/CIP1 gene. Mol. Cell. Biol. 23, 2669–2679 [DOI] [PMC free article] [PubMed] [Google Scholar]
- Le X., Langenau D. M., Keefe M. D., Kutok J. L., Neuberg D. S., Zon L. I. (2007). Heat shock-inducible Cre/Lox approaches to induce diverse types of tumors and hyperplasia in transgenic zebrafish. Proc. Natl. Acad. Sci. USA 104, 9410–9415 [DOI] [PMC free article] [PubMed] [Google Scholar]
- Levin M. (2007). Large-scale biophysics: ion flows and regeneration. Trends Cell Biol. 17, 261–270 [DOI] [PubMed] [Google Scholar]
- Levin M. (2009). Bioelectric mechanisms in regeneration: unique aspects and future perspectives. Semin. Cell Dev. Biol. 20, 543–556 [DOI] [PMC free article] [PubMed] [Google Scholar]
- Levin M. (2012a). Molecular bioelectricity in developmental biology: new tools and recent discoveries: control of cell behavior and pattern formation by transmembrane potential gradients. Bioessays 34, 205–217 [DOI] [PMC free article] [PubMed] [Google Scholar]
- Levin M. (2012b). Morphogenetic fields in embryogenesis, regeneration, and cancer: non-local control of complex patterning. Biosystems 109, 243–261 [DOI] [PMC free article] [PubMed] [Google Scholar]
- Levin M., Mercola M. (1998). Gap junctions are involved in the early generation of left-right asymmetry. Dev. Biol. 203, 90–105 [DOI] [PubMed] [Google Scholar]
- Levin M., Thorlin T., Robinson K. R., Nogi T., Mercola M. (2002). Asymmetries in H+/K+-ATPase and cell membrane potentials comprise a very early step in left-right patterning. Cell 111, 77–89 [DOI] [PubMed] [Google Scholar]
- Li H., Myeroff L., Smiraglia D., Romero M. F., Pretlow T. P., Kasturi L., Lutterbaugh J., Rerko R. M., Casey G., Issa J. P., et al. (2003). SLC5A8, a sodium transporter, is a tumor suppressor gene silenced by methylation in human colon aberrant crypt foci and cancers. Proc. Natl. Acad. Sci. USA 100, 8412–8417 [DOI] [PMC free article] [PubMed] [Google Scholar]
- Liu S., Leach S. D. (2011). Zebrafish models for cancer. Annu. Rev. Pathol. 6, 71–93 [DOI] [PubMed] [Google Scholar]
- Marcus D. C., Wu T., Wangemann P., Kofuji P. (2002). KCNJ10 (Kir4.1) potassium channel knockout abolishes endocochlear potential. Am. J. Physiol. Cell Physiol. 282, C403–C407 [DOI] [PubMed] [Google Scholar]
- McCaig C. D., Rajnicek A. M., Song B., Zhao M. (2005). Controlling cell behavior electrically: current views and future potential. Physiol. Rev. 85, 943–978 [DOI] [PubMed] [Google Scholar]
- McCaig C. D., Song B., Rajnicek A. M. (2009). Electrical dimensions in cell science. J. Cell Sci. 122, 4267–4276 [DOI] [PubMed] [Google Scholar]
- McCue P. A., Gubler M. L., Sherman M. I., Cohen B. N. (1984). Sodium butyrate induces histone hyperacetylation and differentiation of murine embryonal carcinoma cells. J. Cell Biol. 98, 602–608 [DOI] [PMC free article] [PubMed] [Google Scholar]
- McNulty S. E., del Rosario R., Cen D., Meyskens F. L., Jr, Yang S. (2004). Comparative expression of NFkappaB proteins in melanocytes of normal skin vs. benign intradermal naevus and human metastatic melanoma biopsies. Pigment Cell Res. 17, 173–180 [DOI] [PubMed] [Google Scholar]
- Mitas M., Mikhitarian K., Walters C., Baron P. L., Elliott B. M., Brothers T. E., Robison J. G., Metcalf J. S., Palesch Y. Y., Zhang Z., et al. (2001). Quantitative real-time RT-PCR detection of breast cancer micrometastasis using a multigene marker panel. Int. J. Cancer 93, 162–171 [DOI] [PubMed] [Google Scholar]
- Miyauchi S., Gopal E., Fei Y. J., Ganapathy V. (2004). Functional identification of SLC5A8, a tumor suppressor down-regulated in colon cancer, as a Na(+)-coupled transporter for short-chain fatty acids. J. Biol. Chem. 279, 13293–13296 [DOI] [PubMed] [Google Scholar]
- Morokuma J., Blackiston D., Adams D. S., Seebohm G., Trimmer B., Levin M. (2008). Modulation of potassium channel function confers a hyperproliferative invasive phenotype on embryonic stem cells. Proc. Natl. Acad. Sci. USA 105, 16608–16613 [DOI] [PMC free article] [PubMed] [Google Scholar]
- Moyer M. P., Moyer R. C., Waite M. R. (1982). A survey of intracellular Na+and K+of various normal, transformed, and tumor cells. J. Cell. Physiol. 113, 129–133 [DOI] [PubMed] [Google Scholar]
- Munaron L., Antoniotti S., Fiorio Pla A., Lovisolo D. (2004a). Blocking Ca2+entry: a way to control cell proliferation. Curr. Med. Chem. 11, 1533–1543 [DOI] [PubMed] [Google Scholar]
- Munaron L., Antoniotti S., Lovisolo D. (2004b). Intracellular calcium signals and control of cell proliferation: how many mechanisms? J. Cell. Mol. Med. 8, 161–168 [DOI] [PMC free article] [PubMed] [Google Scholar]
- Nieuwkoop P. D., Faber J. (1967). Normal Table of Xenopus laevis (Daudin). Amsterdam, Netherlands: North-Holland Publishing Company [Google Scholar]
- Nuccitelli R. (2003). A role for endogenous electric fields in wound healing. Curr. Top. Dev. Biol. 58, 1–26 [DOI] [PubMed] [Google Scholar]
- Onkal R., Djamgoz M. B. (2009). Molecular pharmacology of voltage-gated sodium channel expression in metastatic disease: clinical potential of neonatal Nav1.5 in breast cancer. Eur. J. Pharmacol. 625, 206–219 [DOI] [PubMed] [Google Scholar]
- Ouwerkerk R., Jacobs M. A., Macura K. J., Wolff A. C., Stearns V., Mezban S. D., Khouri N. F., Bluemke D. A., Bottomley P. A. (2007). Elevated tissue sodium concentration in malignant breast lesions detected with non-invasive 23Na MRI. Breast Cancer Res. Treat. 106, 151–160 [DOI] [PubMed] [Google Scholar]
- Oviedo N. J., Nicolas C. L., Adams D. S., Levin M. (2008). Live imaging of planarian membrane potential using DiBAC4(3). CSH Protoc. 2008, 5055. [DOI] [PMC free article] [PubMed] [Google Scholar]
- Pai V. P., Aw S., Shomrat T., Lemire J. M., Levin M. (2012). Transmembrane voltage potential controls embryonic eye patterning in Xenopus laevis. Development 139, 313–323 [DOI] [PMC free article] [PubMed] [Google Scholar]
- Pardo L. A., del Camino D., Sánchez A., Alves F., Brüggemann A., Beckh S., Stühmer W. (1999). Oncogenic potential of EAG K(+) channels. EMBO J. 18, 5540–5547 [DOI] [PMC free article] [PubMed] [Google Scholar]
- Pardo L. A., Contreras-Jurado C., Zientkowska M., Alves F., Stühmer W. (2005). Role of voltage-gated potassium channels in cancer. J. Membr. Biol. 205, 115–124 [DOI] [PubMed] [Google Scholar]
- Pei L., Wiser O., Slavin A., Mu D., Powers S., Jan L. Y., Hoey T. (2003). Oncogenic potential of TASK3 (Kcnk9) depends on K+channel function. Proc. Natl. Acad. Sci. USA 100, 7803–7807 [DOI] [PMC free article] [PubMed] [Google Scholar]
- Pereira C., Coutinho I., Soares J., Bessa C., Leão M., Saraiva L. (2012). New insights into cancer-related proteins provided by the yeast model. FEBS J. 279, 697–712 [DOI] [PubMed] [Google Scholar]
- Prevarskaya N., Skryma R., Shuba Y. (2010). Ion channels and the hallmarks of cancer. Trends Mol. Med. 16, 107–121 [DOI] [PubMed] [Google Scholar]
- Ring H., Mendu S. K., Shirazi-Fard S., Birnir B., Hallböök F. (2012). GABA maintains the proliferation of progenitors in the developing chick ciliary marginal zone and non-pigmented ciliary epithelium. PLoS ONE 7, e36874. [DOI] [PMC free article] [PubMed] [Google Scholar]
- Roepke T. K., Purtell K., King E. C., La Perle K. M., Lerner D. J., Abbott G. W. (2010). Targeted deletion of Kcne2 causes gastritis cystica profunda and gastric neoplasia. PLoS ONE 5, e11451. [DOI] [PMC free article] [PubMed] [Google Scholar]
- Roger S., Rollin J., Barascu A., Besson P., Raynal P. I., Iochmann S., Lei M., Bougnoux P., Gruel Y., Le Guennec J. Y. (2007). Voltage-gated sodium channels potentiate the invasive capacities of human non-small-cell lung cancer cell lines. Int. J. Biochem. Cell Biol. 39, 774–786 [DOI] [PubMed] [Google Scholar]
- Ross J. S., Fletcher J. A., Linette G. P., Stec J., Clark E., Ayers M., Symmans W. F., Pusztai L., Bloom K. J. (2003). The Her-2/neu gene and protein in breast cancer 2003: biomarker and target of therapy. Oncologist 8, 307–325 [DOI] [PubMed] [Google Scholar]
- Rubin H. (1985). Cancer as a dynamic developmental disorder. Cancer Res. 45, 2935–2942 [PubMed] [Google Scholar]
- Saito T., Schlegel R., Andresson T., Yuge L., Yamamoto M., Yamasaki H. (1998). Induction of cell transformation by mutated 16K vacuolar H+-ATPase (ductin) is accompanied by down-regulation of gap junctional intercellular communication and translocation of connexin 43 in NIH3T3 cells. Oncogene 17, 1673–1680 [DOI] [PubMed] [Google Scholar]
- Samowitz W. S., Sweeney C., Herrick J., Albertsen H., Levin T. R., Murtaugh M. A., Wolff R. K., Slattery M. L. (2005). Poor survival associated with the BRAF V600E mutation in microsatellite-stable colon cancers. Cancer Res. 65, 6063–6069 [DOI] [PubMed] [Google Scholar]
- Schönherr R. (2005). Clinical relevance of ion channels for diagnosis and therapy of cancer. J. Membr. Biol. 205, 175–184 [DOI] [PubMed] [Google Scholar]
- Sive H. L., Grainger R. M., Harland R. M. (2000) Early Development of Xenopus laevis: A Laboratory Manual. Cold Spring Harbor, NY: Cold Spring Harbor Laboratory Press [Google Scholar]
- Song J. H., Francis I. R., Platt J. F., Cohan R. H., Mohsin J., Kielb S. J., Korobkin M., Montie J. E. (2001). Bladder tumor detection at virtual cystoscopy. Radiology 218, 95–100 [DOI] [PubMed] [Google Scholar]
- Stratton M. R., Fisher C., Gusterson B. A., Cooper C. S. (1989). Detection of point mutations in N-ras and K-ras genes of human embryonal rhabdomyosarcomas using oligonucleotide probes and the polymerase chain reaction. Cancer Res. 49, 6324–6327 [PubMed] [Google Scholar]
- Stühmer W., Alves F., Hartung F., Zientkowska M., Pardo L. A. (2006). Potassium channels as tumour markers. FEBS Lett. 580, 2850–2852 [DOI] [PubMed] [Google Scholar]
- Sundelacruz S., Levin M., Kaplan D. L. (2008). Membrane potential controls adipogenic and osteogenic differentiation of mesenchymal stem cells. PLoS ONE 3, e3737. [DOI] [PMC free article] [PubMed] [Google Scholar]
- Sundelacruz S., Levin M., Kaplan D. L. (2009). Role of membrane potential in the regulation of cell proliferation and differentiation. Stem Cell Rev. 5, 231–246 [DOI] [PMC free article] [PubMed] [Google Scholar]
- Thompson I. M., Pauler D. K., Goodman P. J., Tangen C. M., Lucia M. S., Parnes H. L., Minasian L. M., Ford L. G., Lippman S. M., Crawford E. D., et al. (2004). Prevalence of prostate cancer among men with a prostate-specific antigen level ≤4.0 ng per milliliter. N. Engl. J. Med. 350, 2239–2246 [DOI] [PubMed] [Google Scholar]
- Tseng A.-S., Levin M. (2012). Transducing bioelectric signals into epigenetic pathways during tadpole tail regeneration. Anat. Rec. 295, 1541–1551 [DOI] [PMC free article] [PubMed] [Google Scholar]
- Vafa B., Lewis T. M., Cunningham A. M., Jacques P., Lynch J. W., Schofield P. R. (1999). Identification of a new ligand binding domain in the alpha1 subunit of the inhibitory glycine receptor. J. Neurochem. 73, 2158–2166 [PubMed] [Google Scholar]
- Vandenberg L. N., Morrie R. D., Adams D. S. (2011). V-ATPase-dependent ectodermal voltage and pH regionalization are required for craniofacial morphogenesis. Dev. Dyn. 240, 1889–1904 [DOI] [PMC free article] [PubMed] [Google Scholar]
- Waldner C., Roose M., Ryffel G. U. (2009). Red fluorescent Xenopus laevis: a new tool for grafting analysis. BMC Dev. Biol. 9, 37. [DOI] [PMC free article] [PubMed] [Google Scholar]
- Wallingford J. B., Seufert D. W., Virta V. C., Vize P. D. (1997). p53 activity is essential for normal development in Xenopus. Curr. Biol. 7, 747–757 [DOI] [PubMed] [Google Scholar]
- Wang J., Xu Y. Q., Liang Y. Y., Gongora R., Warnock D. G., Ma H. P. (2007). An intermediate-conductance Ca(2+)-activated K(+) channel mediates B lymphoma cell cycle progression induced by serum. Pflugers Arch. 454, 945–956 [DOI] [PubMed] [Google Scholar]
- Yang S., Lockwood A., Hollett P., Ford R., Kao K. (1998). Overexpression of a novel Xenopus rel mRNA gene induces tumors in early embryos. J. Biol. Chem. 273, 13746–13752 [DOI] [PubMed] [Google Scholar]
- Yoshida M., Kijima M., Akita M., Beppu T. (1990). Potent and specific inhibition of mammalian histone deacetylase both in vivo and in vitro by trichostatin A. J. Biol. Chem. 265, 17174–17179 [PubMed] [Google Scholar]
- Zernicka-Goetz M., Pines J., Ryan K., Siemering K. R., Haseloff J., Evans M. J., Gurdon J. B. (1996). An indelible lineage marker for Xenopus using a mutated green fluorescent protein. Development 122, 3719–3724 [DOI] [PubMed] [Google Scholar]