

SUMMARY
Obesity is a complex metabolic disorder that often manifests with a strong genetic component in humans. However, the genetic basis for obesity and the accompanying metabolic syndrome is poorly defined. At a metabolic level, obesity arises from an imbalance between the nutritional intake and energy utilization of an organism. Mechanisms that sense the metabolic state of the individual and convey this information to satiety centers help achieve this balance. Mutations in genes that alter or modify such signaling mechanisms are likely to lead to either obese individuals, who in mammals are at high risk for diabetes and cardiovascular disease, or excessively thin individuals with accompanying health problems. Here we show that Drosophila mutants for an intracellular calcium signaling channel, the inositol 1,4,5-trisphosphate receptor (InsP3R) store excess triglycerides in their fat bodies and become unnaturally obese on a normal diet. Although excess insulin signaling can rescue obesity in InsP3R mutants to some extent, we show that it is not the only cause of the defect. Through mass spectrometric analysis of lipids we find that homeostasis of storage and membrane lipids are altered in InsP3R mutants. Possibly as a compensatory mechanism, InsP3R mutant adults also feed excessively. Thus, reduced InsP3R function alters lipid metabolism and causes hyperphagia in adults. Together, the metabolic and behavioral changes lead to obesity. Our results implicate altered InsP3 signaling as a previously unknown causative factor for metabolic syndrome in humans. Importantly, our studies also suggest preventive dietary interventions.
INTRODUCTION
Obesity is characterized by excess body fat and arises from an imbalance between nutritional intake and energy utilization of an organism. Mechanisms that sense the metabolic state of the individual and convey this information to satiety centers help achieve this balance. Genetic factors that alter or modify such signaling mechanisms are likely to lead to obese individuals, who in mammals are at high risk for diabetes and cardiovascular disease (Marshall, 2006; DiPatrizio et al., 2011; Kir et al., 2011). Recent studies of human conditions and model organisms show that conserved signaling pathways related to energy metabolism can provide such feedbacks (Baker and Thummel, 2007; Géminard et al., 2009; Rajan and Perrimon, 2011). The inositol 1,4,5-trisphosphate receptor (InsP3R) is an intracellular calcium release channel that can be activated by multiple extracellular signals, including hormones and neurotransmitters. Neuronal deficits in InsP3R mutants are well defined in both vertebrates and invertebrates (Bezprozvanny, 2011; Chorna and Hasan, 2012). More recently, perturbations in glucose homeostasis and a trend towards high serum levels of triglycerides and free fatty acids have been observed in InsP3R1 mutant mice, thus implicating InsP3R-mediated Ca2+ release in metabolic control (Ye et al., 2011). Cellular studies in vertebrates suggest that InsP3-mediated Ca2+ release modulates pancreatic β-cell function and insulin release (Dyachok and Gylfe, 2004). A role for the InsP3R in Drosophila insulin-producing cells has been suggested in previous work from our group (Agrawal et al., 2009; Agrawal et al., 2010). Here, we directly investigate the effect of InsP3R mutants on insulin signaling and lipid metabolism in Drosophila. Our studies implicate the InsP3 receptor as a novel causative factor for metabolic syndrome.
RESULTS
InsP3 receptor mutants exhibit starvation resistance accompanied by excess body weight and fat deposits
Several classes of mutant alleles have been generated for the Drosophila InsP3R gene (itpr), including a set of hypomorphic single-point mutants, of which several hetero-allelic combinations are viable as adults (Joshi et al., 2004). Previous work with lethal and viable itpr mutant combinations has demonstrated a significant rescue of their phenotypes by expression of an itpr+ cDNA transgene in Drosophila insulin-like peptide (DILP)-producing neurons of the brain (insulin-producing cells, IPCs) (Agrawal et al., 2009; Agrawal et al., 2010). These neurons are located in the pars intercerebralis, which has been functionally equated with the hypothalamic region of the mammalian brain (Foltenyi et al., 2007). In both flies and mammals this region mediates stress and metabolic responses. Hence, adult viable itpr mutants were tested for their response to stress. The itpr mutant combinations tested were itprka1091/ug3 (itprku) and itprwc703/ug3 (itprwu). Cultured neurons from these mutant genotypes release significantly less Ca2+ upon InsP3 stimulation as compared with neurons from wild-type (Canton-S or CS) larvae, supporting their hypomorphic nature, and in addition exhibit reduced store-operated calcium entry (SOCE), indicating that both intracellular Ca2+ signaling through the IP3R and SOCE are compromised in these mutants (Venkiteswaran and Hasan, 2009). Expression of the wild-type itpr+ transgene in the DILP neurons of itprku can restore the observed pan-neuronal Ca2+ signaling deficits, possibly through a non-cell autonomous mechanism (Agrawal et al., 2010). Both itpr mutant combinations tested were resistant to starvation (Fig. 1A and supplementary material Fig. S1C,D), although their response to oxidative stress was no different from CS larvae (data not shown). Starvation resistance was rescued to wild-type levels by expression of an itpr+ transgene in brain IPCs (Fig. 1A and supplementary material Fig. S1A,C) and rescued partially by itpr+ expression in the fat body of itpr mutants (Fig. 1A and supplementary material Fig. S1D). In all genotypes, females survived longer than males under starvation (supplementary material Fig. S1B). Because itprku and itprwu adults showed very similar results, subsequent experiments were conducted with itprku females.
Fig. 1.

Obesity accompanied by increased triacylglyceride deposits in InsP3R mutants leads to starvation resistance. (A) Viability profile of wild-type (CS) adult female Drosophila and of the indicated genotypes upon starvation. Starvation profiles of control strains expressing itpr+ in IPCs and fat body cells of wild-type flies are shown in supplementary material Fig. S1C,D. IPC, insulin-producing cells; FB, fat body cells. (B) Nile Red (control, itprug3/+ and mutant, itprku) and Oil Red (itpr+ rescued itprku) stained lipid droplets in fat body cells of adult Drosophila. (C) Quantification of the number of Nile Red stained lipid droplets in mutant (itprku) and control (itprug3/+) fat body cells in fed (F) and starved (S) flies. The number of lipid droplets in 12 cells, selected randomly from three samples, is shown in the box plot. (D) The volume of 30 Nile Red stained lipid droplets obtained from three samples was calculated for each genotype (*P<0.05 as compared with fed control; Student’s t-test). (E) Average body weights of five adult females of the indicated genotypes at eclosion (0 hours), after 72 hours on a normal diet, or after 72 hours on a normal diet followed by 72 hours on either on a normal diet (F) or under starvation (S). Body weights of itprku were significantly higher than those of CS under similar conditions (*P<0.005; Student’s t-test).
TRANSLATIONAL IMPACT.
Clinical issue
In recent years, there has been an alarming increase in individuals suffering from metabolic syndrome. This syndrome manifests in most cases as obesity, which arises due to an imbalance in nutritional intake and energy utilization, followed by diabetes and cardiovascular disease. Although genetic bases for metabolic syndrome are indicated, identification of susceptibility genes has been lagging. Recent studies have focused on the role of conserved signaling pathways in maintaining a healthy energy balance, in an attempt to identify causative factors underlying obesity and the associated metabolic syndrome.
Results
In this work, the authors show that previously well-characterized Drosophila melanogaster strains with mutations affecting an intracellular Ca2+-release channel, the inositol 1,4,5-trisphosphate receptor (InsP3R), are obese as adults. In contrast with most existing animal models of obesity, which require a fat-enriched diet, the InsP3R mutants become obese on a normal diet. Obesity can be rescued in part by raising insulin signaling but, interestingly, the authors’ data show that reduced insulin signaling in InsP3R mutants is not the primary cause of obesity. By extensive lipid profiling of mutant, wild-type and rescued Drosophila using mass spectrometry, they identified changes in the metabolic profile of InsP3R mutants: a higher level of storage lipids (triacylglycerides; TAGs) and a reduced level of membrane lipids. The authors propose that this altered metabolic profile is primarily due to reduced metabolism of long chain fatty acids. In addition, the mutant flies were found to exhibit loss of appetite control, leading to excessive feeding (hyperphagia), as well as altered transcriptional regulation of mid-gut lipases. Pharmacological inhibition of a subset of these enzymes was found to reduce obesity and TAG deposits in the InsP3R mutants.
Implications and future directions
This study shows, for the first time, that mutations in InsP3R might be associated with adult-onset obesity. The Drosophila InsP3 mutants could prove to be a useful model for understanding the link between altered lipid metabolism and development of insulin resistance in humans. Furthermore, they can be used for the investigation of anti-obesity drugs, specifically those that target fatty-acid metabolism and TAG storage.
ILPs in Drosophila regulate physiological processes that are similar to those in vertebrates, including carbohydrate and lipid metabolism (Brogiolo et al., 2001; Geminard et al., 2006), and a major target tissue is the fat body. Therefore, stored lipids were visualized in abdominal fat body cells of fed and starved itprku by Nile Red staining (Fig. 1B) and by Oil Red staining (supplementary material Fig. S2). Remarkably, there was no visible change in lipid levels up to 72 hours after starvation in the abdominal fat body cells of itprku. In contrast, stored lipid levels in abdominal fat body cells were visibly reduced upon starvation in heterozygous controls as well as in animals rescued by itpr+ expression in the IPCs (Fig. 1B and supplementary material Fig. S2). On quantification of lipid droplets in the fat body cells of itprku mutants and itprug3/+controls, a significant increase in the number and volume of lipid droplets in fed mutants was observed, which was reduced upon starvation. However, starved mutants continued to have more droplets of greater volume than starved controls (Fig. 1C,D). itprku females were also obese, as judged by their increased body weights. Obesity was rescued completely by itpr+ expression in brain IPCs and partially by expression in fat body cells of itprku (Fig. 1E). A possible cause of obesity in itprku adults is their inability to fly (Banerjee et al., 2004). However, although loss of flight might be a contributing factor it is unlikely to be causative because subsequent data show that lipid metabolism in itpr mutants is altered, and this appears in part to be due to reduced levels of the insulin-like peptide DILP2 (see later). General locomotor function of itpr mutants in fed and starved conditions was assessed in a climbing assay. Whereas the climbing ability of itprku was slightly reduced as compared with controls in the fed condition, it was higher than controls under starvation (supplementary material Fig. S1E) indicating that elevated stored lipids in itprku do not correlate with inability to climb.
Next, triacylglycerol (TAG) levels in itpr mutant and rescued animals were estimated directly (Fig. 2 and supplementary material Fig. S3). At 0 hours post-eclosion, mutants and wild type have similar levels of TAGs. However, 3 days after feeding on a normal diet, the levels of TAGs in itprku were nearly double those of wild type (Fig. 2A). When adult flies were starved for 72 hours, TAG levels dropped significantly in wild type, but in itprku the drop was minimal (Fig. 2A). itpr+ rescue from brain IPCs restored abdominal lipid levels of fed and starved animals close to those of wild type (Fig. 2B), and itpr+ expression in the fat body gave a partial rescue (Fig. 2C). Similar results were obtained by estimation and quantification of abdominal TAGs by separation on thin layer chromatography plates (Fig. 2D and supplementary material Fig. S3).
Fig. 2.
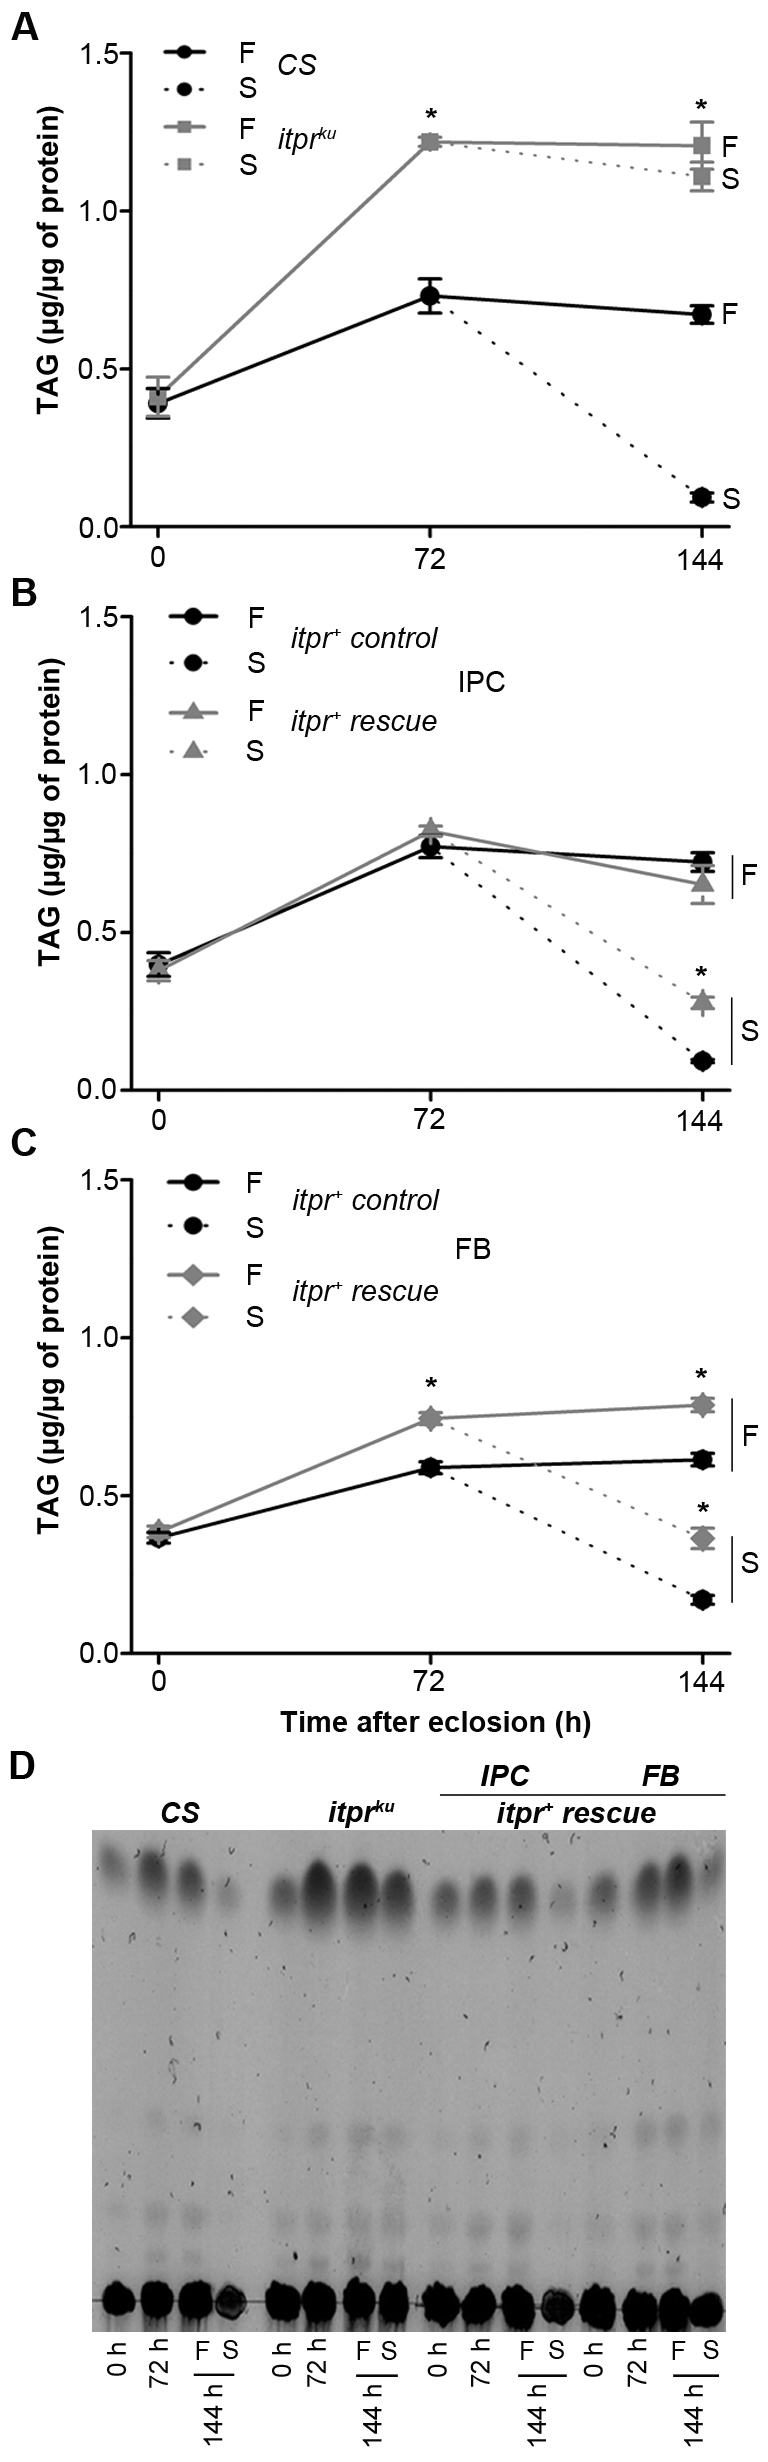
InsP3R mutants show increased levels of TAGs. (A–C) Quantification of TAG levels from abdomens of adult females of the indicated genotypes. Abdomens were isolated from flies maintained under similar nutritional conditions. Results are expressed as mean ± s.e.m. (*P<0.005 compared with CS; Student’s t-test). The starvation protocol was according to supplementary material Fig. S10A. (D) TLC of abdominal lipids from adult females of the indicated genotypes, maintained under similar conditions as for Fig. 1E. Densitometric quantification of TAGs from three similar TLCs is given in supplementary material Fig. S3. F, fed; S, starved; FB, fat body cells.
Increased insulin signaling reduces markers of metabolic syndrome in itpr mutants
To identify whether there is a direct effect on DILP2 synthesis or secretion in the IPCs of itprku, DILP2 immunoreactivity in the IPCs was measured in wild-type, mutant and itpr+ rescue conditions (Fig. 3). A significantly reduced level of DILP2 staining was observed in the IPC region of adult brains of itprku. The reduction was observed both in cell bodies (Fig. 3Ai,B,C) and axonal projections (Fig. 3Aii,B,D), indicating reduced synthesis leading to reduced secretion of DILP2. The DILP2 staining was rescued to normal levels by itpr+ expression in the IPCs. A well-characterized phenotype of reduced insulin signaling is smaller flies (Böhni et al., 1999). We therefore measured the size of 1-day-old itprku females and compared them with wild-type flies aged similarly and grown under similar conditions. Although the overall size of itprku adult females appeared similar to controls (supplementary material Fig. S4A,C), a small but significant reduction in their wing size (as measured by length, breadth and area) was observed (supplementary material Fig. S4D,E). Reduction in size appears to be a growth defect and not due to fewer cells because the number of sensory hairs along the wing margin of itprku were not significantly different from controls (supplementary material Fig. S4F). These data support a systemic downregulation of insulin signaling in itprku.
Fig. 3.

Reduced DILP2 levels in the IPCs of itprku brains. (A) Dilp2 antibody staining in brains of CS, itprku and itpr+ rescue (UASitpr+/+; Dilp2GAL4/+; itprku). Images show (i) 6–7 DILP2-positive cell bodies from confocal stacks, 33–48 of each genotype, with a single confocal step size of 0.65 μm and (ii) DILP2-positive axonal projections from confocal stacks, 1–17, step size of 0.65 μm. (B) Quantification of average ΔF/F in the cell bodies and projections of indicated genotypes, calculated from ten independent brains of each genotype. DILP2 staining in cell bodies and projections is significantly reduced (*P<0.05 compared with CS; Student’s t-test). (C,D) Staining intensity, measured as ΔF/F across all confocal stacks of a single sample brain from each genotype, shows reduced intensity in itprku across cell bodies and projections.
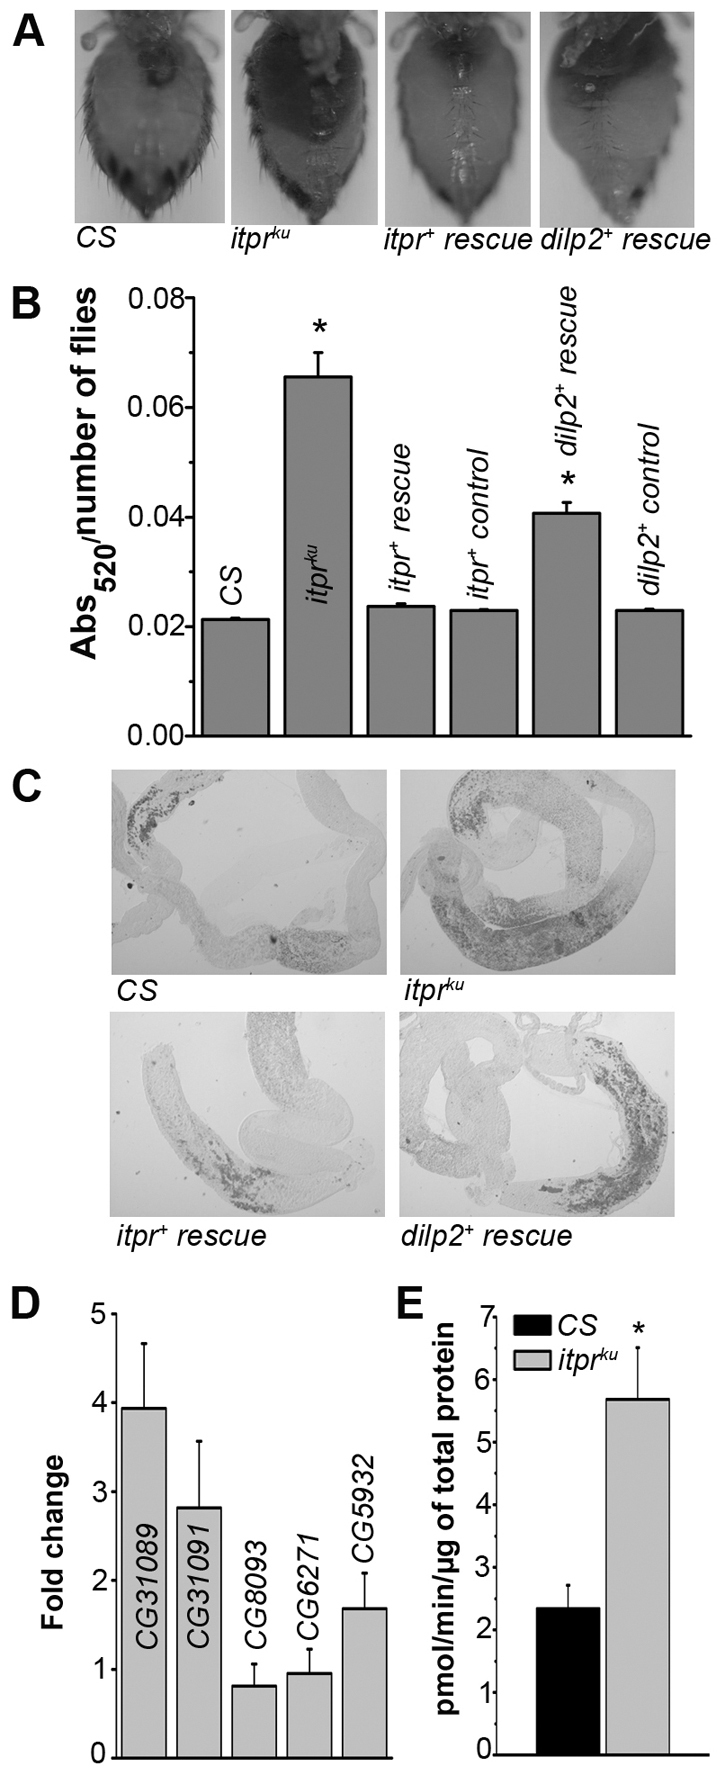
The IPCs are a part of the medial neurosecretory cells (mNSCs) in the pars intercereberalis region of the brain. In addition to DILP2 and other DILPs, the mNSCs are also known to secrete neuropeptides such as Drosulfakinin (Park et al., 2008), FMRFamide (Nässel, 2002) and the epidermal growth factor receptor ligand, Rhomboid (Foltenyi et al., 2007). To directly assess the role of reduced ILP synthesis on the metabolic phenotypes of itprku, insulin signaling was raised by various means in either the IPCs or the fat body of itprku. The Drosophila insulin-like peptide 2 (DILP2), which has the highest homology with human insulin (Brogiolo et al., 2001), was expressed in brain IPCs of itprku mutants and controls. dilp2+ expression in brain IPCs rescued starvation resistance and mobilization of TAGs from abdominal fat body cells of itprku to wild-type levels (Fig. 4A,B). However, excess body weight and stored TAG levels were rescued only partially (Fig. 4D and supplementary material Fig. S5C), indicating that raised DILP2 expression is insufficient for complete rescue of itpr mutant deficits.
Fig. 4.

Ectopic insulin signaling in InsP3R mutants increases TAG utilization upon starvation. (A) Starvation profile of itprku with overexpression of either a dilp2+ transgene in the IPCs or overexpression of a PI3KDA isoform in adult fat body and appropriate controls, as described below. (B) TAG levels in the abdomen of itprku adult females overexpressing dilp2+ in the IPCs, under fed (F) and starved (S) conditions. The control was Dilp2GAL4/UASdilp2+; itprug3/+ (C) TAG levels in the abdomen of itprku adult females overexpressing PI3KDA in adult fat body (FB), under fed (F) and starved (S) conditions. The control strain was UASPI3KDA/2XGal80ts; c729GAL4,itprug3/+, which drives PI3KDA expression in adult fat body at the restrictive temperature of 29°C (for B and C, *P<0.005, compared with controls at the same time-points). (D) Bodyweights of itprku expressing dilp2+ and PI3KDA are rescued partially (*P<0.005 compared with itprku at the corresponding time in Fig. 1E; Student’s t-test). Conditions as described for Fig. 1E.
Next, the effect of raised insulin signaling in the fat body was assessed by expression of a dominant active form of the catalytic subunit of PI3 kinase (PI3KDA; Britton et al., 2002) in the adult fat body of itprku. Expression of PI3KDA led to reduced starvation resistance (Fig. 4A), reduced levels of stored TAGs and their mobilization upon starvation, as compared with itprku (Fig. 4C). Expression of other known modulators and effectors of insulin signaling, such as a transgene for dominant negative JNK (UASBskDN; Wang et al., 2005) in the IPCs and an RNAi construct for Thor (Baker and Thummel, 2007) in the fat body, also reduced starvation resistance in itprku (supplementary material Fig. S5A,B). Expression of the dominant negative JNK in the IPCs has been shown to upregulate DILP production (Wang et al., 2005) whereas Thor downregulation in the fat bodies is a well-characterized downstream effect of insulin signaling in Drosophila. Significantly, in all conditions of raised insulin signaling, an incomplete rescue of obesity was observed (Fig. 4D). These data support the idea that metabolic phenotypes in itprku are only partially due to reduced insulin signaling. However, because the downstream effectors of insulin signaling tested here can have pleiotropic effects, these data do not discount the possibility that the observed suppression by dominant active PI3K, dominant negative JNK and Thor RNAi, is through non-insulin signaling mechanisms.
A deficit in long chain fatty acids leads to an imbalance of storage and membrane lipids in itprku
To begin understanding the underlying cause of obesity in itprku, a mass spectrometric (MS) analysis of stored TAGs was undertaken in fed and starved conditions (Fig. 5) (Schwudke et al., 2006; Entchev et al., 2008). From this analysis it was apparent that starved CS utilized short chain TAGs preferentially upon starvation, resulting in the proportionate increase in long-chain TAGs of chain lengths 48:2 and higher. In contrast, no difference was observed in the TAG profiles of itprku upon starvation. Tandem mass spectrometry (MS/MS) analysis of the TAG fraction showed that the proportion of long chain fatty acids (LCFAs) including 18:0 (stearic acid), 18:1 (oleic acid) and 18:2 (linoleic acid) increased in starved CS (Fig. 5A), whereas the proportion of LCFAs (C18:0 or greater) remained the same or showed a tendency to decrease in itprku starved adults, suggesting a metabolic defect in LCFAs synthesis or utilization under starvation (Fig. 5B). Expression of itpr+ in the IPCs of itprku partially restored the profile of TAGs and their constituent fatty acids close to that of the wild type under starvation (Fig. 5C). No significant difference between TAGs and fatty acids of fed and starved conditions was observed in the dilp2+ rescue (Fig. 5D). These data are in keeping with the differential rescue of itprku obesity by itpr+ and dilp2+ (Fig. 1E; Fig. 4D).
Fig. 5.

Long chain TAGs and fatty acids are utilized differentially upon starvation in wild-type and itprku adults. (A–D) TAG profiles (left) and fatty acid content (right) in abdomen of the indicated genotypes under 144 hours fed (F) and 72 hours fed plus 72 hours starved (S) conditions. TAG levels were normalized to the most abundant TAG 46:1, which was set to 100%. (A) CS flies retain longer chain TAGs under starvation (arrows), whereas (B) in itprku flies long and short chain TAGs remain the same in both conditions. A corresponding change is observed in the fatty acid content (FA) of TAGs. Abundance of fatty acids was derived from MS/MS analysis of abdominal TAG fractions and normalized to the most abundant FA (14:0). On starvation, wild-type flies (CS) show increased levels of FA 18:0, 18:1 and 18:2, 18:3 and 20:0 (*P<0.05, ANOVA, post-hoc Bonferroni test). This differential utilization of TAGs with short chain fatty acids is absent in itprku. (C) Expression of an itpr+ cDNA in the IPCs of itprku restored TAG and FA profiles back to those of the wild type, whereas (D) dilp2+ overexpression (panels marked as rescue) in IPCs restored TAG and FA profiles partially.
In part, the differential rescues might reflect the effect of overexpressing the individual transgenes on lipid metabolism. Specifically, although itpr+ overexpression in wild-type controls leads to a higher abundance of C16:0 (palmitic acid)-containing TAGs under starvation, dilp2+ overexpression in wild type affects the relative abundance of multiple TAGs and fatty acids upon starvation (supplementary material Fig. S6). Because the fatty acid abundance was calculated relative to the most abundant fatty acid (C14:0), these data show that C14:0-containing TAGs are preferentially utilized under starvation by dilp2+ overexpression (supplementary material Fig. S6). MS analysis of the abdominal TAG fraction established that the TAG metabolism of itpr mutants was abnormal and related to altered LCFA metabolism. Interestingly, MS analysis of TAGs from wild-type heads demonstrated that preferential utilization of short-chain TAGs under starvation is restricted to abdominal TAGs. Moreover, both in mutant and rescued genotypes, head TAG profiles remained unaffected by starvation (supplementary material Fig. S7).
Because LCFAs are essential building blocks for membrane lipids, a complete lipid profile of CS and itprku was obtained from the pupal stage prior to the deposition of excess TAGs in the fat body. A shotgun lipidomics approach enabled quantification of 176 lipids in eight classes (supplementary material Table S1). Analysis of this dataset pointed to a global perturbation of the lipidome manifested by a significant increase in TAGs in itprku pupae (Fig. 6A). Consequently, the ratio of all membrane lipid classes to neutral storage lipids like TAGs was reduced in itprku (Fig. 6B). The itprku genotype showed no significant change in the amount of membrane lipids normalized to total protein content compared with the wild type, suggesting that the primary defect for itpr mutants is a malfunctioned lipid homeostasis (supplementary material Fig. S8A). In adult itprku on a normal diet, altered lipid homeostasis manifests as a threefold increase in TAGs after 144 hours (Fig. 2A) and consequent obesity (Fig. 1E). These lipidomics data are supported by the microscopic data shown in Fig. 1, where an increased size in lipid droplets was observed in itprku mutants. The cause for this obesity was investigated next.
Fig. 6.
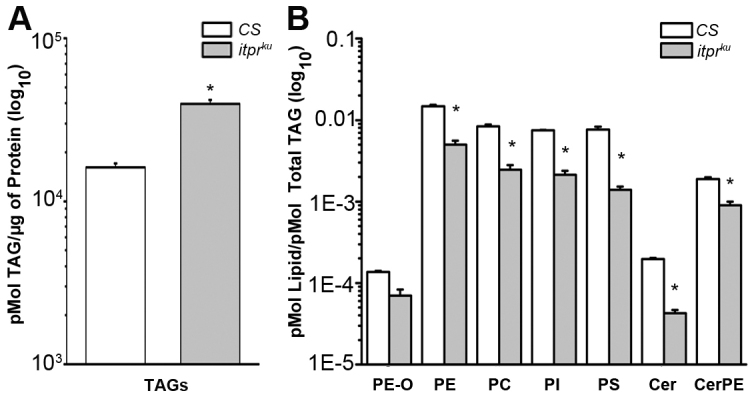
Homeostasis of storage and membrane lipids is altered in itprku pupae. (A) The ratio of TAGs to total protein in itprku pupae was higher than in CS pupae. (B) Selected membrane lipid classes in itprku pupae were significantly reduced as compared with total TAGs. PE-O, phosphatidylethanolamineethers; PE, phosphatidylethanolamines; PC, phosphatidylcholines; PI, phosphatidylinositols; PS, phosphatidylserines; Cer, ceramides; CerPE, ceramide phosphorylethanolamines. *P<0.05 as compared with CS, ANOVA, post-hoc Bonferroni test.
Obesity in itpr mutants arises from excess feeding and accompanying changes in TAG metabolism
In addition to insulin-like peptides, it is known that the IPCs synthesize other neuropeptides, some of which can regulate appetite (Nässel, 2002; Park et al., 2008). To test whether loss of appetite control was a causative factor in the excessive obesity that occurred post-eclosion in itprku, food intake by CS and itprku adult females was measured (Fig. 7A,B). itprku females ingest three times more food than CS, and this hyperphagia was rescued completely by itpr+ expression in IPCs, but only partially by dilp2+ expression, supporting the idea that factors other than ILPs contribute to the loss of appetite control in itprku. Hyperphagia was accompanied by deposition of excess neutral lipids in the mid-gut epithelium (Fig. 7C; supplementary material Fig. S9A) and upregulation of three mid-gut lipase genes (Fig. 7D; supplementary material Fig. S9B), as well as higher mid-gut lipase activity (Fig. 7E). To test whether higher lipase activity was indeed instrumental in generating higher TAG deposits in itprku, inhibition of mid-gut lipases was attempted by introducing a lipase inhibitor, Orlistat (Sieber and Thummel, 2009) in the diet of CS and itprku adults. A significant reduction in resistance to starvation was observed for both CS and itprku on Orlistat-supplemented media as compared with normal media (Fig. 8A). This was accompanied by significant reduction in abdominal TAGs in both genotypes, though in itprku TAGs did not reduce to wild-type levels (Fig. 8B). Comparison of TAGs in the mid-gut and fat body of CS and itprku established that Orlistat action was localized to the mid-gut (Fig. 8C).
Fig. 7.
Loss of appetite control in itprku. (A) Abdomens of the indicated genotypes after ingesting food supplemented with an edible red dye. (B) Spectrophotometric quantification of ingested red dye in abdominal lysates of the indicated genotypes. The feeding protocol was according to supplementary material Fig. S10B. (C) Oil Red-O staining of neutral lipids, primarily TAGs, in the fed mid-gut of indicated genotypes. (D) qPCR data. RNA extracted from mid-guts was tested for selected adult mid-gut lipase-encoding genes. (E) Specific lipase activity measured in lysates from adult mid-guts. *P<0.005 as compared with CS; Student’s t-test.
Fig. 8.
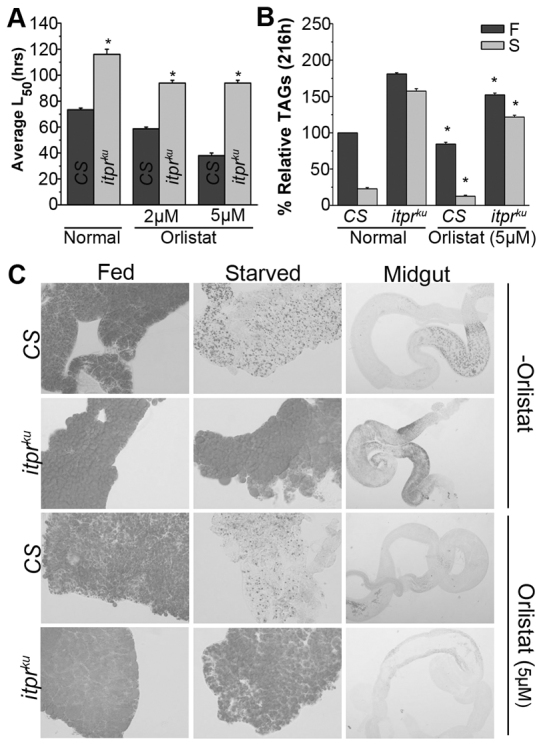
Effects of pharmacological inhibition of lipase activity on CS and itprku. Orlistat feeding of CS and itprku significantly reduced (A) starvation resistance and (B) TAG levels. L50 is the time in hours at which 50% of animals die upon starvation. All comparisons are within the same genotype with and without Orlistat; *P<0.005, Student’s t-test. (C) Feeding of a lipase inhibitor (Orlistat, 5 μm) reduced TAG deposits in itprku mid-guts as shown by Oil Red staining of neutral lipids.
DISCUSSION
Rescue of obesity by InsP3R expression in brain IPCs initially suggested that reduced insulin signaling in hypomorphic itpr mutants (itprku and itprwu) could be the primary cause of obesity. However, several lines of evidence show that the metabolic phenotype in InsP3 receptor mutants is more complex. Although itpr+ expression in the IPCs is sufficient for bringing excess TAG stores back to normal, expression of dilp2+ is unable to completely restore to wild-type levels the lipid and carbohydrate metabolism phenotypes of itpr mutants. Moreover, the hyperphagic phenotype of itpr mutants has not been observed in mutants with reduced insulin signaling to date. Thus, reduced insulin signaling appears to be only partially responsible for the metabolic phenotypes of itprku.
Lipidomics analysis helped identify a deficiency in LCFAs and an imbalance between TAG and membrane lipid synthesis as primary metabolic defects in itprku. Our data support the idea that the imbalance derives from a reduced ability to synthesize LCFAs. Although the drop in LCFAs in starved itprku could be due to reduced utilization of short chain TAGs, we consider this unlikely primarily because we did not find any difference in the regulation of Brummer lipase in CS and itprku (data not shown). The Brummer lipase in Drosophila is a homolog of the human adipocyte triglyceride lipase (ATGL) and loss of Brummer activity can lead to obese flies (Grönke et al., 2005). The precise mechanism by which intracellular Ca2+ release through the InsP3R regulates the synthesis of an LCFA needs further investigation. The initial imbalance between TAGs and membrane lipids observed in pupae becomes more exaggerated in adults. We propose that the imbalance between membrane lipids and TAGs affects the feedback loop for appetite control, leading to hyperphagia, altered regulation of TAG metabolism enzymes and, finally, obesity. However, a direct effect of InsP3R function on mechanisms of appetite control is also possible. In strong itpr mutants, larval lethality is preceded by cessation of feeding (Agrawal et al., 2009). The opposite behavior that is observed in adult viable itpr mutants, such as itprku described here, might be due to compensatory mechanisms that lead to overeating. Interestingly, medial neurosecretory cells of the Drosophila brain, including the IPCs, project to a region of the brain, the suboesophageal ganglion, that is known to control feeding behavior (Melcher and Pankratz, 2005). It is known from previous work that InsP3-mediated Ca2+ release and SOCE are significantly reduced in cultured neurons from itprku (Venkiteswaran and Hasan, 2009; Agrawal et al., 2010). Thus, InsP3-mediated Ca2+ signals in the IPCs could modulate neural circuits for feeding.
Our discovery that reduced InsP3 signaling leads to obesity through altered lipid metabolism is significant given that, in humans, early alteration in pathways of essential fatty acid synthesis have been associated with individuals at high risk for developing Type 2 diabetes (Lucio et al., 2010). Drosophila InsP3 mutants could prove to be a useful model for understanding the link between altered lipid metabolism and development of insulin resistance in humans.
MATERIALS AND METHODS
Drosophila strains
itprka1091/ug3 (itprku) and itprwc703/ug3 (itprwu) are heteroallelic combinations of single point mutants in the itpr gene that were generated in an EMS (ethyl methane sulfonate) screen (Joshi et al., 2004). The embryonic wild-type itpr cDNA (UASitpr+; Venkatesh et al., 2001) was used for rescue experiments. itpr RNAi experiments were done with an UASdsitpr strain (1063R-2) obtained from the National Institute of Genetics, Kyoto, Japan. The Dilp2GAL4 strain, used for most experiments, was obtained from Eric Rulifson, HHMI, Stanford University, CA (Rulifson et al., 2002). In addition, the Dilp2-3GAL4 strain (Ikeya et al., 2002) was also used in a few experiments as indicated. Additional GAL4 strains used were a fat body GAL4 c729GAL4 (Petersen et al., 1999), a pan-neuronal GAL4 ElavC155GAL4 (Lin and Goodman, 1994) and a peptidergic neuron GAL4, dimmedGAL4 (Hewes et al., 2003). Other strains used were UASdilp2+ (Brogiolo et al., 2001), UASmycDp110CAAX (Leevers et al., 1996), UASBskDN (Wang et al., 2003), Thor1, a deletion mutant for 4E-BP (Bernal and Kimbrell, 2000), dsThor (Vienna Drosophila RNAi Center, Austria) and Gal80ts (Drosophila Stock Center, Bloomington, IN). Genetic combinations of these strains were generated as follows: UASitpr+/+; Dilp2GAL4/+;itprka1091/ug3(itpr+ rescue – IPC); UASitpr+/+;Dilp2GAL4;itprwc703/ug3, UASitpr+/+; +/+; c729GAL4-itprka1091/ug3(itpr+ rescue – FB), UASitpr+/+; +/+; c729GAL4-itprwc703/ug3, UASdilp2+/Dilp2GAL4; itprka1091/ug3 (dilp2 rescue), UASmycDp110CAAX/GAL80ts,GAL80ts; c729GAL4-itprka1091/ug3 (PI3KDA rescue), UASBskDN/+; Dilp2GAL4/+;itprka1091/ug3 (BskDN rescue), dsThor/c729GAL4-itprka1091/ug3 (dsThor::FB).
Starvation assays and dietary treatments
Flies were grown on normal food with 80 g corn flour, 20 g D-glucose, 40 g sucrose, 8 g agar and 15 g yeast extract in a total volume of 1 l. They were aged on the same food for 3 days and the starvation assay was carried out as described in the legend to Fig. 1 and in supplementary material Fig. S10A. Treatment with Orlistat (Sigma-Aldrich Corporation, Bangalore, India) was conducted by growing flies on normal food with 2 or 5 μM Orlistat for 5–7 days (Sieber and Thummel, 2009) (supplementary material Fig. S10C).
Nile Red and Oil Red staining of neutral lipids
Fat body tissues were removed from female flies, fixed in phosphate buffered saline (PBS) containing 4% paraformaldehyde for 20 minutes at 25°C, mounted in 50% glycerol containing Nile Red at a dilution of 1:55,000. Lipid droplets were visualized on an Olympus Confocal FV1000 microscope with 543 nm excitation and 600–657 nm emission; 488 nm excitation and 500–541 nm emission was used for GFP. Confocal sections of 1 μm were obtained. The genotype used for visualizing lipid droplets and fat body cell membranes was UASmcd8GFP, itprka1091/c729GAL4, itprug3. The control genotype was UASmcd8GFP/c729GAL4, itprug3. For Oil Red O staining, fixed and washed specimens were incubated for 20–30 minutes in 0.1% Oil Red O stain, washed in PBS and mounted in 60% glycerol. Photographs were obtained on the Olympus BX60 with an Evolution VF camera.
Quantification of lipid droplets
Lipid droplet number was determined by manually counting the number of droplets across confocal stacks of four cells of approximately the same size from three independent samples. Thus, for each genotype lipid droplets from a total of 12 cells were counted, using the cell counter plug-in from Image J, v1.44 (National Institutes of Health, Bethesda, MD). The volume was estimated for ten lipid droplets, each chosen randomly from three independent samples. The shape of the lipid droplet was assumed to be ellipsoidal. Measurements of x, y and z axes were done using the line selection tool in Image J v1.44. Values obtained from these measurements were plotted using the box-plot option from Origin 7.5 (Microcal, OriginLab, Northampton, MA), in which the quartiles represent the 25th to 75th percentile.
DILP2 immunostaining and quantification
Immunohistochemistry was performed on dissected brains from 3-day-old fed adult Drosophila females of the following three genotypes: CS, itprku and UASitpr+/+; Dilp2Gal4/+; itprku (itpr+ rescue – IPC) after fixing the dissected tissue in 4% paraformaldehyde. The brains were incubated overnight with rat anti-Dilp2 antibody (1:400, provided by Pierre Leopold, University of Nice-Sophia Antipolis, France). Anti-rat Alexa Fluor 633 (1:400, Molecular Probes, Eugene, OR) was used as fluorescent secondary antibody. Confocal analysis was performed on an Olympus Confocal FV1000 microscope using a 40× 1.3 NA objective with a step-size of 0.65 μm. Confocal images were acquired as stacks and visualized as three-dimensional projections using the FV10-ASW 1.3 viewer (Olympus Corporation, Tokyo, Japan). A region of interest was drawn around the IPCs and their fluorescent intensity (FC) was measured from individual confocal stacks using ImageJ. Mean fluorescent intensity for IPCs in an individual brain was calculated by taking the sum of the intensity of all confocal stacks and dividing by the total number of confocal sections in the analysis. Separately, mean fluorescent intensity of an area without any cells (F) was calculated for each confocal slice. For each brain, F was subtracted from FC to obtain ΔF across all confocal slices. ΔF/F=(FC–F)/F was calculated for each brain and plotted using Origin 7.5. ΔF/F values were calculated for each genotype from ten individual samples and plotted as a box-plot using Origin 7.5 as described above.
TAG assays
TAGs were estimated with a Triglyceride Reagent Kit (GPO-ESPAS, Ranbaxy Diagnostic Limited, India) in homogenates from Drosophila abdomens and heads. Homogenates were prepared by homogenization of ten individual heads or abdomens in 300 μl of homogenizing buffer containing 10 mM Tris, 1 mM EDTA and 0.1% Triton-X 100. The homogenate was centrifuged at 4000 rpm for 15 minutes at 4°C in an Eppendorf 5417R centrifuge (Eppendorf, Hamburg, Germany). Each assay consisted of a minimum of three independent homogenates. The samples were assayed using a spectrophotometer (Thermo/Milton Roy Spectronic Genesys 5) at 546 nm. TAG levels were normalized to protein levels.
Protein assays
For all sample homogenates, total protein content was determined using a Bicinchoninic Acid Kit (Sigma-Aldrich) following the manufacturer’s instructions.
Thin layer chromatography
Sample homogenates were derived from the same homogenates used for biochemical assays. These were directly spotted on 20-cm square glass TLC plates covered with a Silica matrix (Z292974, Sigma-Aldrich). TAGs were separated with a 70:30:1 v/v/v mixture of hexane, diethyl ether and acetic acid as the mobile phase. The sample volumes loaded on the TLC were standardized to be equivalent to 50 μg of protein. For each sample, two identical TLC plates were run simultaneously. One TLC plate was used for visualizing lipid bands by spraying the plates with 15% H2SO4 in ethanol and then charring at 200°C. TAG bands from this plate were scanned and quantified using ImageJ software. The other TLC plate was sprayed with water and the TAG bands marked and scraped from the plate.
TAG extraction from TLC plates
TAGs were extracted from silica obtained from scraped TLC plates following a published protocol (Matyash et al., 2008). Briefly, 150 μl of methanol was added to the silica followed by 20 μl of 8 μM 1,2,3-triheptad TAG (17:0) and the mixture vortexed for 20 minutes. After addition of 500 μl of methyl-tert-butyl ether (MTBE), the mixture was vortexed for 1 hour at room temperature. Phase separation was induced by adding 125 μl of MS-grade water and centrifugation. The upper organic phase was diluted in CHCl3/MeOH/2-propanol 1/2/4 (v/v/v) containing 7.5 mM ammonium acetate at a ratio of 1:40 (v/v). For samples collected from CS, itpr+ rescued and dilp2+ rescued flies under starvation, the upper phase was diluted 1:10 (v/v) to obtain a similar total ion count (TIC) in the mass spectrometry.
Lipid extraction from pupae
Lipid extraction from pupae was performed as described previously (Matyash et al., 2008). Briefly, the pupae were snap-frozen in liquid nitrogen and crushed using a micro-pestle. Methanol (150 μl) was added to the powdered pupae followed by the addition of 20 μl of an internal standard mix (given in supplementary material Table S2). All the internal standards were purchased from Avanti Polar Lipids (Alabama), except 1,2,3-triheptad TAG (17:0), which was obtained from Sigma-Aldrich. MTBE (500 μl) was added and the mixture was vortexed for 1 hour at room temperature. Phase separation was induced as described above for TAGs. The upper organic phase was dried in a speed vacuum and reconstituted in 250 μl of CHCl3/MeOH/2-propanol 1/2/4 (v/v/v) containing 7.5 mM ammonium acetate. If required, this was stored at −20°C and used directly for mass spectrometric analysis. For estimation of protein in the pupal samples, the lower aqueous phase was dried and reconstituted in 50 μl of buffer containing 10 mM Tris, 1 mM EDTA and 0.1% Triton-X 100. A sample (3 μl) was used for protein estimation as described above.
Mass spectrometry
All MS experiments were performed on a LTQ Orbitrap-XL mass spectrometer (Thermo Fisher Scientific, Bremen, Germany) equipped with a robotic ion source NanoMate (Advion BioSciences, Ithaca, NY). The samples were analyzed by direct infusion electrospray ionization (ESI) mass spectrometry as described earlier (Schwudke et al., 2007). For analysis of triglycerides, data-dependent acquisition (DDA) experiments were performed in positive mode. MS survey scans were acquired in the orbitrap analyzer under mass resolution of 100,000 (full width at half maximum or FWHM, defined at m/z 400). MS/MS experiments were performed using collision-induced dissociation in the linear ion trap, and the fragment ions were detected in the orbitrap analyzer operated under the target mass resolution of 30,000 (FWHM, defined at m/z 400). Lipid extracts from pupae were analyzed both in positive and negative ionization modes separately. MS acquisitions with spray stability better than ±20% of the TIC for TAG measurements and better than ±15% of the TIC for pupal extracts, were processed further for data analysis. Lipids were identified using LipidXplorer (Herzog et al., 2011). All applied MFQL-scripts can be found at https://wiki.mpi-cbg.de/wiki/lipidx/index.php/MFQL_library. Complete datasets will be made available at http://lipidomics.ncbs.res.in/lipidomics.
Quantification of feeding
After feeding on red dye, abdomens from three batches of each genotype, with each batch containing five flies, were dissected and placed in Eppendorf tubes and immediately frozen in liquid nitrogen. The abdomens were homogenized in PBS and centrifuged in an Eppendorf microfuge at 14,000 rpm for 5 minutes. The supernatant was transferred to a fresh tube, mixed with 500 μl PBS and absorbance of the red dye read at 520 nm (Agrawal et al., 2009). Lysates from flies fed on sucrose plus 1% agar were used as blanks for absorbance at 520 nm.
Quantitative RT-PCR
Flies of the indicated genotypes were selected 144 hours after eclosion and their fat-bodies and mid-guts were dissected. RNA was extracted from fat bodies obtained from three batches of five individual flies each; mid-gut RNA was extracted from three batches of three individual flies each. Total RNA for quantitative PCR analysis was extracted as described previously (Agrawal et al., 2009). Sequences of the primers used for the analysis are given in supplementary material Table S3. Real-time quantitative PCR (qPCR) was performed on the Rotor-Gene 3000 (Corbett Research, Sydney, Australia) operated with Rotor Gene software version 6.0.93 using Mesa Green qPCR MasterMIX Plus for SYBR® Assay I dTTp (Eurogentec, Seraing, Belgium). Experiments were performed with rp49 primers as internal controls and primers specific to the gene of interest, using serial dilutions for the cDNA of 1:10, 1:100 and 1:1000.
Lipase assay
Endogenous lipase activity was quantified from homogenized mid-guts using a Lipase Assay Activity Kit (K722-100; Biovision, Mountain View, CA) following the manufacturer’s instructions. Mid-gut homogenates (from five dissected mid-guts) were obtained by adding 20 μl of assay buffer to the dissected mid-guts followed by a cycle of freeze-thaw in liquid nitrogen and sonication. The lipase assay was done with 2 μl of this homogenate from a total of three batches for each genotype.
Statistical analysis
Computation of means, s.e.m., Student’s t-tests and box-plot analyses were performed using Origin 7.5 and 8.6 (Microcal). ANOVA post-hoc Bonferroni test was used for testing significance in all the MS. All error bars in all figures represent the s.e.m. In the box plots the whiskers represent the 5th to 95th percentile range.
Supplementary Material
Acknowledgments
We thank Shlesha Richhariya for help with the qPCRs, Siddharth Jayakumar for help with quantification of lipid droplets and Swarna Mathre for her help with confocal microscopy.
Footnotes
COMPETING INTERESTS
The authors declare that they do not have any competing or financial interests.
AUTHOR CONTRIBUTIONS
Experiments were performed by M.S., S.K.M., S.S. and S.K. G.H. and D.S. supervised the project. The manuscript was written by G.H. with help from M.S., S.K.M., S.S. and D.S.
FUNDING
This work was supported by grants from the Dept. of Biotechnology and Dept. of Science and Technology, Govt. of India to G.H. D.S. is supported by a Wellcome Trust/DBT India Alliance senior fellowship and is a recipient of NCBS–Merck & Co International Investigator Award. M.S. was supported by an ICMR fellowship and S.S. and S.K. by CSIR fellowships.
SUPPLEMENTARY MATERIAL
Supplementary material for this article is available at http://dmm.biologists.org/lookup/suppl/doi:10.1242/dmm.010017/-/DC1
REFERENCES
- Agrawal N., Padmanabhan N., Hasan G. (2009). Inositol 1,4,5-trisphosphate receptor function in Drosophila insulin producing cells. PLoS ONE 4, e6652. [DOI] [PMC free article] [PubMed] [Google Scholar]
- Agrawal N., Venkiteswaran G., Sadaf S., Padmanabhan N., Banerjee S., Hasan G. (2010). Inositol 1,4,5-trisphosphate receptor and dSTIM function in Drosophila insulin-producing neurons regulates systemic intracellular calcium homeostasis and flight. J. Neurosci. 30, 1301–1313 [DOI] [PMC free article] [PubMed] [Google Scholar]
- Baker K. D., Thummel C. S. (2007). Diabetic larvae and obese flies-emerging studies of metabolism in Drosophila. Cell Metab. 6, 257–266 [DOI] [PMC free article] [PubMed] [Google Scholar]
- Banerjee S., Lee J., Venkatesh K., Wu C.-F., Hasan G. (2004). Loss of flight and associated neuronal rhythmicity in inositol 1,4,5-trisphosphate receptor mutants of Drosophila. J. Neurosci. 24, 7869–7878 [DOI] [PMC free article] [PubMed] [Google Scholar]
- Bernal A., Kimbrell D. A. (2000). Drosophila Thor participates in host immune defense and connects a translational regulator with innate immunity. Proc. Natl. Acad. Sci. USA 97, 6019–6024 [DOI] [PMC free article] [PubMed] [Google Scholar]
- Bezprozvanny I. (2011). Role of inositol 1,4,5-trisphosphate receptors in pathogenesis of Huntington’s disease and spinocerebellar ataxias. Neurochem. Res. 36, 1186–1197 [DOI] [PMC free article] [PubMed] [Google Scholar]
- Böhni R., Riesgo-Escovar J., Oldham S., Brogiolo W., Stocker H., Andruss B. F., Beckingham K., Hafen E. (1999). Autonomous control of cell and organ size by CHICO, a Drosophila homolog of vertebrate IRS1-4. Cell 97, 865–875 [DOI] [PubMed] [Google Scholar]
- Britton J. S., Lockwood W. K., Li L., Cohen S. M., Edgar B. A. (2002). Drosophila’s insulin/PI3-kinase pathway coordinates cellular metabolism with nutritional conditions. Dev. Cell 2, 239–249 [DOI] [PubMed] [Google Scholar]
- Brogiolo W., Stocker H., Ikeya T., Rintelen F., Fernandez R., Hafen E. (2001). An evolutionarily conserved function of the Drosophila insulin receptor and insulin-like peptides in growth control. Curr. Biol. 11, 213–221 [DOI] [PubMed] [Google Scholar]
- Chorna T., Hasan G. (2012). The genetics of calcium signaling in Drosophila melanogaster. Biochim. Biophys. Acta 1820, 1269–1282 [DOI] [PubMed] [Google Scholar]
- DiPatrizio N. V., Astarita G., Schwartz G., Li X., Piomelli D. (2011). Endocannabinoid signal in the gut controls dietary fat intake. Proc. Natl. Acad. Sci. USA 108, 12904–12908 [DOI] [PMC free article] [PubMed] [Google Scholar]
- Dyachok O., Gylfe E. (2004). Ca(2+)-induced Ca(2+) release via inositol 1,4,5-trisphosphate receptors is amplified by protein kinase A and triggers exocytosis in pancreatic beta-cells. J. Biol. Chem. 279, 45455–45461 [DOI] [PubMed] [Google Scholar]
- Entchev E. V., Schwudke D. S., Zagoriy V., Matyash V., Bogdanova A., Habermann B., Zhu L., Schevchenko A., Kurzchalia T. V. (2008). Let 767 is required for the production of branched and long chain fatty acids in Caenorhabditis elegans. J. Biol. Chem. 283, 17550–17560 [DOI] [PubMed] [Google Scholar]
- Foltenyi K., Greenspan R. J., Newport J. W. (2007). Activation of EGFR and ERK by rhomboid signaling regulates the consolidation and maintenance of sleep in Drosophila. Nat. Neurosci. 10, 1160–1167 [DOI] [PubMed] [Google Scholar]
- Géminard C., Arquier N., Layalle S., Bourouis M., Slaidina M., Delanoue R., Bjordal M., Ohanna M., Ma M., Colombani J., et al. (2006). Control of Metabolism and Growth Through Insulin-Like Peptides in Drosophila. Diabetes 55 Suppl. 2, S5–S8 [Google Scholar]
- Géminard C., Rulifson E. J., Léopold P. (2009). Remote control of insulin secretion by fat cells in Drosophila. Cell Metab. 10, 199–207 [DOI] [PubMed] [Google Scholar]
- Grönke S., Mildner A., Fellert S., Tennagels N., Petry S., Müller G., Jäckle H., Kühnlein R. P. (2005). Brummer lipase is an evolutionary conserved fat storage regulator in Drosophila. Cell Metab. 1, 323–330 [DOI] [PubMed] [Google Scholar]
- Herzog R., Schwudke D., Schuhmann K., Sampaio J. L., Bornstein S. R., Schroeder M., Shevchenko A. (2011). A novel informatics concept for high-throughput shotgun lipidomics based on the molecular fragmentation query language. Genome Biol. 12, R8. [DOI] [PMC free article] [PubMed] [Google Scholar]
- Hewes R. S., Park D., Gauthier S. A., Schaefer A. M., Taghert P. H. (2003). The bHLH protein Dimmed controls neuroendocrine cell differentiation in Drosophila. Development 130, 1771–1781 [DOI] [PubMed] [Google Scholar]
- Ikeya T., Galic M., Belawat P., Nairz K., Hafen E. (2002). Nutrient-dependent expression of insulin-like peptides from neuroendocrine cells in the CNS contributes to growth regulation in Drosophila. Curr. Biol. 12, 1293–1300 [DOI] [PubMed] [Google Scholar]
- Joshi R., Venkatesh K., Srinivas R., Nair S., Hasan G. (2004). Genetic dissection of itpr gene function reveals a vital requirement in aminergic cells of Drosophila larvae. Genetics 166, 225–236 [DOI] [PMC free article] [PubMed] [Google Scholar]
- Kir S., Beddow S. A., Samuel V. T., Miller P., Previs S. F., Suino-Powell K., Xu H. E., Shulman G. I., Kliewer S. A., Mangelsdorf D. J. (2011). FGF19 as a postprandial, insulin-independent activator of hepatic protein and glycogen synthesis. Science 331, 1621–1624 [DOI] [PMC free article] [PubMed] [Google Scholar]
- Leevers S. J., Weinkove D., MacDougall L. K., Hafen E., Waterfield M. D. (1996). The Drosophila phosphoinositide 3-kinase Dp110 promotes cell growth. EMBO J. 15, 6584–6594 [PMC free article] [PubMed] [Google Scholar]
- Lin D. M., Goodman C. S. (1994). Ectopic and increased expression of Fasciclin II alters motoneuron growth cone guidance. Neuron 13, 507–523 [DOI] [PubMed] [Google Scholar]
- Lucio M., Fekete A., Weigert C., Wägele B., Zhao X., Chen J., Fritsche A., Häring H. U., Schleicher E. D., Xu G., et al. (2010). Insulin sensitivity is reflected by characteristic metabolic fingerprints – a Fourier transform mass spectrometric non-targeted metabolomics approach. PLoS ONE 5, e13317. [DOI] [PMC free article] [PubMed] [Google Scholar]
- Marshall S. (2006). Role of insulin, adipocyte hormones, and nutrient-sensing pathways in regulating fuel metabolism and energy homeostasis: a nutritional perspective of diabetes, obesity, and cancer. Sci. STKE 2006, re7. [DOI] [PubMed] [Google Scholar]
- Matyash V., Liebisch G., Kurzchalia T. V., Shevchenko A., Schwudke D. (2008). Lipid extraction by methyl-tert-butyl ether for high-throughput lipidomics. J. Lipid Res. 49, 1137–1146 [DOI] [PMC free article] [PubMed] [Google Scholar]
- Melcher C., Pankratz M. J. (2005). Candidate gustatory interneurons modulating feeding behavior in the Drosophila brain. PLoS Biol. 3, e305. [DOI] [PMC free article] [PubMed] [Google Scholar]
- Nässel D. R. (2002). Neuropeptides in the nervous system of Drosophila and other insects: multiple roles as neuromodulators and neurohormones. Prog. Neurobiol. 68, 1–84 [DOI] [PubMed] [Google Scholar]
- Park D., Veenstra J. A., Park J. H., Taghert P. H. (2008). Mapping peptidergic cells in Drosophila: where DIMM fits in, PLoS ONE 3, e1896. [DOI] [PMC free article] [PubMed] [Google Scholar]
- Petersen U. M., Kadalayil L., Rehorn K. P., Hoshizaki D. K., Reuter R., Engström Y. (1999). Serpent regulates Drosophila immunity genes in the larval fat body through an essential GATA motif. EMBO J. 18, 4013–4022 [DOI] [PMC free article] [PubMed] [Google Scholar]
- Rajan A., Perrimon N. (2011). Drosophila as a model for interorgan communication: lessons from studies on energy homeostasis. Dev. Cell 21, 29–31 [DOI] [PMC free article] [PubMed] [Google Scholar]
- Rulifson E. J., Kim S. K., Nusse R. (2002). Ablation of insulin-producing neurons in flies: growth and diabetic phenotypes. Science 296, 1118–1120 [DOI] [PubMed] [Google Scholar]
- Schwudke D., Oegema J., Burton L., Entchev E., Hannich J. T., Ejsing C. S., Kurzchalia T., Shevchenko A. (2006). Lipid profiling by multiple precursor and neutral loss scanning driven by the data-dependent acquisition. Anal. Chem. 78, 585–595 [DOI] [PubMed] [Google Scholar]
- Schwudke D., Hannich J. T., Surendranath V., Grimard V., Moehring T., Burton L., Kurzchalia T., Shevchenko A. (2007). Top-down lipidomic screens by multivariate analysis of high-resolution survey mass spectra. Anal. Chem. 79, 4083–4093 [DOI] [PubMed] [Google Scholar]
- Sieber M. H., Thummel C. S. (2009). The DHR96 nuclear receptor controls triacylglycerol homeostasis in Drosophila. Cell Metab. 10, 481–490 [DOI] [PMC free article] [PubMed] [Google Scholar]
- Venkatesh K., Siddhartha G., Joshi R., Patel S., Hasan G. (2001). Interactions between the inositol 1,4,5-trisphosphate and cyclic AMP signaling pathways regulate larval molting in Drosophila. Genetics 158, 309–318 [DOI] [PMC free article] [PubMed] [Google Scholar]
- Venkiteswaran G., Hasan G. (2009). Intracellular Ca2+ signaling and store-operated Ca2+ entry are required in Drosophila neurons for flight. Proc. Natl. Acad. Sci. USA 106, 10326–10331 [DOI] [PMC free article] [PubMed] [Google Scholar]
- Wang M. C., Bohmann D., Jasper H. (2003). JNK signaling confers tolerance to oxidative stress and extends lifespan in Drosophila. Dev. Cell 5, 811–816 [DOI] [PubMed] [Google Scholar]
- Wang M. C., Bohmann D., Jasper H. (2005). JNK extends life span and limits growth by antagonizing cellular and organism-wide responses to insulin signaling. Cell 121, 115–125 [DOI] [PubMed] [Google Scholar]
- Ye R., Ni M., Wang M., Luo S., Zhu G., Chow R. H., Lee A. S. (2011). Inositol 1,4,5-trisphosphate receptor 1 mutation perturbs glucose homeostasis and enhances susceptibility to diet-induced diabetes. J. Endocrinol. 210, 209–217 [DOI] [PMC free article] [PubMed] [Google Scholar]
Associated Data
This section collects any data citations, data availability statements, or supplementary materials included in this article.