

SUMMARY
Biomaterials that are similar to skeletal muscle extracellular matrix have been shown to augment regeneration in ischemic muscle. In this study, treatment with a collagen-based matrix stimulated molecular myogenesis in an mdx murine model of necrosis. Matrix-treated animals ran ≥40% further, demonstrating functional regeneration, and expressed increased levels of myogenic transcripts. By contrast, matrix treatment was unable to induce transcriptional or functional changes in an MLC/SOD1G93A atrophic mouse model. In vitro, satellite cells were cultured under standard conditions, on matrix, in the presence of myocyte debris (to simulate a necrotic-like environment) or with both matrix and necrotic stimuli. Exposure to both matrix and necrotic stimuli induced the greatest increases in mef2c, myf5, myoD and myogenin transcripts. Furthermore, conditioned medium collected from satellite cells cultured with both stimuli contained elevated levels of factors that modulate satellite cell activation and proliferation, such as FGF-2, HGF and SDF-1. Application of the conditioned medium to C2C12 myoblasts accelerated maturation, as demonstrated by increased mef2c, myf5 and myogenin transcripts and fusion indexes. In summary, the collagen matrix required a necrotic stimulus to enhance the maturation of satellite cells and their secretion of a myogenic cocktail. Considering that matrix treatment supports myogenesis only in in vivo models that exhibit necrosis, this study demonstrates that a necrotic environment is required to maximize matrix-mediated myogenesis.
INTRODUCTION
Skeletal muscle regeneration is a coordinated process in which several factors are sequentially activated to maintain and preserve muscle structure and function after injury. Muscle regeneration occurs in four interrelated and time-dependent phases: degeneration, inflammation, regeneration and remodeling-repair (Carosio et al., 2011). Injury of myofibers results in rapid necrosis, which activates a defined inflammatory response characterized by the sequential invasion of muscle by specific inflammatory cell populations (Tidball, 2005). This response is followed by a regenerative phase, characterized by satellite cell (SC) activation and the presence of regenerating fibers. The final phase is a period during which the regenerated myofibers mature, the extracellular matrix (ECM) undergoes remodeling and the injured muscles functionally recover. The major roles of growth, remodeling and regeneration are played by SCs, a quiescent population of myogenic progenitor cells that reside between the basal lamina and plasmalemma and are rapidly activated in response to appropriate stimuli.
The potential for endogenous or supplementary stem cells to restore the form and function of damaged tissues is particularly promising for overcoming the restricted regenerative capacity of skeletal muscle in different pathologic conditions, including Duchenne muscular dystrophy (DMD) and amyotrophic lateral sclerosis (ALS). DMD is an X-linked degenerative disease in which the absence of dystrophin expression renders the muscle fibers more sensitive to mechanical damage. The main consequence of dystrophin absence is that the normal regenerative capacity of skeletal muscle cannot compensate for increased susceptibility to damage, resulting in the replacement of muscle fibers with fibrotic or fat tissue (Gillis, 1999; Grounds, 2008). In DMD patients, the SC response is to replace degenerating myofibers with new myofibers that still lack dystrophin, a cycle that proceeds and ultimately depletes SC pools. Furthermore, the rate of myocyte telomere loss is 14 times greater in DMD patients (Decary et al., 2000) and their SCs appear to have a reduced potential for proliferation (Renault et al., 2000). Ultimately, poor quality progenitors regenerate poor quality muscle, and this muscle is still weak and still experiences necrotic degeneration. ALS is a neuromuscular disease that manifests as progressive motor neuron degeneration, muscle atrophy and paralysis. This degeneration occurs without evident signs of necrosis. Atrophic muscle maintains fewer SCs and these SCs are dysfunctional with respect to their abilities to proliferate and differentiate into myotubes (Mitchell and Pavlath, 2004). ALS-derived SCs have also been observed to be abnormally senescent and fail to fully differentiate (Pradat et al., 2011), and ALS patients also display myopathic changes (Dupuis and Echaniz-Laguna, 2010). Thus, in such disease states characterized by insufficient myogenesis, SC contributions are not optimal and may be a key reason for poor recovery and regeneration of healthy muscle.
In skeletal muscle diseases, whether characterized by necrotic degeneration or atrophic wasting, there is a homeostatic imbalance towards muscle loss and away from muscle regeneration. Despite having genetic causes, strategies (such as gene transfer, protein delivery and stem cell transplantation) that can shift this equilibrium towards muscle regeneration can offer time and hope for patients suffering from these debilitating conditions. However, no strategy has yet emerged as ideal for enhancing muscle regeneration in the clinic. There is a great need for regenerative strategies that can enhance or initiate muscle regeneration (Turner and Badylak, 2012). Although biomaterials for the regeneration of bone, cardiovascular and nerve tissues have been extensively investigated, little research has been performed to evaluate biomaterial treatment for muscle diseases. The use of naturally derived materials that mimic healthy ECM is a promising therapeutic option and also bypasses risks associated with other treatments, such as the need for immunosuppressant drugs, induction of endogenous inflammatory responses and the difficulties associated with cell culture (Kuraitis et al., 2012b). We have recently used collagen-based matrices to augment regeneration in ischemic skeletal muscle (Kuraitis et al., 2012a). The objectives of this study were to: (i) evaluate the potential of a myogenesis-augmenting collagen matrix in different muscle disease states; (ii) characterize the interaction of this collagen matrix with SCs; and (iii) explore the role of necrotic stimuli in matrix-mediated myogenesis.
TRANSLATIONAL IMPACT.
Clinical issue
Diseases associated with muscle loss, including Duchenne’s muscular dystrophy (DMD), represent a huge burden to society, and ideal therapies are not yet visible on the horizon. In such diseases, muscle loss can occur via active, necrotic degeneration, or muscle wasting via atrophic degeneration. Recent studies have shown that the application of biomaterials that mimic healthy extracellular matrix can provide stem cell niches and augment skeletal muscle regeneration.
Results
In this study, the authors show that an injectable collagen matrix is able to successfully regenerate skeletal muscle in a mouse model of muscle necrosis, but not in an atrophic mouse model. This in vivo phenomenon was supported by in vitro observations: satellite cells (SCs) that were exposed to the matrix demonstrated an improvement in myogenesis that was maximized when SCs were cultured on the matrix in a necrotic environment. Furthermore, matrix and necrotic co-stimuli induced SCs to produce a cytokine cocktail containing myogenesis-regulating factors, and this mixture accelerated myogenesis in cultured myoblasts, and in dystrophic and ischemic muscle.
Implications and future directions
The clinical evaluation and application of biomaterials is becoming more prevalent every day. However, to date no gene, pharmacological or cell therapy has emerged as an ideal candidate to promote muscle regeneration. This study has broad implications: application of a ‘healthy’ extracellular matrix-like material has the potential to activate muscle progenitor cells and functionally regenerate muscle. Regeneration conferred by this particular therapy appears to be optimal under necrotic conditions, highlighting the importance of considering the disease environment when applying therapeutic biomaterials.
RESULTS
Matrix treatment confers functional improvements in mdx mice
Matrix or phosphate-buffered saline (PBS) was injected into the extensor digitorum longus (EDL) muscle of mice. The EDL was chosen to receive treatment because it allows for basic animal motility. As a model for DMD, the mdx mouse was used. Matrix-treated mdx mice were able to run distances 47% greater than shams (P=0.02) and 40% greater than PBS-treated mice (P=0.01; Fig. 1A). Matrix-treated mice also resisted physical exhaustion until reaching speeds of 22 meters/second, unlike sham and PBS-treated mice who reached exhaustion at 17 (P=0.02) and 18 meters/second (P=0.02), respectively (Fig. 1B).
Fig. 1.
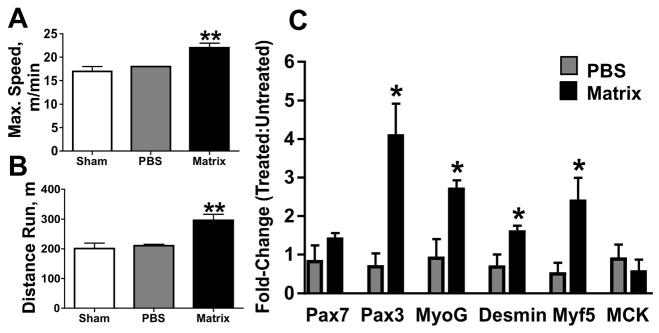
Functional and molecular regeneration in mdx muscle with matrix treatment. (A,B) Matrix-treated mdx mice were able to run at greater speeds (A) and greater distances (B) than PBS-treated littermates. (C) Early- and mid-stage myogenic gene transcription was also increased with matrix treatment compared with untreated contralateral muscle. *P≤0.05 versus PBS; **P≤0.02 versus all other treatments.
Myogenic transcripts increase with matrix treatment in mdx mice
Compared with PBS treatment, matrix treatment induced transcription of myogenic genes in mdx muscle (Fig. 1C). Specifically, increases were observed for crucial factors regulating the entry of SCs into the myogenic program, proliferation and commitment, such as Pax3 (5.9×; P=0.02), myf5 (3.5×; P=0.05), desmin (2.3×; P=0.04) and myogenin (3.0×; P=0.02). A favorable trend for increased transcription of Pax7 was also observed with matrix treatment (1.7×; P=0.1). No difference in transcript levels of the late regeneration gene encoding muscle creatine kinase (MCK) was observed between treatments (P=0.5).
Matrix treatment does not support functional recovery or myogenic gene transcription in a mouse model of muscle atrophy
Matrix treatment was also evaluated in the MLC/SOD1G93A mouse, a model for ALS. No differences were observed with respect to the maximal distances run by MLC/SOD1G93A mice (P≥0.3; Fig. 2A), nor the speed at which exhaustion occurred (P≥0.5; Fig. 2B) among sham, PBS and matrix treatments. Differences in myogenic transcript levels were also not observed between treatments for Pax7 (P=0.3), Pax3 (P=0.6), myf5 (P=0.5), desmin (P=0.3), myogenin (P=0.2) and MCK (P=0.6; Fig. 2C).
Fig. 2.
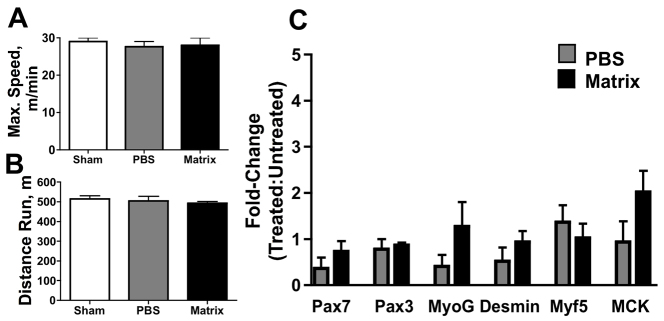
Lack of observable regeneration in matrix-treated atrophic mice. (A–C) Matrix treatment did not improve the running speed (A) or maximum distance run (B) of MLC/SOD1G93A mice, nor was there any observed difference in levels of myogenic transcripts with matrix treatment (C).
Matrix stimulus increases primary myoblast-derived myotube maturation and a necrotic co-stimulus increases myotube size
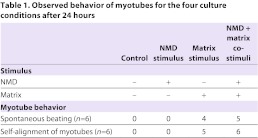
To investigate the effect of the matrix on SCs, primary myoblasts were cultured on traditional collagen-I-coated dishes or matrix substrate. SC populations were differentiated using low serum and after 24 hours, cells were collected and analyzed. Additionally, necrotic myocyte debris (NMD) was added to paired cultures to act as a necrotic stimulus. Four culture conditions were therefore created: (i) control; (ii) NMD; (iii) matrix; and (iv) NMD plus matrix (NMD-matrix). Morphologically, the presence of NMD and/or matrix stimuli altered the shape of SC-derived myotubes (Fig. 3A–D). Matrix culture, regardless of NMD stimulus, increased the amount of generated myotubes to 13.9±1.3, which was significant compared with control cultures and NMD stimuli (5.0±0.9; P<0.0001; Fig. 3E). However, matrix exposure in the presence of the necrotic stimuli increased the robustness of these myotubes, generating myotubes that were at least 1.5× longer (P≤0.003; Fig. 3F) and 1.2× thicker (P≤0.02; Fig. 3G). In addition to increasing myotube frequency, matrix culture (either with or without NMD) also supported beating and self-alignment of myotubes (Table 1).
Fig. 3.

Matrix and necrotic stimuli co-activate satellite cells. (A–D) Combinations of NMD and matrix culture conditions generated myotubes at different stages of maturation after 24 hours. (E–G) Culture on matrix increased the number of SC-derived myotubes (E), but addition of the NMD co-stimulus allowed for the generation of larger myotubes (F,G). (H–K) Myogenic gene transcription was greatest in SC cultures on matrix with the addition of NMD. *P≤0.04 versus control; **P≤0.04 versus all other treatments; ***P<0.0001.
Table 1.
Observed behavior of myotubes for the four culture conditions after 24 hours
In a necrotic context, matrix stimulus greatly amplifies myogenic gene transcription in satellite cell cultures
Compared with control (no NMD or matrix stimuli) cultures, matrix exposure increased transcription of myoD by 2.2× (P=0.03; Fig. 3I), myogenin by 1.3× (P=0.04; Fig. 3J) and mef2c by 1.2× (P=0.02; Fig. 3K). When a necrotic stimulus was added to matrix cultures, transcriptional myogenesis was greatly enhanced. Compared with all other treatment conditions, simultaneous matrix and NMD stimulation increased transcript levels of myf5 by 4.9× (P≤0.02; Fig. 3H), myoD by 13.1× (P≤0.03; Fig. 3I), myogenin by 12.8× (P≤0.02; Fig. 3J) and mef2C by 4.5× (P≤0.04; Fig. 3J). NMD stimulus alone did not induce any changes.
Satellite cell populations experiencing necrotic and matrix stimuli produce a paracrine cocktail with potent myogenic effects
To investigate the potential for the matrix to induce myogenesis via activation of paracrine signaling, supernatants collected from SC cultures (±NMD, ±matrix stimuli) were applied to proliferating C2C12 myoblast cultures. After 24 hours of exposure to conditioned medium from SC cultures (or control medium), C2C12 transcription of myogenic markers was increased only when supplemented with conditioned medium from NMD-matrix SC cultures. Specifically, myf5 increased by 4.5× (P≤0.03; Fig. 4A), myogenin increased by 213.4× (P≤0.02; Fig. 4B) and mef2C increased by 191.9× (P≤0.0002; Fig. 4C). These changes were abrogated for all markers at 48 hours (P≥0.3).
Fig. 4.

Paracrine effects of SCs after exposure to matrix and necrotic cell debris. (A–C) The addition of conditioned medium from SC cultures exposed to matrix and NMD accelerated the transcription of myf5 (A), myogenin (B) and mef2c (C) in SC at 24 hours, compared with all other conditioned medium treatments and with standard myoblast differentiation conditions with DM. (D) At 48 hours, there was an increase in cell fusion of myoblasts cultured with conditioned medium from matrix-NMD SC cultures. (E–N) Representative images of differentiating myoblasts at 24 hours (E–I) and 48 hours (J–N). Cells are visualized with anti-laminin (green) and nuclei with Hoechst (blue) stains. *P≤0.09 versus all other treatments at 24 hours; **P≤0.05 versus all other treatments at each time point; ***P≤0.0002 versus all other treatments at 24 hours. Scale bars: 100μm.
At 24 hours, C2C12 cultures exposed to NMD-matrix conditioned medium corroborated the transcriptional profile; these myoblast cultures tended to demonstrate a greater fusion index (3.8% versus 1.2–2.4%; P≤0.09; Fig. 4D); however, the increased fusion index became more pronounced at 48 hours (16.1% versus 6.5–10.0%; P≤0.05; Fig. 4D). At 48 hours, all myoblast cultures were morphologically representative of proliferation/early differentiation (Fig. 4E–N).
Matrix and necrotic co-stimuli cause satellite cells to produce both inflammatory and regenerative cytokines
To elucidate the paracrine factors responsible for accelerating C2C12 myoblast maturation, supernatant collected from SC cultures (control, NMD, matrix and NMD-matrix) was screened using a cytokine array. NMD and/or matrix stimuli did not induce changes in the amount of SC-produced myogenic regulatory factors insulin-like growth factor (IGF)-I (P=0.2; Fig. 5A), IGF-II (P=0.6; Fig. 5B), IGF binding protein (IGFBP)-2 (P=0.6; Fig. 5C), IGFBP-5 (P=0.3; Fig. 5D) or IGFBP-6 (P=0.2; Fig. 5E). NMD-matrix stimuli increased interleukin (IL)-1α production by 2.1× (P≤0.05; Fig. 5F), but did not alter IL-1β production (P=0.5; Fig. 5G). Both NMD and NMD-matrix conditions increased IL-4 by 2.7× and 2.0×, respectively (P≤0.003; Fig. 5H). IL-6 was increased by 4.7× only under NMD-matrix conditions (P≤0.01; Fig. 5I). No conditions induced changes in production of IL-10 (P=0.2; Fig. 5J) or tumor necrosis factor-α (TNF-α; P=0.2; Fig. 5K). Monocyte chemoattractant protein-1 (MCP-1) trended towards a 23% reduction in all treatments, compared with control (no NMD, no matrix stimuli) conditions (P≤0.06; Fig. 5L). Both NMD and NMD-matrix conditions increased fibroblast growth factor-2 (FGF-2) levels by 2.8× and 3.3×, respectively (P≤0.02; Fig. 5M). Only NMD-matrix conditions increased levels of hepatocyte growth factor (HGF; by 1.5×; P≤0.02; Fig. 5N) and stromal cell-derived factor-1 (SDF-1; by 1.5×; P≤0.05; Fig. 5O).
Fig. 5.

Identification of paracrine factors produced by satellite cells after exposure to matrix and necrotic cell debris for 24 hours. (A–E) Matrix-NMD stimuli did not induce changes in the production of IGF-I (A), IGF-II (B), IGFBP-2 (C), IGFBP-5 (D) or IGFBP-6 (E). (F–L) Changes in production of some inflammatory cytokines were observed with matrix and NMD exposure: IL-1α (F), IL-1β (G), IL-4 (H), IL-6 (I), IL-10 (J), TNFα (K) and MCP-1 (L). (M–O) Matrix and NMD co-stimuli enhanced the production of regenerative cytokines FGF-2 (M), HGF (N) and SDF-1 (O). **P≤0.02 versus treatments without NMD stimulus; ***P≤0.05 versus all other treatments; ****P≤0.06 versus all other treatments.
DISCUSSION
In dystrophic mice, collagen matrix treatment stimulated myogenesis, probably contributing to the observed functional improvements. It is important to note that the model was unilateral; therefore, the functional results probably underestimate the potential of this treatment should both legs receive treatment. The mid-stage myogenic gene encoding myogenin was increased, as were the early-stage genes encoding desmin and Myf5. SC marker Pax3 was also increased, but interestingly the SC marker Pax7 was not. Pax3 and Pax7 have similar roles in specifying myogenic cell fate and both may be used to identify SCs (Horst et al., 2006; Relaix et al., 2006). It is possible that the increase in only Pax3 mRNA can be attributed to a subpopulation of SCs. A new myogenic Pax3+Pax7− population, found in the interstitium and not the basal lamina, has previously been identified (Kuang et al., 2006). It has also been reported that Pax3 is expressed in quiescent muscle satellite cells in a subset of muscles and it plays an important role in regulating the entry of satellite cells into the myogenic program (Buckingham, 2007; Relaix et al., 2006). Thus, Pax3 plays a distinct role in this context, as it is expressed in proliferating SCs before they exit the cell cycle (Conboy and Rando, 2002), thereby suggesting that Pax3+ SC proliferation may be greater in matrix-treated muscles. MCK, a late marker of myogenesis, was not increased with matrix treatment, implying that the observed myogenesis had not yet reached a stage of late maturation. Treatment of ischemic muscle – another disease state characterized by necrotic degeneration – with the same collagen matrix also resulted in increased expression of myogenic genes, but not in Pax7 transcripts (Kuraitis et al., 2012a). It is curious that, despite the striking functional improvements and molecular myogenesis in the mdx and ischemic models, no indication of myogenesis was evident in atrophic animals. The obvious differences between the models are the muscle microenvironment and the modes by which muscle is lost: dystrophic muscles and ischemic muscles are characterized by degeneration of necrotic myofibers and inflammation, whereas atrophic muscles do not present significant amounts of necrotic or non-apoptotic dead myocytes. The difference between the ability of these microenvironments to modulate myogenesis was further explored with in vitro studies.
Exposure to a collagen matrix improved the number of SC-generated myotubes; however, the addition of a necrotic stimulus increased their size and induced functional beating, something that is not typically seen in SC cultures until 2–3 days after differentiation. Similarly, matrix exposure induced mild increases in myogenic genes, but in a necrotic context the matrix markedly amplified transcription of a greater number of myogenic genes. We have recently demonstrated that this collagen matrix has an inherent potential for myogenesis: when it was used as a substrate for the culture of pluripotent embryonic stem cells, multinucleated Pax3+ populations were generated that also expressed myogenin and myf5 (Kuraitis et al., 2012a). This matrix also mimics skeletal muscle elasticity. ECM elasticity is one of the key parameters that govern progenitor cell differentiation (Engler et al., 2006), as maximal myoblast-to-myotube differentiation has been shown to occur when the substrate’s elasticity mimics that of native skeletal muscle (Engler et al., 2004; Gilbert et al., 2010). The novelty of our study is that matrix and necrotic co-stimuli aggrandize myogenesis from SCs. Dehne and colleagues have shown that exposure to muscle cell debris activates myoblasts and signals for the production of regenerative factors (Dehne et al., 2011). Thus, a necrotic mechanism – in particular, direct SC-necrotic myocyte contact –may be necessary in order to achieve maximal myogenesis with collagen matrix treatment. Because the DMD phenotype is exacerbated by the lack of functional glycoprotein complexes to link the ECM and cytoskeleton (Straub and Campbell, 1997), the in vitro observations support the hypothesis that provision of a material that potentially mimics healthy ECM may at least partially compensate and support robust regeneration in mdx mice.
Muscle turnover and regeneration is a complex process and highly coordinated among myocytes, progenitor cells and inflammatory cells. Because of this cross-talk, it is difficult to identify the sources of regenerative signals. Myotube incubation with muscle cell debris appears to produce autocrine and/or paracrine factors, because application of this supernatant alone was able to activate other myotubes that were not exposed to cell debris (Dehne et al., 2011). Application of conditioned medium from SC cultures (±NMD, matrix stimuli) to myoblasts revealed that exposure to both the matrix and necrotic stimuli generated a paracrine cocktail that could induce myogenesis in myoblasts 24 hours after exposure. The acceleration of myf5, myogenin and mef2c transcription was no longer apparent at 48 hours, but increased cell fusion was maintained at the later time point. It would have been interesting to observe these effects later into stages of myotube maturation, but after 48 hours the cell media could not be replaced with fresh media of known contents and thus the experiment could not be continued beyond this time point.
Arrays were used to identify paracrine factors whose presence might explain why the conditioned medium from NMD-matrix SC cultures can accelerate myogenesis. Surprisingly, treatment conditions did not generate different amounts of IGF-I, IGF-II or their binding proteins. IGFs and their binding proteins have important and known roles in myogenesis (Duan et al., 2010). SCs exposed to both stimuli produced IL-1α, IL-4 and IL-6. Under pro-inflammatory stimuli, SC-derived myocytes naturally produce inflammatory interleukin cytokines (Nagaraju et al., 1998). TNF-α is considered one of the most degenerative cytokines, so it may be favorable that TNF-α levels were not elevated. The presence of IL-4 is required for myoblast fusion with myotubes and its absence leads to myotubes of reduced size (Horsley et al., 2003). IL-6 is produced by SCs and growing myofibers and its absence reduces myoblast proliferation and migration (Serrano et al., 2008). Thus, SCs exposed to a combination of matrix and necrotic stimuli increase their production of inflammatory cytokines that have defined roles in myoblast function and maturation. The chemokine MCP-1 is important for recruitment of mononuclear cells post-injury (Chazaud et al., 2003) and MCP-1−/− animals display impaired regeneration (Shireman et al., 2007). However, SCs appear to produce MCP-1 immediately after activation and emigration from quiescence, and this production tapers off over time (Chazaud et al., 2003). Given that SCs appeared to mature under NMD or matrix stimuli and that the control conditions were least supportive of SC maturation, it is plausible that the precursor cells in control conditions produced greater amounts of MCP-1 because they are in a more primitive stage of the myocytic lineage and have not yet matured to a phenotype with ablated MCP-1 production.
In addition to inflammatory cytokines, skeletal muscle regeneration requires coordinated growth factor signals (Turner and Badylak, 2012). Of the cytokines with known roles in myogenesis, the production of HGF, FGF-2 and SDF-1 was greatly increased by SCs in response to NMD-matrix co-stimuli. HGF is a potent growth factor produced in an autocrine fashion, and is capable of stimulating quiescent SC activation (Tatsumi et al., 1998) and proliferation (Sheehan et al., 2000). FGF-2 is also produced by muscle progenitor cells (Joseph-Silverstein et al., 1989) and has a strong ability to induce SC proliferation (Deasy et al., 2002). Furthermore, HGF and FGF-2 synergistically increase SC proliferation (Sheehan and Allen, 1999). SDF-1 is a chemoattractant capable of recruiting a variety of progenitor cell populations, including SCs (Miller et al., 2008; Ratajczak et al., 2003). It has been suggested that based on its ability to attract SCs, SDF-1 might play a bimodal role and function to recruit cells both to a quiescent niche and also to sites of injury or regeneration (Miller et al., 2008). Together, the cytokines produced by SCs under NMD-matrix conditions are supportive of myoblast activation, proliferation and maturation, as demonstrated by the accelerated myogenesis in C2C12 myoblast cultures in the presence of this cytokine cocktail.
This study employed a collagen-based matrix containing chondroitin sulfate-C, which has physical properties similar to those of native, healthy skeletal muscle. It is noteworthy that provision of a matrix containing only two ECM components is able to support and accelerate myogenesis. Future studies will be needed to better understand how the ECM changes in disease states and how we can best replicate ‘healthy’ ECM in order to facilitate recovery and regeneration. When designing therapeutic biomaterials, such studies will probably exploit specific regenerative cues that already exist in the ECM in order to best harness and benefit from endogenous cues for regeneration (Kuraitis et al., 2012b).
The conclusions of this study are multiple: (i) treatment with a collagen-based matrix can augment myogenesis, but this regeneration is context-dependent and may require a necrotic environment as a mechanism for achieving maximum regeneration; (ii) under necrotic conditions, the matrix superactivates SC populations to mature and also to produce a potent myogenic cocktail of secreted proteins; and (iii) instead of attempting to modulate necrosis and inflammation, this study provides a novel therapy that can harness the constant necrosis that occurs in DMD and use it as a ‘Trojan Horse’ for regeneration that translates into improved function. Perhaps more globally, this study also highlights that the disease state must be carefully considered when applying therapeutic biomaterials, because the matrix presented in this study only induced myogenesis in states of active necrosis and failed to induce myogenesis in an atrophic model.
MATERIALS AND METHODS
Unless otherwise specified, all materials and reagents were obtained from Sigma-Aldrich (Schnelldorf, Germany).
Matrix preparation
Collagen matrix was prepared on ice, as previously described (Kuraitis et al., 2011). N-(3-dimethylaminopropyl)-N′-ethylcarbodiimide hydrochloride (EDC) and N-hydroxysuccinimide (NHS) were mixed in a 1:1 molar ratio (13 mM) in 2-(N-morpholino) ethanesulfonic acid (MES) buffer. This EDC/NHS crosslinker was added to a solution of 1% (w/v) type I collagen (Nippon Ham, Tskuba, Japan) and 40% (w/v) chondroitin sulfate-C (CSC; Wako Chemicals, Osaka, Japan). The solution was diluted with PBS before adjusting the pH to 7.2±0.2. The final concentrations of collagen and CSC were 0.59 and 2.4% (w/v), respectively. For in vivo use, the matrix was kept on ice and transferred to a cold syringe immediately prior to use. For in vitro use, 150 μl was spread onto 6-cm tissue culture polystyrene plates before being thermogelled at 37°C and rinsed with PBS before cell application.
Animal model
The animals were housed in a temperature-controlled (22°C) room with a 12-hour light-dark cycle. All of the mice were maintained according to the institutional guidelines of the animal facilities of DIEM-National Institute of Health-Italy.
Two mouse lines were used to evaluate the potential of the matrix for myogenesis. The well-characterized mdx mouse (Willmann et al., 2012) was used as a model for DMD. The MLC/SOD1G93A mouse, recently characterized (Dobrowolny et al., 2008), was used as a model for muscle atrophy and ALS. Given its ability to represent animal motility and muscle function, the EDL muscle was chosen to evaluate matrix treatment. The left EDLs of 1-month-old male mdx and 4-month-old female MLC/SOD1G93A mice were surgically exposed and received a 5-μl injection of either PBS or matrix. Treadmill tests were performed at 6 weeks for mdx mice and at 6 months for MLC/SOD1G93A mice. After collection of treadmill data, animals were sacrificed and EDL muscles were harvested, flash-frozen in liquid nitrogen and stored at −80°C.
Functional analysis with a forced treadmill test
To assess the function of treated muscles, mice were subjected to a forced treadmill protocol. They were conditioned to the treadmill process for 1 week prior to final testing at an incline of 0° for 5 minutes at 5 meters/second and 5 minutes at 10 meters/second. Animals that did not maintain the treadmill speed received a shock of 0.5 mA. The maximal test of exhaustion was modified from a published method (Ferreira et al., 2008). In brief, the treadmill speeds increased every 3 minutes at a rate of 3 meters/minute. Animals were removed from the treadmill when they could no longer manage to return to the treadmill from the shock platform. Total distance and speed at which exhaustion occurred were recorded. The same parameters were also measured on untreated (sham) animals for both models.
C2C12 myoblast culture
All cells in culture were maintained at 37°C in a humidified incubator with 5% CO2. C2C12 myoblasts were used between passages 6 and 9. Cells were maintained on 20-cm tissue culture dishes in growth medium (GM) consisting of DMEM supplemented with 20% fetal bovine serum (FBS), penicillin/streptomycin and 4 mM L-glutamine. Upon reaching ∼85% confluence, cells were differentiated by replacing their GM with differentiation medium (DM), which is equivalent to the GM formulation but containing only 2% FBS. To store amplified cells, 1×10⁵ C2C12 myoblasts were suspended in GM and DMSO in a 9:1 ratio and frozen at −80°C.
Necrotic myocyte debris preparation
Confluent C2C12 myoblasts were differentiated into early-stage myotubes for 24 hours. NMD was prepared by manually scraping myotubes, centrifuging and storing the collected debris at −80°C at a concentration of 2×10⁶ cells/100 μl PBS. Application of NMD to other cell populations allows for the observation of interactions that stem from direct cell contact with dead myocytes (Dehne et al., 2011). Prior to application in culture, NMD was confirmed to contain non-viable cells by examination under a light microscope using Trypan Blue dye.
Satellite cell isolation
Wild-type C57 mice, 3–4 weeks of age, were sacrificed and the hindlimb muscle was harvested under sterile conditions. Muscles were minced and enzymatic digestion using collagenase and dispase was performed as previously described (Musarò and Barberi, 2010). After digestion, the solutions were pre-plated on tissue culture dishes to remove contaminating fibroblasts, for 45 minutes and then for 30 minutes. SCs were amplified on collagen-I-coated plates in growth medium consisting of DMEM supplemented with 20% horse serum, penicillin/streptomycin, L-glutamine (4 mM) and 3% chick embryo extract. One day after isolation, cells were lifted using 0.25% trypsin, pre-plated again for 30 minutes and re-plated on new collagen-coated dishes. Cells were washed with PBS and the growth medium changed every other day.
Satellite cell differentiation
After 4–5 days, 6–8×10⁵ cells could be collected from the primary cultures derived from one mouse and 8×10⁴ SCs were plated in 3 ml differentiation medium on 6-cm dishes coated with collagen I [used as standard SC culture substrate (Musarò and Barberi, 2010)] or matrix. Cultures then received either 100 μl of NMD or 100 μl of PBS. Ultimately, four culture conditions were created: (i) standard culture conditions; (ii) NMD stimulus; (iii) matrix substrate stimulus; and (iv) NMD-matrix stimuli. After 24 hours in culture, cell observations were recorded and cells imaged. Then the cells were thoroughly rinsed with calcium- and magnesium-free PBS (CMF) to remove dead cells and NMD and immediately frozen at −80°C. Cell images were analyzed using ImageJ 1.32s (National Institutes of Health, Bethesda, MD) for the number of myotubes per field-of-view (FOV), and their lengths and widths. Width was defined as the maximum width of a myotube. Based on myotube morphology, this measurement was taken at the center, approximately equidistant from either end. The medium from these 24-hour cultures (for all four conditions) was flash-frozen in liquid nitrogen and stored at −80°C to be used as conditioned medium in subsequent C2C12 studies.
C2C12 myoblast differentiation
As described, C2C12 myoblasts were differentiated into early-stage myotubes using low serum medium. Cultures were maintained on 3-cm dishes. Upon ∼85% confluence, GM was replaced either with 3 ml DM or with 2 ml DM + 1 ml of conditioned medium from SC cultures (four conditions tested: control, NMD, matrix, or NMD-matrix). Upon harvest at 0, 24 or 48 hours, cells were rinsed with CMF and stored at −80°C for RNA extraction. A subset of differentiating myoblasts was prepared for fusion index analysis. Cells were fixed with 70% methanol for 20 minutes, blocked for 45 minutes with 10% goat serum in CMF, incubated for 2 hours at room temperature with 1:200 goat anti-laminin in 1.5% goat serum and then incubated for 45 minutes at room temperature with 1:2000 mouse anti-goat Alexa Fluor 488 (Invitrogen, Burlington, Canada) and 1:1000 Hoechst 33342 stain. Before and after each incubation step, cells were washed for 2×10 minutes with PBS containing 1% BSA/ and 0.2% Triton X-100. Cells were imaged using an inverted Axioskop 2 Plus microscope (Zeiss, Oberkochen, Germany) and images were processed using Axiovision 3.1 software (Zeiss). The fusion index was calculated as the percentage of nuclei present in multinucleated cells.
RNA preparation and quantitative PCR analysis
Total RNA was isolated from homogenized muscle and manually scraped cell cultures using TRIzol reagent (Invitrogen) as previously described (Rio et al., 2010). RNA was converted to cDNA using the QuantiTect Reverse Transcription kit according to the manufacturer’s instructions (Qiagen, Milan, Italy). The reagent proportions as specified by the manufacturer were used for each 1 μg of RNA. cDNA concentrations were raised to 10 ng/ml with nuclease-free water and stored at −20°C. qPCR reactions were prepared with 5 μl cDNA, 6.25 μl nuclease-free water, 12.5 μl TaqMan PCR Master Mix (Applied Biosystems, Foster City, CA) and 1.25 μl TaqMan Probe (Applied Biosystems). TaqMan Probes were used for murine β-actin, desmin, GAPDH, MCK, mef2C, myoD, myogenin, myf5, Pax3 and Pax7. The reaction was performed using an Applied Biosystems RealPlex 7500 Fast Real Time system and software. Relative gene expression was quantified using the ΔΔCt method, as described (Livak and Schmittgen, 2001). Transcripts from treated muscles were expressed relative to those in untreated muscles (using housekeeping genes encoding GAPDH for mdx mice and β-actin for MLC/SODG93A mice; n=4). Transcripts from cultured cells were expressed relative to control treatments (using housekeeping genes encoding GAPDH for C2C12 myoblast cultures and β-actin for SC cultures; n=4–6).
Cytokine arrays
Conditioned medium collected from SC cultures was analyzed using a cytokine array according to the manufacturer’s instructions. Custom cytokine arrays (RayBioTech, Norcross, GA) were used to analyze protein levels of IGF-1, IGF-II, IGFBP-2, IGFBP-5, IGFBP-6, IL-1α, IL-1β, IL-4, IL-6, Il-10, TNFα, MCP-1, FGF-2, HGF and SDF-1.
Statistical analysis
All experiments were performed with n=4, except SC cultures and cytokine arrays, which were performed with n=6. Data between two experimental conditions were analyzed using a Student’s t-test and data between multiple groups was analyzed using a one-way analysis of variance with Tukey’s post-hoc using Prism 4.0 (GraphPad, La Jolla, CA).
Acknowledgments
The authors would like to thank Carmine Nicoletti for assistance with animal care and Laura Barberi for assistance with cell culture.
Footnotes
COMPETING INTERESTS
The authors declare that they do not have any competing or financial interests.
AUTHOR CONTRIBUTIONS
D.K., E.J.S. and A.M. conceived the study. D.K. performed all experiments, analyzed all data and wrote the manuscript. M.G.B. performed gene expression analysis. All authors contributed to manuscript editing.
FUNDING
D.K. was supported by a Canadian Institutes of Health Research (CIHR) Canadian Graduate Scholarship and a Disease Models and Mechanism’s Travelling Fellowship. This work was supported by Fondazione Roma, 7FP-Myoage and the French Muscular Dystrophy Association (AFM) (to A.M.) and by the Heart and Stroke Foundation of Ontario [grant-in-aid T6793 to E.J.S.].
REFERENCES
- Buckingham M. (2007). Skeletal muscle progenitor cells and the role of Pax genes. C. R. Biol. 330, 530–533 [DOI] [PubMed] [Google Scholar]
- Carosio S., Berardinelli M. G., Aucello M., Musarò A. (2011). Impact of ageing on muscle cell regeneration. Ageing Res. Rev. 10, 35–42 [DOI] [PubMed] [Google Scholar]
- Chazaud B., Sonnet C., Lafuste P., Bassez G., Rimaniol A. C., Poron F., Authier F. J., Dreyfus P. A., Gherardi R. K. (2003). Satellite cells attract monocytes and use macrophages as a support to escape apoptosis and enhance muscle growth. J. Cell Biol. 163, 1133–1143 [DOI] [PMC free article] [PubMed] [Google Scholar]
- Conboy I. M., Rando T. A. (2002). The regulation of Notch signaling controls satellite cell activation and cell fate determination in postnatal myogenesis. Dev. Cell 3, 397–409 [DOI] [PubMed] [Google Scholar]
- Deasy B. M., Qu-Peterson Z., Greenberger J. S., Huard J. (2002). Mechanisms of muscle stem cell expansion with cytokines. Stem Cells 20, 50–60 [DOI] [PubMed] [Google Scholar]
- Decary S., Hamida C. B., Mouly V., Barbet J. P., Hentati F., Butler-Browne G. S. (2000). Shorter telomeres in dystrophic muscle consistent with extensive regeneration in young children. Neuromuscul. Disord. 10, 113–120 [DOI] [PubMed] [Google Scholar]
- Dehne N., Kerkweg U., Flohé S. B., Brüne B., Fandrey J. (2011). Activation of hypoxia-inducible factor 1 in skeletal muscle cells after exposure to damaged muscle cell debris. Shock 35, 632–638 [DOI] [PubMed] [Google Scholar]
- Dobrowolny G., Aucello M., Rizzuto E., Beccafico S., Mammucari C., Boncompagni S., Belia S., Wannenes F., Nicoletti C., Del Prete Z., et al. (2008). Skeletal muscle is a primary target of SOD1G93A-mediated toxicity. Cell Metab. 8, 425–436 [DOI] [PubMed] [Google Scholar]
- Duan C., Ren H., Gao S. (2010). Insulin-like growth factors (IGFs), IGF receptors, and IGF-binding proteins: roles in skeletal muscle growth and differentiation. Gen. Comp. Endocrinol. 167, 344–351 [DOI] [PubMed] [Google Scholar]
- Dupuis L., Echaniz-Laguna A. (2010). Skeletal muscle in motor neuron diseases: therapeutic target and delivery route for potential treatments. Curr. Drug Targets 11, 1250–1261 [DOI] [PMC free article] [PubMed] [Google Scholar]
- Engler A. J., Griffin M. A., Sen S., Bönnemann C. G., Sweeney H. L., Discher D. E. (2004). Myotubes differentiate optimally on substrates with tissue-like stiffness: pathological implications for soft or stiff microenvironments. J. Cell Biol. 166, 877–887 [DOI] [PMC free article] [PubMed] [Google Scholar]
- Engler A. J., Sen S., Sweeney H. L., Discher D. E. (2006). Matrix elasticity directs stem cell lineage specification. Cell 126, 677–689 [DOI] [PubMed] [Google Scholar]
- Ferreira J. C., Bacurau A. V., Evangelista F. S., Coelho M. A., Oliveira E. M., Casarini D. E., Krieger J. E., Brum P. C. (2008). The role of local and systemic renin angiotensin system activation in a genetic model of sympathetic hyperactivity-induced heart failure in mice. Am. J. Physiol. Regul. 294, R26–R32 [DOI] [PubMed] [Google Scholar]
- Gilbert P. M., Havenstrite K. L., Magnusson K. E., Sacco A., Leonardi N. A., Kraft P., Nguyen N. K., Thrun S., Lutolf M. P., Blau H. M. (2010). Substrate elasticity regulates skeletal muscle stem cell self-renewal in culture. Science 329, 1078–1081 [DOI] [PMC free article] [PubMed] [Google Scholar]
- Gillis J. M. (1999). Understanding dystrophinopathies: an inventory of the structural and functional consequences of the absence of dystrophin in muscles of the mdx mouse. J. Muscle Res. Cell Motil. 20, 605–625 [DOI] [PubMed] [Google Scholar]
- Grounds M. D. (2008). Two-tiered hypotheses for Duchenne muscular dystrophy. Cell. Mol. Life Sci. 65, 1621–1625 [DOI] [PMC free article] [PubMed] [Google Scholar]
- Horsley V., Jansen K. M., Mills S. T., Pavlath G. K. (2003). IL-4 acts as a myoblast recruitment factor during mammalian muscle growth. Cell 113, 483–494 [DOI] [PubMed] [Google Scholar]
- Horst D., Ustanina S., Sergi C., Mikuz G., Juergens H., Braun T., Vorobyov E. (2006). Comparative expression analysis of Pax3 and Pax7 during mouse myogenesis. Int. J. Dev. Biol. 50, 47–54 [DOI] [PubMed] [Google Scholar]
- Joseph-Silverstein J., Consigli S. A., Lyser K. M., Ver Pault C. (1989). Basic fibroblast growth factor in the chick embryo: immunolocalization to striated muscle cells and their precursors. J. Cell Biol. 108, 2459–2466 [DOI] [PMC free article] [PubMed] [Google Scholar]
- Kuang S., Chargé S. B., Seale P., Huh M., Rudnicki M. A. (2006). Distinct roles for Pax7 and Pax3 in adult regenerative myogenesis. J. Cell Biol. 172, 103–113 [DOI] [PMC free article] [PubMed] [Google Scholar]
- Kuraitis D., Zhang P., Zhang Y., Padavan D. T., McEwan K., Sofrenovic T., McKee D., Zhang J., Griffith M., Cao X., et al. (2011). A stromal cell-derived factor-1 releasing matrix enhances the progenitor cell response and blood vessel growth in ischaemic skeletal muscle. Eur. Cell. Mater. 22, 109–123 [DOI] [PubMed] [Google Scholar]
- Kuraitis D., Ebadi D., Zhang P., Rizzuto E., Vulesevic B., Padavan D. T., Al Madhoun A., McEwan K. A., Sofrenovic T., Nicholson K., et al. (2012a). Injected matrix stimulates myogenesis and regeneration of mouse skeletal muscle after ischaemic injury. Eur. Cell. Mater. 24, 175–195, discussion 195–196. [DOI] [PubMed] [Google Scholar]
- Kuraitis D., Giordano C., Ruel M., Musarò A., Suuronen E. J. (2012b). Exploiting extracellular matrix-stem cell interactions: a review of natural materials for therapeutic muscle regeneration. Biomaterials 33, 428–443 [DOI] [PubMed] [Google Scholar]
- Livak K. J., Schmittgen T. D. (2001). Analysis of relative gene expression data using real-time quantitative PCR and the 2(−Delta Delta C(T)) method. Methods 25, 402–408 [DOI] [PubMed] [Google Scholar]
- Miller R. J., Banisadr G., Bhattacharyya B. J. (2008). CXCR4 signaling in the regulation of stem cell migration and development. J. Neuroimmunol. 198, 31–38 [DOI] [PMC free article] [PubMed] [Google Scholar]
- Mitchell P. O., Pavlath G. K. (2004). Skeletal muscle atrophy leads to loss and dysfunction of muscle precursor cells. Am. J. Physiol. Cell Physiol. 287, C1753–C1762 [DOI] [PubMed] [Google Scholar]
- Musarò A., Barberi L. (2010). Isolation and culture of mouse satellite cells. In Methods in Molecular Biology, vol. 633 (ed. Ward A., Tosh D.), pp. 101–111 New York: Springer; [DOI] [PubMed] [Google Scholar]
- Nagaraju K., Raben N., Merritt G., Loeffler L., Kirk K., Plotz P. (1998). A variety of cytokines and immunologically relevant surface molecules are expressed by normal human skeletal muscle cells under proinflammatory stimuli. Clin. Exp. Immunol. 113, 407–414 [DOI] [PMC free article] [PubMed] [Google Scholar]
- Pradat P. F., Barani A., Wanschitz J., Dubourg O., Lombès A., Bigot A., Mouly V., Bruneteau G., Salachas F., Lenglet T., et al. (2011). Abnormalities of satellite cells function in amyotrophic lateral sclerosis. Amyotroph. Lateral Scler. 12, 264–271 [DOI] [PubMed] [Google Scholar]
- Ratajczak M. Z., Majka M., Kucia M., Drukala J., Pietrzkowski Z., Peiper S., Janowska-Wieczorek A. (2003). Expression of functional CXCR4 by muscle satellite cells and secretion of SDF-1 by muscle-derived fibroblasts is associated with the presence of both muscle progenitors in bone marrow and hematopoietic stem/progenitor cells in muscles. Stem Cells 21, 363–371 [DOI] [PubMed] [Google Scholar]
- Relaix F., Montarras D., Zaffran S., Gayraud-Morel B., Rocancourt D., Tajbakhsh S., Mansouri A., Cumano A., Buckingham M. (2006). Pax3 and Pax7 have distinct and overlapping functions in adult muscle progenitor cells. J. Cell Biol. 172, 91–102 [DOI] [PMC free article] [PubMed] [Google Scholar]
- Renault V., Piron-Hamelin G., Forestier C., DiDonna S., Decary S., Hentati F., Saillant G., Butler-Browne G. S., Mouly V. (2000). Skeletal muscle regeneration and the mitotic clock. Exp. Gerontol. 35, 711–719 [DOI] [PubMed] [Google Scholar]
- Rio D. C., Ares M., Hannon G. J., Nilsen T. W. (2010). Purification of RNA using TRIzol (TRI reagent). Cold Spring Harb. Protoc. 2010, doi: 10.1101/pdb.prot5439 [DOI] [PubMed] [Google Scholar]
- Serrano A. L., Baeza-Raja B., Perdiguero E., Jardí M., Muñoz-Cánoves P. (2008). Interleukin-6 is an essential regulator of satellite cell-mediated skeletal muscle hypertrophy. Cell Metab. 7, 33–44 [DOI] [PubMed] [Google Scholar]
- Sheehan S. M., Allen R. E. (1999). Skeletal muscle satellite cell proliferation in response to members of the fibroblast growth factor family and hepatocyte growth factor. J. Cell. Physiol. 181, 499–506 [DOI] [PubMed] [Google Scholar]
- Sheehan S. M., Tatsumi R., Temm-Grove C. J., Allen R. E. (2000). HGF is an autocrine growth factor for skeletal muscle satellite cells in vitro. Muscle Nerve 23, 239–245 [DOI] [PubMed] [Google Scholar]
- Shireman P. K., Contreras-Shannon V., Ochoa O., Karia B. P., Michalek J. E., McManus L. M. (2007). MCP-1 deficiency causes altered inflammation with impaired skeletal muscle regeneration. J. Leukoc. Biol. 81, 775–785 [DOI] [PubMed] [Google Scholar]
- Straub V., Campbell K. P. (1997). Muscular dystrophies and the dystrophin-glycoprotein complex. Curr. Opin. Neurol. 10, 168–175 [DOI] [PubMed] [Google Scholar]
- Tatsumi R., Anderson J. E., Nevoret C. J., Halevy O., Allen R. E. (1998). HGF/SF is present in normal adult skeletal muscle and is capable of activating satellite cells. Dev. Biol. 194, 114–128 [DOI] [PubMed] [Google Scholar]
- Tidball J. G. (2005). Inflammatory processes in muscle injury and repair. Am. J. Physiol. 288, R345–R353 [DOI] [PubMed] [Google Scholar]
- Turner N. J., Badylak S. F. (2012). Regeneration of skeletal muscle. Cell Tissue Res. 347, 759–774 [DOI] [PubMed] [Google Scholar]
- Willmann R., De Luca A., Benatar M., Grounds M., Dubach J., Raymackers J.-M., Nagaraju K. (2012). Enhancing translation: guidelines for standard pre-clinical experiments in mdx mice. Neuromuscul. Disord. 22, 43–49 [DOI] [PMC free article] [PubMed] [Google Scholar]