

Abstract
The construction and performance of a Ka-band pulsed electron paramagnetic resonance (EPR) cryogenic probehead that incorporates dielectric resonator (DR) is presented. We demonstrate that the use of DR allows one to optimize pulsed double electron–electron resonance (DEER) measurements utilizing large resonator bandwidth and large amplitude of the microwave field B1. In DEER measurements of Gd-based spin labels, use of this probe finally allows one to implement the potentials of Gd-based labels in distance measurements. Evidently, this DR is well suited to any applications requiring large B1-fields and resonator bandwidths, such as electron spin echo envelope modulation spectroscopy of nuclei having low magnetic moments and strong hyperfine interactions and double quantum coherence dipolar spectroscopy as was recently demonstrated in the application of a similar probe based on an loop-gap resonator and reported by Forrer et al. (J Magn Reson 190:280, 2008).
1 Introduction
In the course of the introduction of Gd(III)-based labels (GdL) for distance measurements by Ka-band double electron–electron resonance (DEER) [1, 2], it became apparent that realization of the full potentials intrinsic to these labels is problematic due to limitations caused by our current probe design. The existing probe is based on a cylindrical, nominally single–mode volume resonator (SMVR) [3]. The shortcomings of SMVR for GdL DEER experiments were evident from our recent research [1, 2]. A specific feature of GdL (as compared with commonly used nitroxide radical labels) is that the shorter pulses used, the larger absolute DEER effect that can be achieved. (The absolute DEER effect, η = V0λ [2], is defined as a product of the normalized amplitude of ESE signal V0 generated by observation pulses and the spin flip probability, λ.) However, to accommodate shorter pulses and larger separation between pumping, νp, and observation, νo, frequencies, the quality factor of the resonator, Q, has to be decreased accordingly. The decrease is detrimental to the resonator “pulse power efficiency” or “conversion factor”, Λ = B1/√Pin, which relates the input microwave (mw) power, Pin with amplitude of mw field, B1. Since the Pin, is fixed and limited, one always has to compromise between Q, pulse duration/pulse amplitude and the separation between the frequencies, νp and νo. For instance, in our recent work [2], where SMVR was employed, such a compromise was somehow achieved when the Q value was about 300. At Pin ~100 W, it was possible without significant distortions to produce and accommodate pumping and observation (π) pulses of ~15 and 30–40 ns, respectively, and set the separation between νp and νo as δν ~120 MHz, thus essentially avoiding interference between the pumping and observation spectral profiles. The correct conditions for the DEER experiment in Ref. [2] were therefore basically sustained, but (π) pulse durations were far from optimal, and the DEER performance, therefore, was quite mediocre.
The popular ways to improve probe performance are well known: the SMVR has to be replaced by either a dual mode resonator (DMR), a loop-gap resonator (LGR or bridged-LGR) or a dielectric resonator (DR). The virtues and shortcomings of these types of resonators were extensively discussed in the literature [4–13]. Moreover, the design and test data of pulsed Ka-band LGRs and W-band DMR were recently published in detail by Forer et al. [14] and Bennati et al. [15], respectively. Encouraging data on the performance of DR in a commercial Q-band Bruker pulsed EPR instrument have been also reported [16]; however, specifics necessary to reproduce the design are lacking.
As a result, at least three options, mentioned above, are available to improve performance of our probe. After careful consideration of the published results and our own experience (http://www.cbc.arizona.edu/facilities/epr_facility_equipment), we preferred DR to the other two options. The ultimate reasons for this choice were (i) relative simplicity of DR in manufacturing (fewer parts and relative tolerance to machining imprecision), as compared with the other two options, and (ii) probe size constraints imposed by the cryostat (CF530, Oxford) in use. We report below details of design of the new probe and improvements in GdL DEER resulting from its use.
2 Ka-Band DR: Probe Design and Performance
2.1 Resonator Design
Following the simplest common design, the DR in the present work is made from a drilled-dielectric cylinder placed in a conductive shield, whose internal dimensions are an exact match to external dimensions of the cylinder. The best choice of dielectric material for cryogenic probes is sapphire since its dielectric constant, ε′, does not depend on the temperature and dielectric losses are small. The approximate dimensions of the DR operating at a resonance frequency (νres) of the nominally fundamental mode TE011 are in about √ε′ times less than the dimensions of an SMVR operating at the same νres [4].
The relationship between νres and the dimensions of an SMVR is well understood [3, 4], and the approximate DR dimensions can therefore be readily evaluated and serve as a starting point in empirical resonator design. Empirical, “trial and error” design is, however, time- and material-consuming. It appears to be more sensible to initially simulate the resonator, using appropriate software, manufacture it, and then apply minor dimension adjustments to match the wanted νres. This approach was utilized in this work, and we started our resonator design with simulations of cylindrical cavities filled with air (VR) or sapphire (DR), and coupled to WR28 rectangular waveguide through a circular iris. In our simulations, we used the CST Microwave Studio Finite Element software (CST GmbH, Germany) [17]. Although our instrument allows operation over the entire Ka-band (26.5–40 GHz), the idea was to design a DR in which the fundamental mode resonates somewhere in the middle of Ka-band (33–34 GHz) where the TWTA output is maximal [18]. Since it is rather easy to increase νres of DR by drilling a larger sample hole, the νres and size of the sample hole (dSH) in the simulations were deliberately set to relatively small values of ~32 GHz and 1.7 mm, respectively. Given that adjustments were expected, no efforts were made for constructing a very fine mesh and high level of convergence of calculations in simulations, which saved very long time runs. The results of the simulations and the parameters of the experimental resonator are presented in Table 1, while Fig. 1 illustrates the calculated distribution of magnetic field densities in VR and DR. As evident from Fig. 1, the magnetic field distribution in DR departs from the cylindrical symmetry of the TE011 mode. Additional simulations allowed us to understand that the distortion of B1 symmetry in DR is caused by a rather large iris and sample hole. Decrease in their sizes results in decrease of distortions. Therefore, strictly speaking, the mode observed in DR is derived from the TE011 mode but does not maintain it. By this reasoning in following discussion we refer to it as to underline origin and distortion.
Table 1.
Dimensions of the volume (VR) and dielectric (DR) resonators operating in TE011 and as modes at νres = 32 GHz obtained by numerical simulations, the dimensions of the actual DR and its relevant parameters
| Dimensions and νres | Calculated VR | Calculated DR | Actual DR |
|---|---|---|---|
| Cavity length | 12.3 | 3.8 | 4.0 |
| Cavity i.d. or o.d. of the sapphire cylinder | 12.3 | 4.25 | 4.25 |
| Sample hole diameter (dSH) | – | 1.7 | 1.9 |
| Iris diameter | 2.7 | 2.0 | 2.0 |
| Coupling wall thickness | 0.32 | 0.32 | 0.2 |
| Sample tube o.d/i.d | 3/2.8 | 1.7/1.5 | 1.8/1.5 |
| Diameter of the holes in the upper/lower plugs | 3.2/1.0 | 1.8/1.0 | 2.0/1.0 |
| νres (GHz) | 31.598 | 32.24 | ~34.5a |
| QL, sample volume (mm3) and conversion factor (mT/√W) | ~180; 5–6; ≥0.2 |
All dimensions are in millimeters; Radial and axial dielectric constants of sapphire used in simulations were 9.345 and 11.585, respectively; Drilled-sapphire cylinder was manufactured by Insaco Corp. (http://www.insaco.com/MatPages/mat_display.asp?M=Sapphire)
Resonance frequency of the actual DR with the inserted CV1518S sample tube
Fig. 1.

Calculated distribution of magnetic energy in volume (upper panel) and dielectric (bottom panel) resonators, parameters of which are presented in Table 1
We have found the calculated and experimental νres for an air-filled VR to be in good agreement. Thus, we proceeded to use the dimensions of the DR determined in simulations as a starting point in DR manufacturing. The drilled-sapphire cylinder (o.d. = 4.25 mm; dSH = 1.7 mm; h = 4 mm) was placed in the housing shown in Fig. 2. The νres of this DR was found to be about 32 GHz and agreed well with the value found in simulations. To increase the resonant frequency and make sample loading more convenient, we gradually increased dSH (4 adjustments of 0.05 mm each) using diamond-plated (220 grit) mandrels. The adjustment was completed at a nominal dSH = 1.9 mm. Conveniently, this dSH accommodates the commercial, highly size uniform VitroCom quartz tubing CV1518S (o.d. = 1.8 mm; i.d. = 1.5 mm), thereby standardizing and greatly simplifying the sample preparation and loading operations. The νres of the DR with inserted CV1518S was found between 34.0 and 35 GHz depending on the sample content and coupling pin position.
Fig. 2.
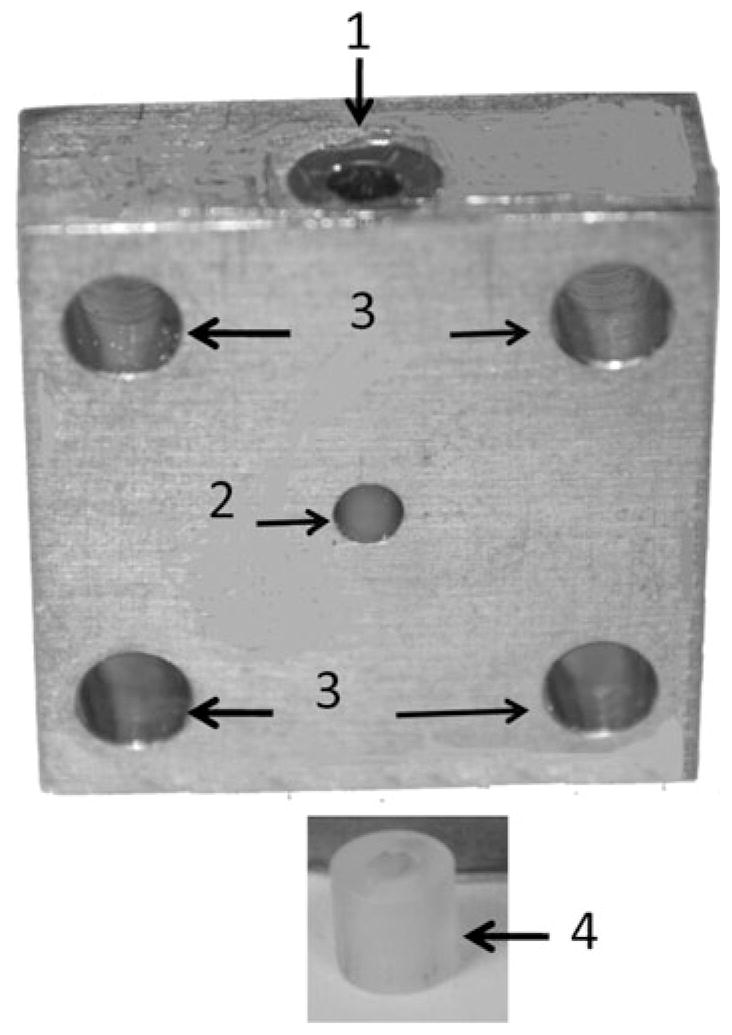
Dielectric resonator assembly. (1) upper plug; (2) coupling hole; (3) assembly holes to waveguide flange; (4) drilled-sapphire cylinder, depicted outside of housing. Critical dimensions are shown in Table 1
2.2 Probe Design
The outside dimensions as well as positions and sizes of assembly holes of the resonator housing match those of the WR28 flange (WGF28-B12, Space Machine Co) as shown in Fig. 2. The resonator was coupled via an iris coupler to the WR28 waveguide. The coupler was made of a slightly tapered metal pin (d = 1 mm) attached to a plate, which, in turn, was attached to the tuning shaft. The coupling pin is placed into a hole drilled in the waveguide flange of cast miter 90° H-bend (PH 28-90 of Penn Engineering), directly connected to the housing. The distance between the pin center and the flange face was 0.6 mm.
For sample exchange, we used a standard Bruker ER 4118SR sample rod. The sample clamp was, however, modified to match the o.d. of a CV1518S sample tube with minimal tolerance. The sample rod was guided to the resonator opening by stainless (s.s.) thin wall tubing (3/8″o.d., 0.01″wall thickness) inside which several Teflon washers (9.02 mm o.d., 8.1 mm i.d., 5 mm height) were stacked to center the sample rod. In turn, the position of the s.s. tubing was adjusted by plastic supports attached to the waveguide. The upper part of the probe head is similar to our earlier design [3] and the design suggested in Ref. [14]. It consists of an s.s. vacuum flange (MDC Vacuum) that clamps to the top flange of an Oxford CF 935 cryostat. The thin wall s.s. WR28 waveguide and two s.s. MDC Vacuum “quick disconnects” (one for sample rod access and the other one for the drive shaft of the coupling control) are hard soldered onto the flange cover. To enable cryogenic operations, the probe was separated from the external atmosphere by placing a Teflon film (10 μm thick) between the waveguide flange of the probe and the external waveguide flange. The proper seal was insured by an O-ring, placed in the groove machined in the flange.
2.3 Resonator Properties: Quality Factor, Pulse Power Efficiency and Background Signal
The resonator properties were evaluated in situ under typical pulsed EPR experimental conditions. The probe was placed into the cryostat, cooled down to 10–20 K (depending on the type of the sample), and the sample, dummy or containing paramagnetic species, was loaded into resonator. The coupling was monitored by observing the shape of the reflected pulses. Critical coupling was readily achieved by variation of the position of the coupling pin or the pin and sample together. The loaded Q value (QL) was determined in the following manner. With the resonator critically coupled at νres, the measurements of the relative incident power S(δr), required to maximize the primary spin echo signal (ESE) were performed as a function of the frequency offset, δr = νres − ν. The results of the measurements are presented in Fig. 3 in customarily used units, dB, S(δ;r) = (20lg(P(δr)/P(0))). From the S(δr), presented in Fig. 3, the characteristic bandwidth of the resonator, ~190 MHz, can be estimated in the standard way from the frequency difference at the −3 dB level. The resonance frequency in this particular measurement was 34.524 GHz and the quality factor, QL, therefore, was about 180. The lower limit of the pulse power efficiency Λ= 0.2 mT/W1/2 was evaluated assuming that the mw power at the resonator input is close to the nominal value of the TWTA output power (~200 W) [18]. Both QL and Λ are comparable with the respective parameters observed for those of a LGR [14] with similar dSH of 2 mm. For reader’s convenience, QL, Λ and typical sample volume are also presented in Table 1.
Fig. 3.

Relative incident mw power (expressed in dB units as ) required to maximize the primary ESE signal as a function of the frequency offset, δr = νres ‒ν. The primary ESE was generated by two 2π/3 pulses of 40-ns duration. The paramagnetic species in the sample was Mo(V) (S=1/2); measurement temperature, 20 K
For dielectric resonators, it is common to have a set of secondary resonances, which can sometimes be used for “pseudo dual mode” DEER measurements. This DR is no exception and has secondary resonances around 35–36 GHz, which were utilized for short-distance measurements.
One of typical shortcomings which limited the use of DR in cryogenic applications, at least in earlier years, is the apparent presence of background signal due to paramagnetic ion impurities in sapphire. In our homebuilt X- and Ku-band DRs we did observe such background signals, although they were either weak or located outside the range of the magnetic fields of interest, and thus did not interfere with the measurements. In this particular case, to evaluate the background signal, we performed measurements of ESE-detected (primary echo) pulsed EPR spectra in the temperature range 10–20 K and field range from 0.8 to 1.5 T (g values range between 3.1 and 1.66) and did not observe any background signal. As a comparison, for a sample which contained ~0.2 mM of Mo(V) at normalized acquisition conditions, the S/N was ~3 × 10². Such a comparison gives a clear idea about the sapphire purity.
2.4 Performance
Two types of experiments were performed to demonstrate the particular intrinsic properties of the DR that are important for substantial improvement in DEER measurements of GdL: ability to accommodate short pulses without distortion and superior pulse power efficiency at lower Q value. Firstly, we re-examined the problem of short-distance measurements between GdLs. Previously, attempts were made to determine distance distribution function, ϕ(r), between Gd(III) in model bis-Gd(III) complexes in which GdLs are attached to flexible “arms” which allow various complex configurations for which distances between Gd ions could be somewhere between ~5 and ~26 Å [1]. In pulsed DEER, only pairs for which a “unit” of dipolar interaction, , (designations are customary) is comparable or less than the amplitude B1 of the (π) pumping pulse, participate in forming the DEER time domain pattern (TDP). If the pumping pulse is too long then only a part of ϕ(r) can be detected. Overly long-observation pulses also distort the DEER TDP and, ultimately, the distance distribution ϕ(r) estimated from the measurements.
In our previous work [1], where VR was used, the best achieved pulse parameters were 12 ns for (π) pumping pulse and 30 ns for (π) observation pulse at a frequency separation between pumping and observation frequencies, δν, around 200 MHz. For such an experimental setup, less than 50% of all possible complex configurations were detectable in DEER. In the present work, we repeated the measurements using the DR. To avoid any possible spectral interference between the pumping and observation pulses, the “pseudo dual mode” setup was used: pumping frequency, νp, was placed in the center of a well-defined resonance mode (νp = νres = 34.488 GHz) and νo, was placed in the center of one of secondary resonances (νo = ν′res = 35.248 GHz), which provided a frequency separation, δν = 760 MHz. At a pumping (π) pulse duration of 8 ns and an observation (π) pulse of 15 ns, such a δν exceeded the combined spectral width of the pulses (≈190 MHz) by approximately four times. This was certainly more than enough to avoid overlap of spectral profiles [2] of the pulses.
The time domain pattern, V(t), collected using the DR is presented in trace 2 of Fig. 4a. The positions in the EPR spectrum in resonance with νp and νo are indicated in Fig. 5. For comparison, trace 1 in Fig. 4 shows V(t) collected previously using an SMVR [1]. A trivial processing described in Ref. [1] allows one to separate the total V(t) to the contributions corresponding to the intra-pair and inter-pair dipole interactions: V(t)ia and V(t)ir, respectively. As is evident from Fig. 4b, the use of the DR results in an impressive (~3.2-fold) increase of the V(t)ia asymptotic decay and in an improved definition of the initial part of the kinetics which is apparently distorted in previous measurements. The asymptotic intra-pair DEER effect (V(t)ia at t → ∞) composed of the spin flip probability, λ, and the part of ϕ(r) involved in the DEER formation [1]. The V(t)ia obtained in this work (trace 2 in Fig. 4b) was analyzed in the same manner as in [1, 2] to obtain ϕ(r). From this analysis, we found that practically all of the possible distances between GdL (90–100%) contribute to this TDP, as compared with 40–50% evaluated from trace 1. Finally, the distance distribution function, ϕ(r), obtained from processing TDP (trace 2 of Fig. 4b) obtained in this work by means of DEER Analysis [19] is presented in Fig. 6. For the sake of comparison, ϕ(r) found in previous work [1] is also presented in Fig. 6.
Fig. 4.
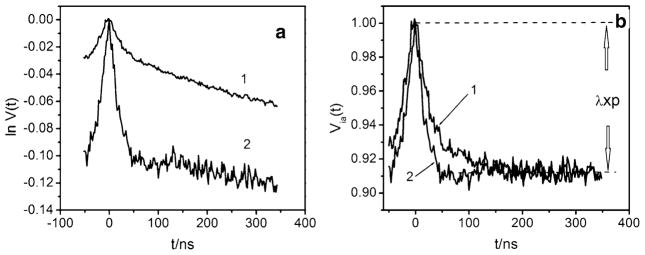
a. Normalized DEER time domain patterns, lnV(t), of bis-Gd(III) complex C2-Gd595 described in [1]. Traces (1) and (2) were collected in previous [1] and present work, respectively. Pumping pulse in both experiments was applied to the maximum for the−1/2 ↔ 1/2 transition, as shown in Fig. 5. Measurements conditions for trace 1: tp = 12 ns (π), to = 30 ns (π), νp = 29.964 GHz, νo = 29.764 GHz (dν = 200 MHz), temperature, 15 K, complex concentration, 0.5 mM. Measurements conditions for trace 2: tp = 8 ns (π), to = 15 ns (π), νp = 34.488 GHz, νo = 35.248 GHz (δν = 760 MHz), temperature, 10 K, complex concentration, 0.25 mM. b Inter-pair DEER kinetics, V (t)ias, extracted from V(t)s of panel a. The asymptotic DEER effects in traces 1 and 2 are equalized by applying a scaling factor of 3.2 to trace 1. The increase of the asymptotic decay in trace 2 (as compared with trace 1) is caused by the higher spin flip probability, λ, and an increase in the relative amount of complex configurations, p, contributing to DEER
Fig. 5.

ESE-detected field sweep EPR spectrum of bis- Gd(III) complex. The mw frequency in this experiment is 34.488 GHz and coincides with νp for the experiment presented in Fig. 4. Dashed lines indicate positions of spectrum used for observation in short (o1) and long-distance measurements (o2). Pumping is always applied to maximum of the spectra as indicated by solid line, marked as “p”
Fig. 6.

Traces (1) and (2): distance distribution functions, ϕ(r)’s between two Gd(III) ions in bis-Gd(III) complex, C2-Gd595. The ϕ(r) (1) was derived in previous work [1] (see Fig. 7 of ref [1]). The ϕ(r) (2) was derived by processing V (t)ia, trace 2 of Fig. 4b, obtained in this work. The DEERAnalysys, Gaussian fit option [19], was used for this processing. The ϕ(r)’s (1) and (2) are normalized to 0.4 and unity, respectively, in accordance with relative number of complex configurations observable by DEER
Secondly, to evaluate benefits of using the DR in long-distance DEER measurements, we repeated the recently reported pulsed-DEER experiments [2] for double stranded Gd(III)-labeled oligonucleotides, in which distances between labels were in the range 50–70 Å. While the objectives in short- and long-distance measurements are generally the same, the emphasis in the latter is on sensitivity rather than on shorter pulse duration and the lack of spectral overlap of pumping and observation profiles. Therefore, in contrast to the short-distance measurements, both νo and νp are accommodated within a single resonance mode. In our previous work [2], where an SMVR was used, the best DEER pattern (trace 1 in Fig. 7a) was obtained with a 15 ns (π) pumping and 20 ns (π/2) observation pulses, and δν = |νp − νo| ~120 MHz. The parameters achieved in this work are: 10 ns (π) pumping and 17 ns (π) observation pulses, and δν ~180 MHz. In the rigorous sense, such a frequency separation was not enough to completely avoid overlap of observation and pumping spectral profiles, nevertheless it was the optimal setting for this particular experiment to obtain the best signal-to-noise (S/N) ratio in the time domain pattern at a given acquisition time. The TDP, collected in this work are presented together with earlier results [2] in Fig. 7.
Fig. 7.
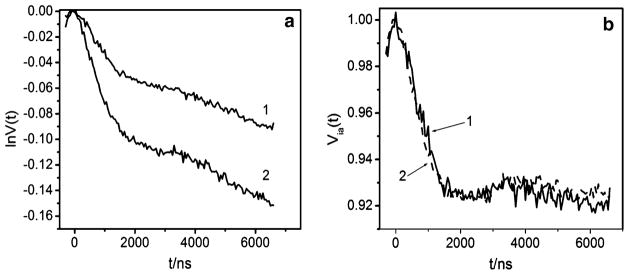
a. Normalized DEER time domain patterns, V(t), of double stranded Gd(III)-labeled oligonucleotides. Traces 1 and 2 were collected in previous [2] and present work, respectively. Position of EPR spectrum used for observation is marked as (o2) in Fig. 5; pumping applied to maximum of the EPR spectrum marked as “p”. Experimental conditions for trace 1: Gd(III) concentration, 80 μm; observation (π/2) pulse, 20 ns; pumping (π) pulse, 15 ns; temperature, 10 K; νp, 29.98 GHz; νo, 29.86 GHz; repetition rate, 2 kHz; time of acquisition, 60 min. Experimental conditions for trace 2: pumping π-pulse, 10 ns; observation pulses: 8 ns(π/2), 17 ns(π), 17 ns(π); temperature, 10 K; νo = 34.620 GHz νp = 34.440 GHz (δν = 180 MHz), Gd(III) concentration, 60 μM; repetition rate, 1 kHz, acquisition time: 40 min. b Intra-pair DEER kinetics, V(t)ias, extracted from experimental TDPs shown in panel a. The asymptotic DEER effects in traces 1 and 2 are equalized by applying a scaling factor of 2 to trace 1
It is evident from Fig. 7a that the asymptotic intra-pair decay for trace collected in the DR is about twice larger than that obtained in previous measurements, which is expected due to the increased spin flip probability. For the direct comparison, V(t)ia were extracted from the total TDPs and their asymptotic amplitudes were adjusted to the same value as presented in Fig. 7b. The magnitude of the noise level in the TDP, obtained with the DR is about 1.5 times less than that for the VR. (The magnitude of the noise level was evaluated as where S is the DEER trace, S′ is the low-order spline which reproduces the shape of the trace, and N is the number of steps over the time interval in which the signal was collected). Taking into account all other factors such as the difference in concentration, repetition rate and accumulation time, the approximate S/N gain due to use of the DR is estimated as 300%, even though the volume of the sample was decreased by a factor of about 4. Thus, the use of the DR in Ka-band DEER measurements has allowed us to fully realize the potential advantages offered by GdLs both in the short- and long-distance measurements. In short-distance measurements, the ability of the DR to accommodate short-mw pulses without spectral overlap shifts shortdistance threshold of the measurable distances down to ~8–9 Å. For long-distance measurements, the improved S/N enables simple and routine distance measurements of up to 60 Å, while significantly longer distances of up to 80–90 Å. can still be measured in a reasonable time.
3 Conclusion
In this work we implemented and tested a simple, inexpensive Ka-band pulsed EPR probe that incorporates a dielectric resonator and operates at cryogenic temperatures in standard cryogenic equipment. Although the primary goal was to realize the potentials of Gd-based labels in distance measurements, the use of this probe is certainly not limited by this single application. The DR is well suited to any applications requiring large B1-fields and resonator bandwidths, such as electron spin echo envelope modulation spectroscopy of nuclei having low magnetic moments and strong hyperfine interactions, double quantum coherence (DQC) dipolar spectroscopy etc., as was recently demonstrated in the application of a similar probe based on an LGR [14].
Acknowledgments
This research was supported by the Binational Science Foundation (USA-Israel, BSF#2006179), NIH 1R01 EB005866-01, 5R01EB00586-6 and S10RR020959, NSF DBI-0139459, DBI- 9604939 and BIR-922443. A.R. is grateful to I. Kaminker and Drs. A. Feintuch and D. Goldfarb of the Weizmann Institute of Science for stimulating discussions. A.R. acknowledges a fine job on the manufacturing and assembly of the probe parts by Mr. L. Macomber and Mr. E. Autz of the Department of Chemistry and Biochemistry machine shop.
Footnotes
Note added in proof
We would like to acknowledge the paper by E. Reijerse et al. (J. Magn Reson (2011), doi:10.1016/j. jmr.2011.11.011) dedicated to a new construction of tunable general purpose volume Q-band resonator. It was published after our manuscript was accepted for publication.
Contributor Information
A. Raitsimring, Email: arnold@u.arizona.edu, Department of Chemistry and Biochemistry, University of Arizona, 1306 E. University Blvd, Tucson, AZ 85721-0041, USA
A. Astashkin, Department of Chemistry and Biochemistry, University of Arizona, 1306 E. University Blvd, Tucson, AZ 85721-0041, USA
J. H. Enemark, Department of Chemistry and Biochemistry, University of Arizona, 1306 E. University Blvd, Tucson, AZ 85721-0041, USA
A. Blank, Schulich Faculty of Chemistry, Technion, Israel Institute of Technology, 32000 Haifa, Israel
Y. Twig, Schulich Faculty of Chemistry, Technion, Israel Institute of Technology, 32000 Haifa, Israel
Y. Song, Department of Chemistry, Northwestern University, 2145 Sheridan Road, Evanston, IL 60208, USA. Department of Biochemistry, Cell Biology, and Molecular Biology, Northwestern University, 2145 Sheridan Road, Evanston, IL 60208, USA. Department of Neurobiology and Physiology, Northwestern University, 2145 Sheridan Road, Evanston, IL 60208, USA. Department of Radiology, Northwestern University, 2145 Sheridan Road, Evanston, IL 60208, USA
T. J. Meade, Department of Chemistry, Northwestern University, 2145 Sheridan Road, Evanston, IL 60208, USA. Department of Biochemistry, Cell Biology, and Molecular Biology, Northwestern University, 2145 Sheridan Road, Evanston, IL 60208, USA. Department of Neurobiology and Physiology, Northwestern University, 2145 Sheridan Road, Evanston, IL 60208, USA. Department of Radiology, Northwestern University, 2145 Sheridan Road, Evanston, IL 60208, USA
References
- 1.Potapov A, Song Y, Meade TJ, Goldfarb D, Astashkin AV, Raitsimring A. J Magn Reson. 2010;205:38. doi: 10.1016/j.jmr.2010.03.019. [DOI] [PMC free article] [PubMed] [Google Scholar]
- 2.Song Y, Meade TJ, Astashkin AV, Klein EL, Enemark JH, Raitsimring A. J Magn Reson. 2011;210:59. doi: 10.1016/j.jmr.2011.02.010. [DOI] [PMC free article] [PubMed] [Google Scholar]
- 3.Astashkin AV, Enemark JH, Raitsimring AM. Concepts Magn Reson B. 2006;29B:125. [Google Scholar]
- 4.Poole CP. Electron Spin Resonance. A Comprehensive Treatise on Experimental Techniques. Wiley; New York: 1983. [Google Scholar]
- 5.Froncisz W, Oles T, Hyde J. Rev Sci Instrum. 1986;57:1095. [Google Scholar]
- 6.Wood R, Froncisz W, Hyde J. J Magn Reson. 1984;58:243. [Google Scholar]
- 7.Pfenninger S, Forrer J, Schweiger A, Weiland T. Rev Sci Instrum. 1988;59:752. [Google Scholar]
- 8.Forrer J, Pfenninger S, Schweiger A, Weiland Th. Magn Reson Relat Phenom. 1989;219:919. [Google Scholar]
- 9.BrukerBioSpin. Bruker ER4116DM dual mode resonator. http://www.bruker-biospin.com/epr_res_dualmode.html.
- 10.Hyde JS, Chien JCW, Freed JH. J Chem Phys. 1968;48:4211. [Google Scholar]
- 11.Mett RR, Sidabras JW, Golovina IS, Hyde JS. Rev Sci Instrum. 2008;79:094702. doi: 10.1063/1.2976033. [DOI] [PMC free article] [PubMed] [Google Scholar]
- 12.Golovina IS, Kolesnik SP, Geifman IN, Belous AG. Rev Sci Instrum. 2010;81:044702. doi: 10.1063/1.3378287. [DOI] [PubMed] [Google Scholar]
- 13.Blank A, Stavitski E, Levanon H, Gubaydullin F. Rev Sci Instrum. 2003;74:2853. [Google Scholar]
- 14.Forrer J, Garcıa-Rubio I, Schuhmam R, Tschaggelar R, Harmer J. J Magn Reson. 2008;190:280. doi: 10.1016/j.jmr.2007.11.009. [DOI] [PubMed] [Google Scholar]
- 15.Tkach I, Sicoli G, Höbartner C, Bennati M. J Magn Reson. 2011;209:341. doi: 10.1016/j.jmr.2011.01.012. [DOI] [PubMed] [Google Scholar]
- 16.BRUKER E-580 SuperQFT Q-band spectrometer. http://www.brukerbiospin.com/brukerepr/superqftbridge.htmlandhttp://www.bruker-biospin.com/epr_res_qband_ft.html.
- 17.CST Microwave Studio. CST GmbH; Darmstadt: http://www.cst.com. [Google Scholar]
- 18.Operation and Maintenance Manuel for the Model 187Ka TWT Amplifier. Applied Systems Engineering, Inc; Fort Worth: 2004. [Google Scholar]
- 19.Jeschke G, Chechik V, Ionita P, Godt A, Zimmermann H, Banham J, Timmel CR, Hilger D, Jung H. Appl Magn Reson. 2007;30:473. [Google Scholar]