Abstract
Daily administration of FDA-approved glatiramer acetate (GA) has beneficial effects on clinical course of relapsing remitting multiple sclerosis (RRMS). Although mechanisms of GA-action have been widely investigated and partially understood, immediate immune dynamics following GA-therapy are unknown. In present study, we characterized immediate effects of GA on phenotype, quantity and function of immune cells in MS patients. Prominent changes in immune cells were detected within 4–12h post-first GA-injection. T-cell modulation included significantly decreased CD4/CD8 ratio, perturbed homeostasis of predominantly CD8+ T-cells, significantly enhancement in CD8+ T-cell mediated suppression and inhibitory potential of induced CD4-suppressors. Changes in APC were restricted to monocytes and included reduced stimulatory capacity in MLR and significantly increased IL-10 and TNF-α production. Our study provides the first evidence that GA treatment induces rapid immunologic changes within hours of first dose. Interestingly, these responses are not restricted to innate immune cells but also include complex modulation of T-cell functionality.
Keywords: Glatiramer acetate, Multiple Sclerosis, Immunomodulation
1. Introduction
Underlying immune-pathogenesis of multiple sclerosis (MS) involves multi-focal demyelination and axonal loss caused by infiltration of myelin-reactive T cells into the CNS. However, the disease is much more complex and tissue injury in active CNS lesions is also associated with activated microglia and macrophages. Glatiramer acetate (GA) is an FDA-approved immunomodulatory agent for the treatment of relapsing remitting-MS (RRMS). GA is a synthetic polypeptide composed of glutamic acid, lysine, alanine and tyrosine in a defined molar ratio. Although the precise mechanism of GA action is still unclear, several immunologic effects of GA therapy have been described, including 1) immune deviation of CD4+ T cell responses from Th1 to Th2 [1–5] 2) induction of CD4+CD25+FoxP3+ regulatory T cells [6], 3) induction of oligoclonal, cytotoxic/suppressor CD8+ T cells [7–10], induction of immune modulatory Type II monocytes [11], and 5) induction of IL-10 producing B cells [12, 13]. However, the sequence of these interactions and the immediate immunologic effects of GA that may determine downstream effects on disease remain poorly understood. In fact, there has been no systemic dissection of the effects of early GA administration on immune cell phenotype and function. Several studies have documented altered immune cell effector functions upon short term exposure to GA. In accordance with this, GA is capable of inducing changes in antigen presenting cells (APC) function within hours of overnight in vitro cultures. Similarly, even in the absence of prior GA therapy, GA is able to induce in vitro CD4+ and CD8+ T cell responses from PBMC derived from healthy subjects and MS patients within a few days of culture [7, 9]. Therefore it is conceivable that following the first few injections, GA would show immediate in vivo immune effects that might dictate the eventual ability to develop a sustained immune regulatory response.
The present study is a novel comprehensive evaluation of immune alterations induced in T cell and APC populations during the first 72h of GA therapy. Treatment naïve RRMS patients initiating GA therapy were recruited for the study. Phenotypic and functional assays were performed on CD4+ T cells, CD8+ T cells, CD14+ monocytes, CD19+ B cells, BDCA1+ myeloid dendritic cells (MDC) and BDCA4+ plasmacytoid dendritic cell (PDC) populations. The results were compared to the control subjects comprising of healthy donors (HD) as well as untreated-treatment naïve RRMS patients, all of whom underwent a mock admission for specimen collection. We found that GA induces prominent phenotypic and functional changes in not only innate APC populations but also complex changes in T cells, particularly in the functional status of CD8+ T cells as early as 12h after the first injection. These studies provide important insights into the timeline of immune alterations and emphasize the need for longitudinal studies to assess their significance in determining long-term immune and clinical consequences.
2. Materials and Methods
2.1. Patients and control subjects
After obtaining informed consent, 7 healthy donors, 8 treatment- naïve RRMS patients initiating glatiramer acetate (GA) therapy, and 4 “untreated” treatment naïve RRMS patients were recruited for the study. At the time of monitoring, MS patients were free of steroid therapy for at least 3 months, and had no record of acute relapse within 3 months. None had a history of disease modifying therapy. All participants were admitted to the Clinical and Translational Research Center (CTRC) for overnight blood draws (0h baseline usually between 6–8 PM, followed by 4, 12 and 24 h post-first injection). The 24h collection was performed prior to the second daily GA injection. Participants were then released and asked to return for a 72h post-baseline blood draw (before their fourth daily shot of GA). Treatment decisions were determined by routine standard of care and patients were provided injection training during their first two GA injections. The healthy subjects and the untreated subjects served as important cohorts to control for potential diurnal variation of measured parameters. Thus, only the parameters that changed in the GA-treated cohort but not in the other two cohorts were considered an effect of GA therapy. All studies were approved by the UT Southwestern IRB according to Declaration of Helsinki principles.
2.2. Cell preparation and bead sorting
PBMC were isolated from whole blood using Ficoll Hypaque (GE Healthcare Biosciences, Pittsburg, PA) density gradient. In all cases, the 0h, 4h and 12h specimens were processed simultaneously and the 24h and 72h specimens were processed independently. This design was based on initial stability studies for ex vivo subset quantification (not shown). From PBMC preparations, purified CD8+, CD14+ and CD19+ cells were isolated using respective Miltenyi microbead positive selection kits. The CD19 depleted fraction was used for positive selection of BDCA1+ (MDC), and BDCA4+ (PDC) populations using respective microbeads. “Untouched” CD4+ T cells were then isolated using negative selection kits. CD25+ T-cells were positively sorted from the purified CD4+ fraction using CD25 microbeads. To prepare third party Teff (CD4+CD25−) cells and APC, PBMC were isolated from buffy coats of healthy donors using Ficoll Hypaque. APC fraction was prepared by depleting CD3+ T cells from PBMC using CD3+ microbeads. CD4+CD25− (responder) cells were obtained by negative sorting for CD4+ T cells followed by depletion of CD25+ cells. Both responder cells and APC were stored in freezing media in liquid nitrogen until further use in multiple assays. All magnetic microbeads were purchased from Miltenyi Biotech (Auburn, CA) and used according to manufacturer instructions, resulting in population purities >90–95%.
2.3. CFSE staining
Third party CD4+CD25− responder cells used in suppression assays were labeled with carboxyfluorescein diacetate succinimidyl ester (CFSE) (Invitrogen Molecular Probes, Eugene, OR), as described previously [14]. Briefly cells were suspended at 1 × 10⁶ cells/mL and incubated for 7 min at 37°C with 0.25uM CFSE, then washed twice with media containing 5% heat inactivated (HI) human serum.
2.4. Flow cytometry based suppression assays
Allogeneic 0. 1 × 10⁶ CFSE-stained CD4+ CD25− (Teff) cells and APC were co-cultured with varying ratios of CD4+CD25+ or CD8+ cells isolated from study participants in an anti-CD3 coated 96 well round bottom plates (Costar, Corning, NY) for 6 days. Cells were subsequently washed and stained for flow cytometry, as described later. Suppressive potential of regulatory T cells was assessed by normalizing the percent proliferative responses (%CFSE low CD4+) to the response without suppressors (defined as 100%), as described before [15].
2.5. Induced suppression assay
Induced suppressors from project participants were generated by culturing 2 × 10⁶ CD4+CD25− T cells with plate bound anti-CD3 for six days, as described previously [16]. At the end of the culture period, the induced cells were harvested and washed twice and then co-cultured in varying ratios with CFSE-labeled allogeneic third party CD4+CD25− responder cells and APC in anti-CD3 coated round bottom plates for 6 days. Cells were subsequently washed and stained for flow cytometry, as described below. Inhibitory potential of induced suppressors was evaluated by normalizing the percent proliferative responses (%CFSE low CD4+) to the response without suppressors (defined as 100%).
2.6. Mixed lymphocyte reaction
Antigen presenting cells (CD14+ & CD19+) and responder cells were isolated from PBMC by using microbeads as described earlier. APC were collected from project participants, while the responder cells were obtained from third party donors. For the allogeneic response assay, APC and responder cells were incubated together at a 1:10 (APC: Teff) ratio in a 96-well plate (Costar, Corning, NY), as described previously [17]. The MLR was harvested after 6 days in culture and stained for flow cytometry. APC stimulatory capacity was evaluated by enumerating CD25 expression and proliferation on responding T cells [17]. Additionally, responder cells isolated from project participants were co-cultured with APC from third party donors to assess the T cell activation potential of MS patients on GA therapy as compared to controls.
2.7. Flow cytometric antibody staining
For all the subjects, PBMC subset expression markers were evaluated on freshly isolated samples (1 × 10⁶ cells/ tube). Anti-human antibodies used for multi-color flow cytometric analysis included: CD4-PerCp-Cy5.5, CD8-AmCyan, CD45RO-Pacific Blue, CD27-FITC, CD19-PE-Cy7, CD14-PerCP, BDCA1-APC, and BDCA4-PE. All antibodies were obtained from BD Biosciences (San Jose, CA). Cells from suppression assays and MLR were washed with 0.1% (w/v) sodium azide/ phosphate-buffered saline (Mediatech Cellgro) and stained with anti-human CD4-PE & CD25-APC, then resuspended in 1% paraformaldehyde (Electron Microscopy Sciences, Hatfield, PA). Flow cytometric data were acquired on a 4-Laser LSRII using FACSDiva software (Becton Dickinson). Data were analyzed using Flow Jo (TreeStar, Ashland, OR).
2.8. Antigenic stimulation
2 × 10⁵ B cells, monocytes and MDC were separately placed in 96-well round bottom plates and stimulated with Staphylococcus aureus (pansorbin) (1:1000 dilution), LPS (5µg/mL) and Poly I:C (1µg/mL) respectively, for 48h in activation media (RPMI + 5% HI human serum and 5mM Pen/Strep). All culture supernatants were harvested and were stored at −80°C for cytokine determination using multiplex MSD cytokine kits (MesoScale Discovery, Gaithersburg, MD). Cytokines evaluated included TNFα, IL-10, GMCSF, IL-8, IL-1β, IL-6, IL-12, and IL-2.
2.9. Statistical analysis
Data between the groups was analyzed with unpaired two-tailed Students t- test and p<0.05 was considered significant. Paired two-tailed Student’s t-test was used to compare data within a group and p<0.05 was considered significant.
3. Results
3.1 Subject Characteristics and Study Design
This study was designed as the first comprehensive evaluation of longitudinal changes in phenotype, quantity, and effector functions of immune cells in peripheral blood of MS patients within the first 72h of GA therapy. The subjects comprised 12 RRMS patients and 7 healthy donors (HD). Both the GA treated (n=8) and untreated (n=4) MS patients were in the quiescent phase of relapsing remitting disease (not in active relapse) and were treatment naïve (no history of disease modifying therapy). The healthy subjects and the untreated subjects served as important cohorts to control for potential diurnal variation of measured parameters. Thus, only the parameters that changed in the GA-treated cohort but not in the other two cohorts were considered an effect of GA therapy.
The MS groups consisted of 2 males/8 females and 4 females respectively, with an age range and mean age of 22–59 (42y) and 38–56 (46.3y). The HD cohort included 3 males/4 females, 27–54 years (Mean: 37.3y). Peripheral blood was collected just before treatment initiation and this was considered time point 0(h). Patients in the GA cohort initiated their GA therapy as part of an overnight admission in the UT Southwestern CTRC. Clinical oversight with injection training was provided as part of routine care procedures. Blood samples were then collected at 4h, 12h and 24h from the time of GA injection, as part of the admission. The 24h time point was collected before the administration of the second injection. Subjects then returned for the 72h time point before their fourth dose of GA. Throughout the study, untreated and GA-treated MS patients were pooled together for baseline (0h) comparisons with HD. At baseline, percentages and absolute numbers of CD4+, CD8+, CD14+, CD19+, myeloid dendritic cells (MDC) and plasmacytoid dendritic cells (PDC) were not different between HD and MS patients (Fig. 1A, B and C). We then sought to evaluate whether GA induced any phenotypic, quantitative, and/ or functional changes in these cell populations within 72h of therapy initiation.
Figure 1. Similar percentages and absolute numbers of T, B and antigen presenting cells at baseline.
PBMC from healthy donors and treatment-naïve MS patients were analyzed by flow cytometry for determining the frequency (A& B) and absolute numbers (C) of CD4+, CD8+, CD14+, CD19+, BDCA1+ (myeloid dendritic cells) and BDCA4+ (plasmacytoid dendritic cells) cells at the 0h time point.
3.2. GA induces a rapid increase in CD8+ T cell percentages in the blood of MS patients
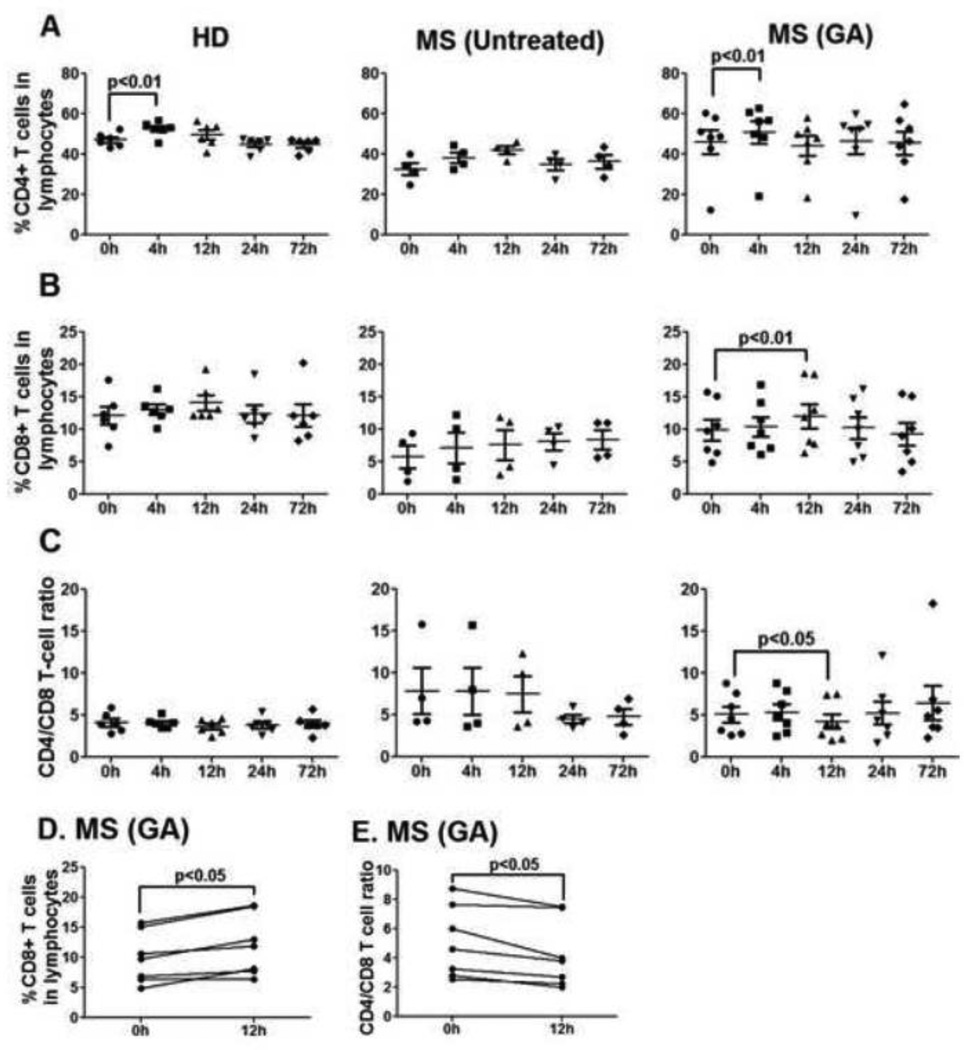
The percentage of CD4+ T lymphocytes in peripheral blood of GA-treated MS patients remained stable during the first 72h of therapy, except for a slight but significant increase at 4h (GA-CD4+ T cells, 0h vs. 4h, p<0.01, Fig. 2A). Of note, a similar increase in the percentage of CD4+ T cells was also seen in the peripheral blood of healthy donors (HD-CD4+ T cells, 0h vs. 4h, p<0.01, Fig 2A), and therefore did not represent a GA-selective effect. Interestingly, GA-treated MS patients showed a significant increase in CD8+ T cell percentages at 12h post-first injection when compared to 0h time point (p<0.01, Fig. 2B and 2D). Concomitantly, the CD4/CD8 T cell ratio was significantly reduced at 12h in the peripheral blood of GA-treated patients (p<0.05, Fig 2C and 2E). No changes in CD8+ T cell percentages were seen in the peripheral blood of HD or untreated MS patients. Within the patient cohort, increased CD8+ T cell percentages and reduced CD4/CD8 T cell ratio at 12h were seen in the blood of 6/7 GA-treated MS patients (Fig. 2D and 2E, respectively). At the 24h and 72h time points, both representing “trough” points for drug (right before daily shots), the cell percentages were somewhat elevated but not significantly different from 0h.
Figure 2. GA treatment reduces CD4/CD8 T cell ratio in the peripheral blood 12h post injection.
CD4+ (Panel A), CD8+ (Panel B) percentages and CD4/CD8 T cell ratio (Panel C) were determined in the peripheral blood of HD, untreated and GA-treated MS patients at indicated time points. Each point represents a single subject. Panels D and E show trends for CD8+ T cell percentages and CD4/ CD8 ratio, respectively, at 0 vs. 12h in the GA-treated group. Significant p values are indicated.
3.3. GA predominantly alters CD8+ T cell homeostasis in the peripheral blood 12h post injection
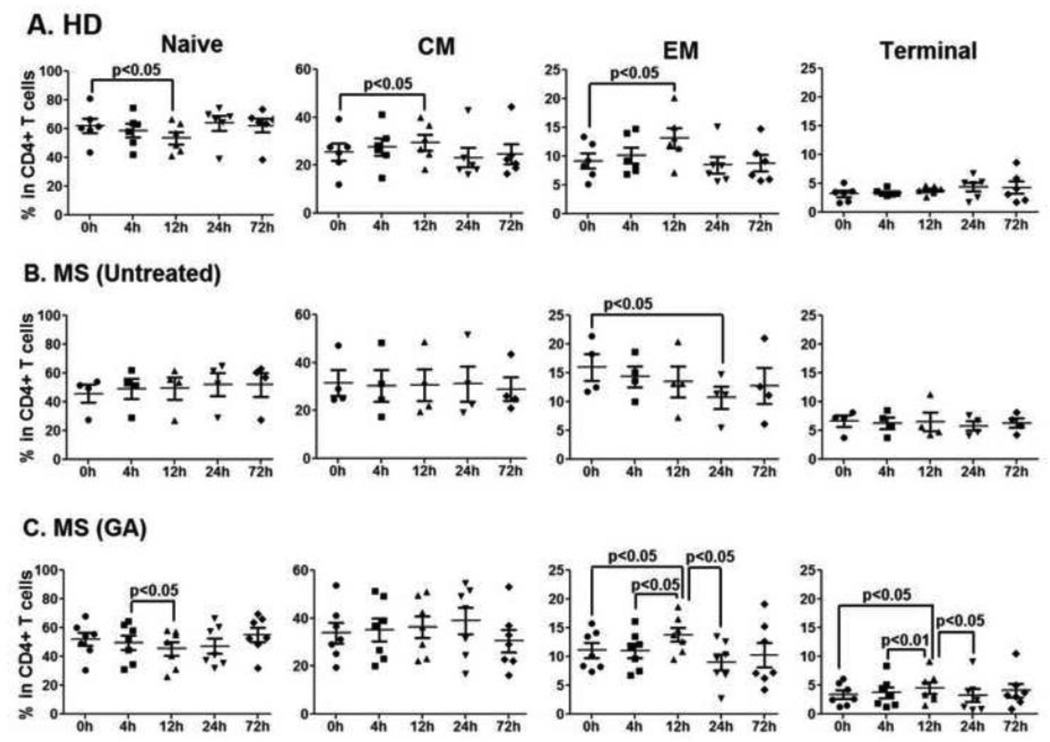
To further characterize the early effects of GA on peripheral T cells, percentages of naïve (CD27+CD45RO−), central memory (CM; CD27+CD45RO+), effector memory (EM; CD27−CD45RO+) and terminal (Ter; CD27−CD45RO−) CD4+ and CD8+ T-cells were examined in the peripheral blood of MS patients treated with GA. Gating strategy for these populations is shown in Suppl. Fig. 1. In CD4+ T cells of MS patients treated with GA, the percentages of EM and Ter CD4+ T cells were significantly increased at 12h (after first GA injection) when compared to the 0h time point (GA-EM CD4+ T cells, p<0.05; GA-Ter CD4+ T cells, p<0.05, Fig. 3C). While HD also showed a significant increase in EM CD4+ T cells at 12h as compared to 0h (HD-EM CD4+ T cells, p<0.05, Fig 3A), the increase in Ter CD4+ T cells at 12h was selective to GA-treated MS patients. The only diurnal fluctuation in CD4+ T cell compartment of untreated MS patient was a significant decrease in EM population at 24h when compared with 0h time point (MS-untreated EM CD4+ T cells, 0h vs. 12h, p<0.05, Fig 3B).
Figure 3. No GA-induced changes in CD4+ T cell compartment during first 72h of therapy.
Fluorescent conjugated anti-human CD27 and CD45RO were used for flow cytometry analysis to further differentiate CD4+ T cells into naïve (CD27+CD45RO−), central memory (CM, CD27+CD45RO+), effector memory (EM, CD27− CD45RO+) and terminal (Ter, CD27−CD45RO−) populations (Suppl. Fig. 1). Panels A, B and C represent percentages of naïve, CM, EM and terminal CD4+ T cells in HD, untreated, and GA-treated MS patients, respectively. Except for the terminal CD4+ T cells, similar diurnal fluctuations in CD4+ T cell subpopulations were present in all the study groups.
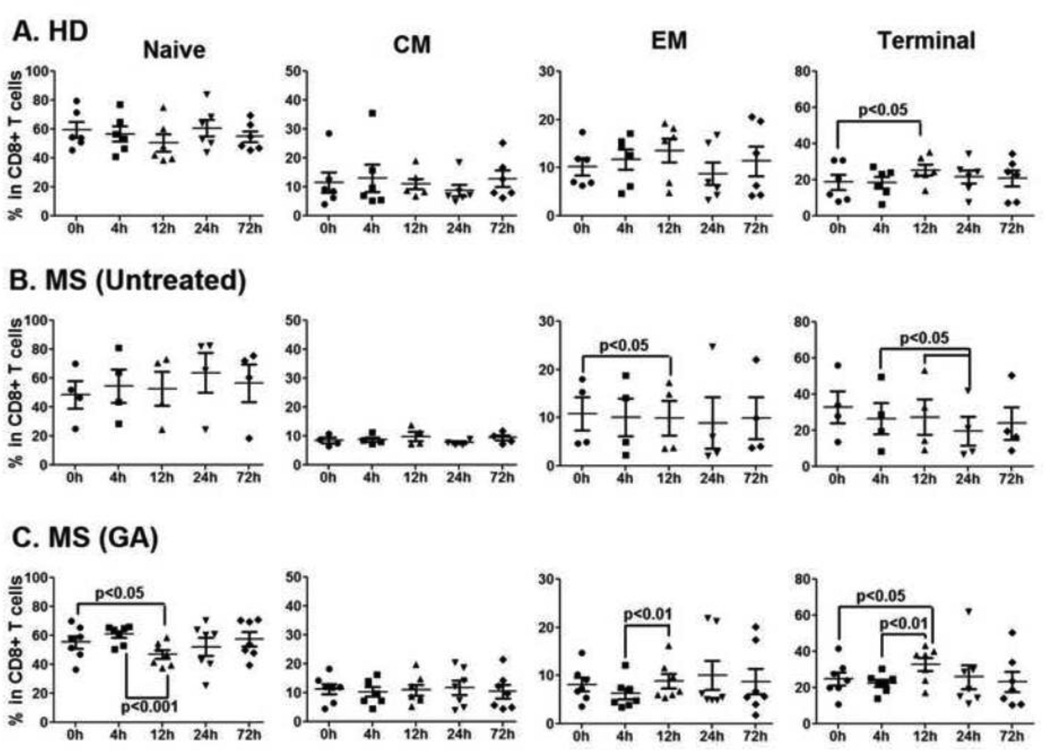
GA-treated MS patients, selectively, showed interesting changes in the peripheral blood CD8+ T cell homeostasis within 12h of therapy initiation. Naive CD8+ T cells were significantly decreased at 12h when compared to 0h in the blood of GA-treated MS patients (GA-Naïve CD8+ T cells, 0h vs. 12h, p<0.05, Fig 4C). Further, at 4h, EM CD8+ T cells showed a decreasing trend (as compared to 0h) in GA treated and untreated MS patients and this was in contrast to increasing trend of EM CD8+ T cells from HD (Fig 4A vs. B & C). While the decreasing trend in the EM CD8+ T cell population in untreated MS patients became significant at 12h (MS-untreated EM CD8+ T cells, 0h vs. 12h, p<0.05, Fig 4B), notably, the initial decrease in EM CD8+ T cells in GA-treated MS patients was followed by a significant rebound at 12h (GA-EM CD8+ T cells, 4h vs. 12h, p<0.01) post first GA injection (Fig. 4C). Fluctuations in the terminal CD8+ T cell compartment were seen in all three groups (Fig. 4 A, B and C).
Figure 4. Frequency of CD8+ T cell subpopulations is rapidly altered in the blood post GA therapy.
Fluorescent conjugated anti-human CD27 and CD45RO were used for flow cytometry analysis to further differentiate CD8+ T cells into naïve (CD27+ CD45RO-), central memory (CM, CD27+ CD45RO+), effector memory (EM, CD27− CD45RO+) and terminal (Ter, CD27− CD45RO-) populations (Suppl. Fig. 1). Panels A, B and C represent percentages of naïve, CM, EM and terminal CD4+ T cells in HD, untreated, and GA-treated MS patients, respectively. GA induced significant decrease in naïve (Panel C) and increase in EM (Panel C) CD8+ T cells in the blood as early as 12h after therapy initiation. No such changes in CD8+ T cell subpopulations were seen in HD (Panel A) or untreated MS patients (Panel B). Significant p values are indicated.
3.4. Ex vivo suppression of allogeneic responder/effector T cells (Teff) by CD4+CD25+ Tregs obtained from GA-treated MS patients remains unaltered during the first 72h of therapy
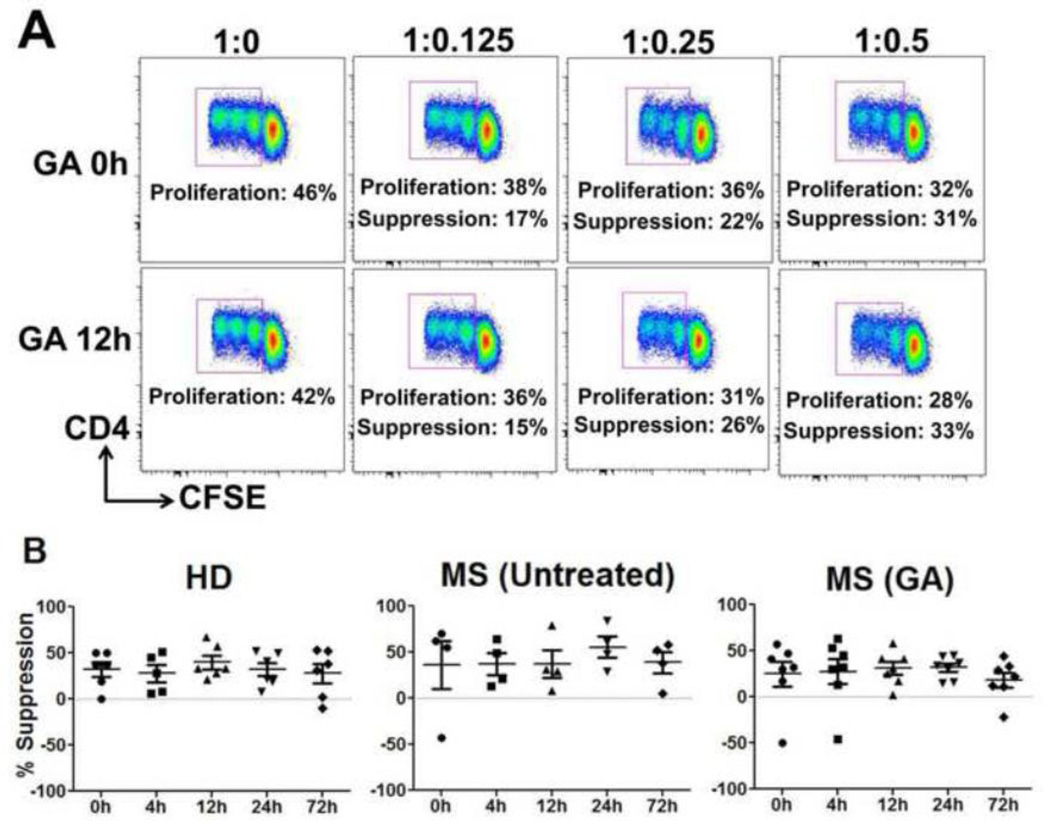
To analyze the effects of GA on suppressive function of CD4+CD25+ regulatory T cells (Tregs) during first the 72h of therapy, Teff (CD4+CD25−) and irradiated APC, obtained from third-party healthy volunteers, were co-cultured with Tregs isolated from peripheral blood of either MS patients treated with GA or control cohorts. Representative dot plots are shown in Fig. 5A. Surprisingly, at 0h the mean suppression index of CD4+CD25+ Tregs cells in MS patients and HD were not significantly different (Suppl. Fig. 2). Moreover, there were no changes in percent suppression of anti-CD3 stimulated allogeneic Teff cells by CD4+CD25+ Tregs obtained either from GA-treated MS patients or controls during the first 72h of therapy (Fig. 5B).
Figure 5. Ex vivo suppression by CD4+CD25+ Tregs remains unaffected during first 72h of GA therapy.
Increasing numbers of CD4+CD25+ Tregs, isolated from the indicated cohorts were used in anti-CD3 stimulated CFSE-based suppression assays using third-party Teff cells and irradiated APC. Representative dot plots from a GA-treated patient is shown in panel A. Proliferation percentages in the dot plots indicate gated percentages of CD4+/CFSE low (proliferating) cells. Percent proliferative responses were normalized to the response without suppressors (defined as 100%), indicated as 1:0 in the dot plots and %suppression was calculated (also indicated). Panel B represents %suppression by CD4+CD25+ Treg cells isolated from HD, untreated and GA-treated MS patients.
3.4. CD8 suppressor ability is significantly improved as early as 12h after the first GA injection
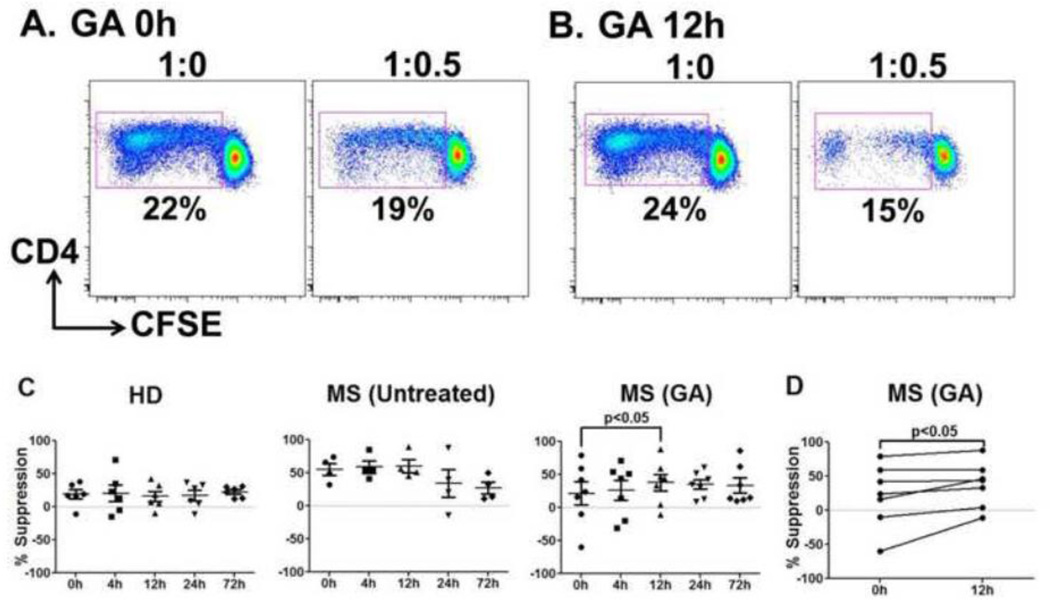
Expansion of GA-specific suppressor CD8+ T cell responses have been shown in MS patients on GA therapy [7, 9], implicating a role of CD8+ T cells in GA-mediated immune modulation of MS. To test whether improvement in global suppressive function of CD8+ T cells is initiated as early immune change during GA therapy, suppression of anti-CD3-stimulated allogeneic Teff cells was carried out with CD8+ T cells sorted from GA-treated MS patients or control subjects. Representative dot plots of suppression of allogeneic Teff cells by CD8 T cells obtained from a GA-treated patient are shown in Fig. 6A. Similar to CD4+CD25+ Tregs, at 0h, CD8+ suppressors from MS patients and HD displayed no significant difference in the mean suppression indices (Suppl. Fig. 2). Importantly, there was a significant enhancement of CD8+ T cell-mediated suppression at 12h after first GA injection (% suppression GA, 0h vs. 12h, p<0.05, Fig. 6B, C and D). Additionally, suppression remained elevated in the GA group at 24 and 72h (as compared to 0h), although the difference did not reach statistical significance at these “trough” time points early in therapy (mean % suppression GA, 0h vs. 24h &. 72h, 21.5 ± 45.9 vs. 34.9 ± 19.0 &. 33.4 ± 29.8). At 12h, 6/7 GA treated patients had improvement in CD8+ suppressive potential as shown in Fig. 6D. The control cohorts showed no differences in CD8 suppressive ability over time (Fig. 6C).
Figure 6. Significant improvement in CD8+ T cell suppressive potential within 12h of GA therapy initiation.
Ex vivo purified CD8+ cells were used in anti-CD3-stimulated CFSE-based suppression assays using third-party Teff cells and irradiated APC. Panels A and B show representative dot plots from a GA-treated patient at 0h and 12h, respectively. Percentages in dot plot indicate gated percentages of CD4+/CFSE low (proliferating) cells. Percent proliferative responses were normalized to the response without suppressors (defined as 100%), indicated as 1:0 in the dot plots. Panel B represents %suppression by CD8+ T cells isolated from HD, untreated, and GA-treated MS patients. GA-treated patients showed significant improvement in CD8+ T cell mediated suppression at 12h (D). No such change was seen in HD and untreated MS patients. Per patient trends in GA treated group at 12h are shown in D.
3.5. Significant improvement in the inhibitory potential of induced suppressors at 12h post GA therapy
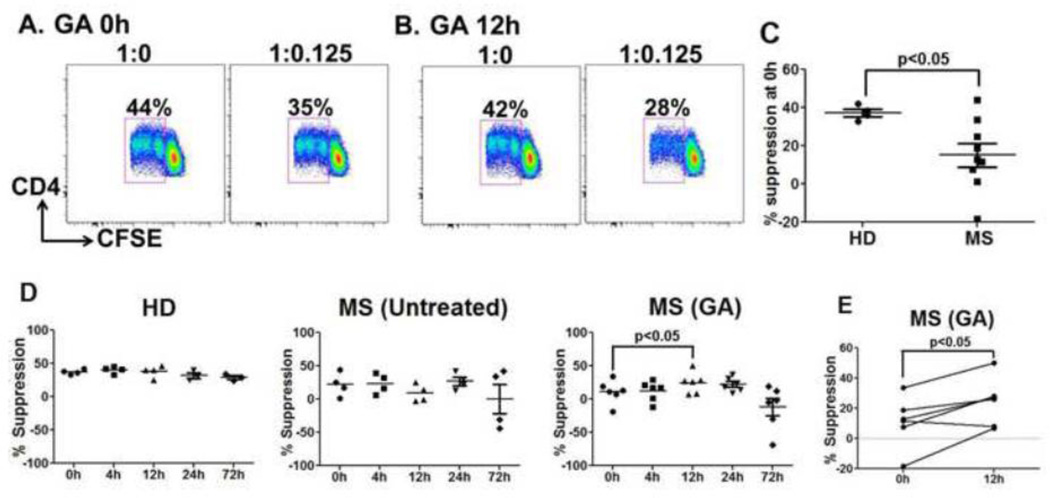
Several studies from us and others have shown that human CD4+CD25− T cells, upon activation, can be converted into CD4+CD25+FOXP3+ cells and acquire suppressive potential [16, 18, 19]. To test whether GA therapy altered the ability of induced Treg generation, we assessed the ability of anti-CD3-stimulated CD4+CD25− T cells from GA-treated MS patients and controls to suppress allogeneic Teff cells. CD4+CD25− T cells sorted from the peripheral blood were cultured with irradiated (third party) APC in the presence of plate bound anti-CD3. Cells were subsequently washed and used as suppressors in a secondary in vitro suppression assay. Representative dot plots of induced suppressors from a GA-treated patient co-cultured with allogeneic Teff cells are shown in Fig. 7A and 7B. Interestingly, at the untreated state (0h), induced suppressors generated from MS patient’s CD4+CD25− cells had significantly reduced suppressive potential towards allogeneic Teff cells, compared to healthy donors (Fig. 7C). Importantly, the suppressive ability of CD4+CD25+ Tregs generated from CD4+CD25− T cells from GA-treated MS patients was significantly improved at 12h (% suppression GA, 0h vs. 12h, p<0.05, Fig. 7D). Within the cohort, 5/6 patients showed improvement in induce Tregs suppression ability (Fig. 7E). Induced suppressors generated from the control cohort CD4+CD25− Teff cells displayed no significant differences over time in suppressing third party Teff cells (Fig. 7D).
Figure 7. Inhibitory potential of induced suppressors is significantly improved at 12h after GA treatment.
Induced suppressors were generated by activating CD4+CD25− T cells in the presence of anti-CD3 and allogeneic APC for 6 days. These cells were harvested and assessed for suppressive ability in CFSE-based suppression assays using third-party Teff cells and irradiated-APC. Representative dot plots (A and B) shows %proliferating Teff cells when cultured with induced suppressors obtained from a GA-treated patient at 0 and 12h time points. Percent proliferative responses were normalized to the response without suppressors (defined as 100%), indicated as 1:0 in the dot plots. At baseline, induced suppressors generated from MS patients displayed significantly reduced inhibitory potential when compared to HD (C). Data points in D represent % suppression by induced suppressors generated from HD, untreated and GA treated (n=6) MS patients. Induced suppressors generated from CD4+CD25− T cells obtained at 12h after GA therapy showed significant improvement in inhibitory potential (D). No such changes were seen in HD and untreated MS patients. Per-patient trends in GA-treated group are shown in Panel E.
3.6. Similar activation profiles of CD4+CD25− T cells from GA-treated MS patients and HD when cultured with third party allogeneic APC
The effect of GA on the activation potential of CD4+CD25− Teff cells in response to allogeneic APC was tested in an MLR. CD25 upregulation response of CD4+ T cells, after co-culture with allogeneic APC, from a representative GA-treated MS patient is shown as a dot plot in Suppl. Fig. 3A. At baseline, CD4+ T cells from MS patients and HD showed similar activation by allogeneic APC (Suppl. Fig. 3B). Further, following GA therapy, there were no significant changes in the MLR responses of CD4+ T cells from any of the cohorts (Fig. 8).
Figure 8. No effect of GA on activation of CD4+CD25− T cells in response to allogeneic APC.
Third party APC were co-cultured with CD4+CD25− Teff cells isolated from project participants at indicated time points, following which CD25 upregulation was studied by flow cytometry. %CD25 upregulation on CD4+CD25− T cells from HD (n=3), untreated (n=4) and GA-treated (n=5) MS patients at 0h, 12h & 72h time point are shown. %CD25 upregulation in all the three groups was not different at any time point.
3.7. Reduced stimulatory potential of MS patient monocytes within 12h of GA treatment
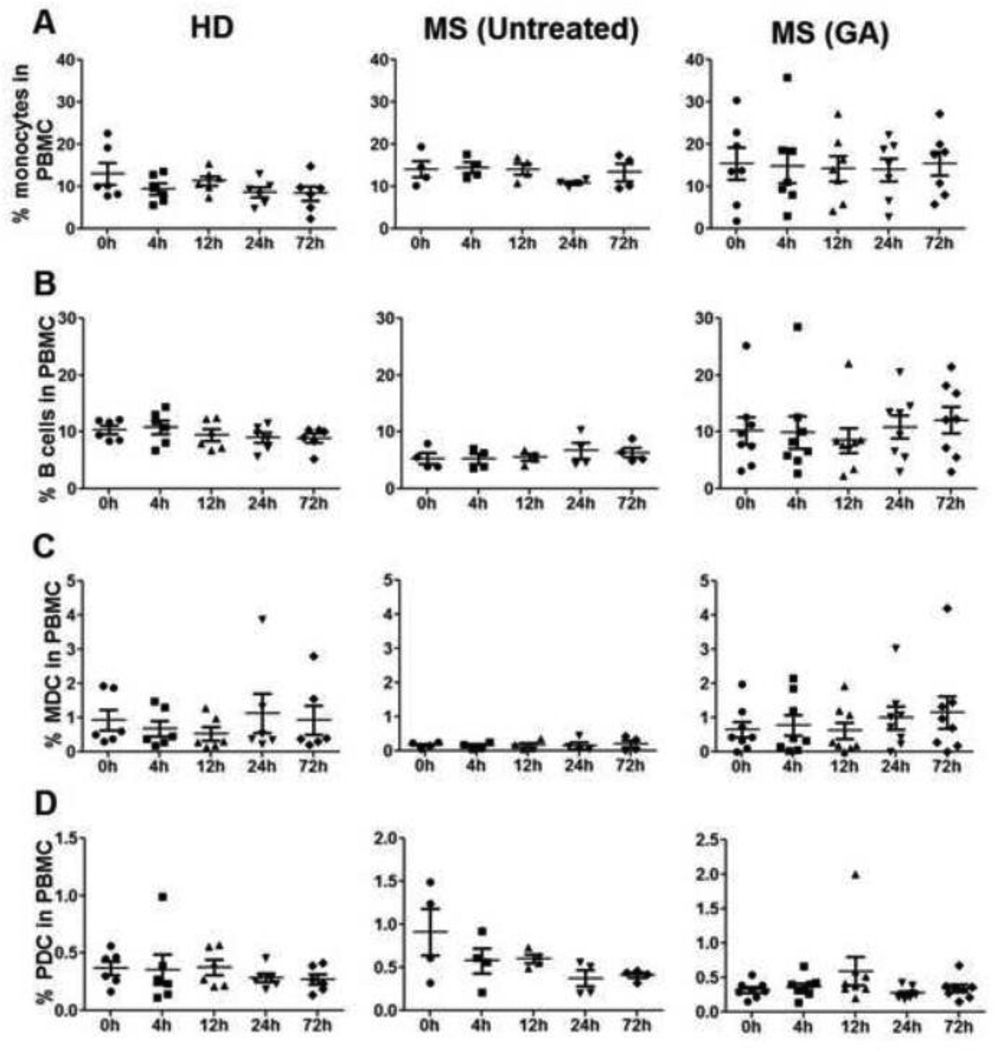
Several reports have implicated immune modulatory effects of GA on APC populations such as reduced production of proinflammatory cytokines IL-12, TNF-α and elevated anti-inflammatory IL-10 from monocytes isolated from GA-treated MS patients [20, 21]. GA therapy-induced increase in IL-10 from B cells has also been reported. We sought to evaluate GA-induced phenotypic and functional changes in APC during the first 72h of therapy. Immunophenotyping revealed no significant differences in total monocytes, B cell, MDC, and PDC percentages or absolute numbers in MS patients at baseline, when compared to HD (Fig 1B & C). Moreover, unlike the dynamic changes in certain T cell subsets, the percentages of APC subsets in the peripheral blood remained relatively stable in all three groups when compared to baseline levels (Fig. 9), with no statistically significant increase or decrease at any time point.
Figure 9. Percentages of monocytes, B cells, myeloid (MDC) and plasmacytoid dendritic cells (PDC) remain stable during first 72h of GA therapy.
Flow cytometry analysis using CD14, CD19, BDCA1 (MDC), and BDCA4 (PDC) anti-human antibodies was done in the peripheral blood of all the study participants throughout the observation time points. Data point in panels A, B, C & D represents % monocytes, B cells, MDCs and PDCs, respectively, in HD (n=6), untreated (n=4) and GA treated (n=8) MS patients.
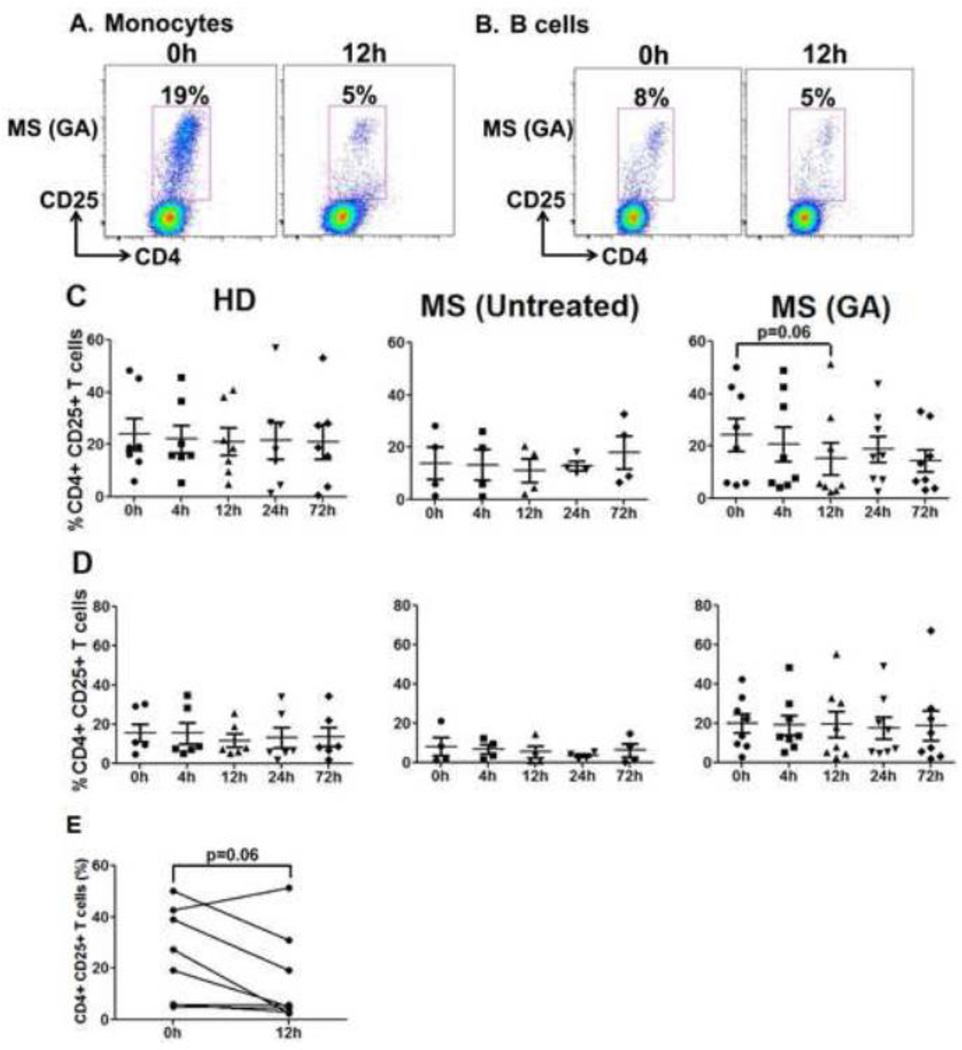
In addition to numbers, we also tested the capacity of monocyte and B cells to stimulate MLR responses to evaluate whether GA induces functional changes in the APC activating potential within 72h of treatment. Representative dot plots of CD25 upregulation by third party CD4+CD25− Teff cells when cultured with GA patient’s monocytes and B cells are shown in Fig. 10A and B, respectively. Monocytes from HD vs. untreated MS patients at baseline (0h) displayed no significant differences in their stimulatory capacity (Suppl. Fig. 3C). Importantly, while control groups did not show any variation in the monocytes’ stimulatory capacity over time, there was an appreciable trend of reduced activation potential of monocytes in GA-treated MS patients at 12h (GA monocyte MLR, 0h vs. 12h, p=0.06, Fig. 10C). Within the cohort, the activation potential of monocytes showed a downward trend in 7/8 patients at 12h post-first GA injection (Fig. 10E). Similar to monocytes, B cells from MS patients and HD at 0h showed no significant difference in overall stimulatory capacity (Suppl. Fig.3C). Furthermore, there were no significant changes in B cell stimulatory potential over time when compared to baseline levels after GA therapy (Fig. 10D).
Figure 10. Striking reduction in monocyte stimulatory potential at 12h after GA treatment.
Monocytes and B cells were isolated from HD, untreated and GA treated MS patients and were co-cultured with CD4+CD25− Teff cells from third party donors for 6 days. The cells were harvested, washed, stained with anti-CD4 & CD25 and analyzed by flow cytometry. CD25 upregulation on CD4+ T cells was assessed to measure activation potential of study participants’ monocytes and B cells. Panels A and B show representative dot plots of Teff cells cultured with GA-treated patient’s monocytes and B cells, respectively, obtained at 0h and 12h. Data points in Panels C and D represent %CD25 on gated CD4+ T cells. Monocytes at 12h post-GA treatment displayed reduced stimulatory potential with a trend towards significance (Panel C). As shown in Panel E, monocyte stimulatory potential in MLR displayed a reduced trend in 7/8 GA-treated MS patients at 12h after treatment initiation. B cells did not show any fluctuations in stimulatory potential in all the three groups during the 72h observation period (Panel D).
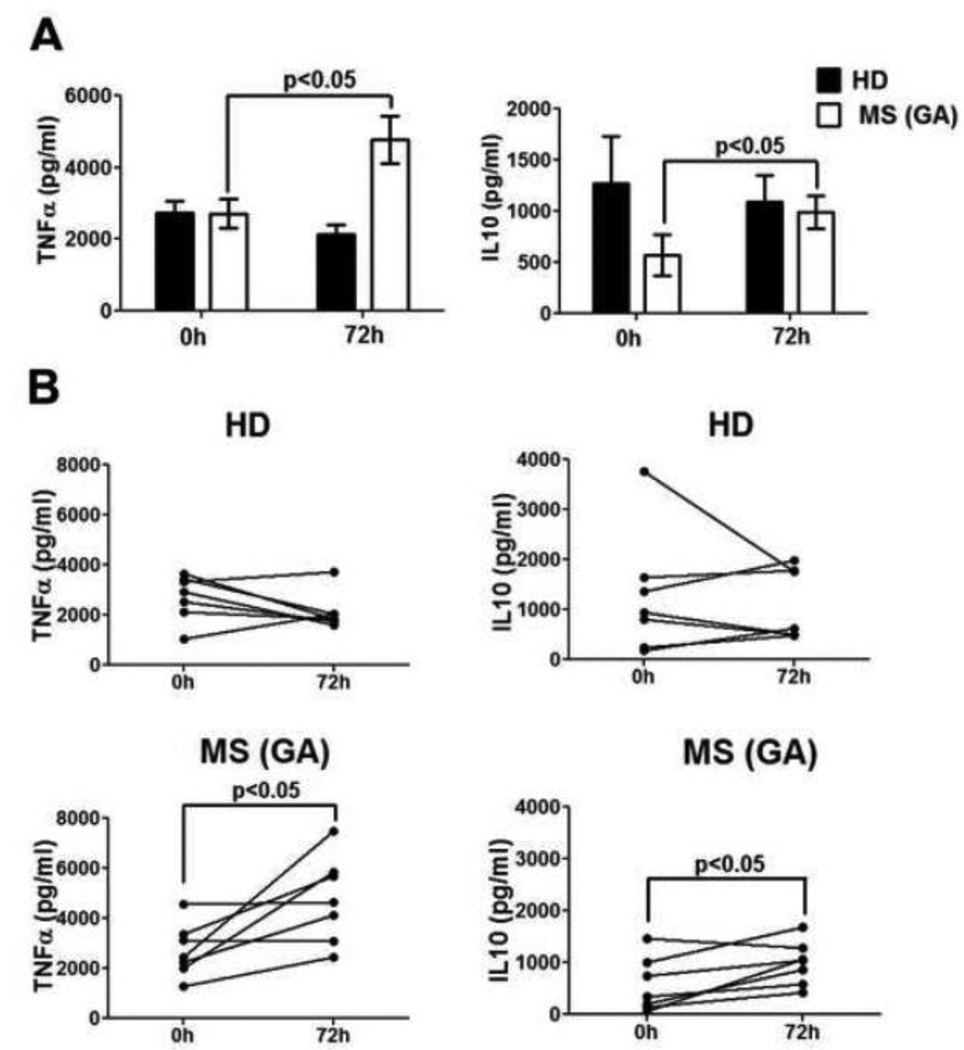
3.8. Significant increase in IL-10 and TNF-α from monocytes early during GA therapy
Cytokine levels were determined in culture supernatants of monocytes, B cells and MDC obtained from GA-treated MS patients and HD, to further assess the functional changes induced by GA within 72h. Monocytes, B cells and MDC did not show any significant differences in cytokine production between HD and MS patients at baseline (Fig 11A, Suppl. Fig. 4). Interestingly, as compared to 0h, monocytes obtained at 72h post-GA therapy initiation had significantly increased levels of cytokines IL-10 and TNF-α in the culture supernatants (GA IL-10 & TNF-α, 0h vs. 72h, p<0.05, Fig. 11A); further emphasizing the early effect of GA on monocyte function. Individual trends presented in Fig. 11B shows that IL-10 and TNF-α were increased at 72h in 7/7 MS patients. Cytokine concentrations of GM-CSF, IL-8, IL-1β, IL-6, IL-12, and IL-2 remained stable in monocyte culture supernatants of control groups over the 72h observation period (Suppl. Fig. 4A). Finally, there were no detectable differences in the cytokine production by B cells or MDC obtained at 72h (vs. 0h) post-GA therapy initiations (Suppl. Figs. 4B & C, respectively).
Figure 11. Significantly increased IL-10 and TNFα production by moncoytes from GAtreated patients.
CD14+ monocytes from HD (n=7), and GA-treated MS patients (n=7) were stimulated with LPS for 48h and cytokines in culture supernatants were detected by multiplex MSD kits. Panel A shows that both IL-10 and TNF-α were significantly increased in monocyte-culture supernatants of GA-treated patients at 72h when compared to 0h time point. Panel B shows per patient trends of IL-10 and TNF-α at 0h and 12h in HD and GA treated-MS patients.
4. Discussion
Mechanisms thought to be mediating the therapeutic effects of GA in MS include induction of GA-reactive Th2 cells, improvement in CD4+CD25+ Treg suppression, modulation of monocytic or B cell function and restoration of CD8+ T cell regulatory function, implicating immune effects of GA on APC and T cells. The majority of studies exploring GA effects in MS have been done on patients receiving drug for at least 3 months or longer, thereby, missing out on early GA induced changes in immune cells that might play a crucial role in shaping long-term immune modulation. Therefore, the present study was specifically designed to characterize the immediate effects of GA therapy on phenotype, quantity, and function of peripheral blood cells in patients with MS. Treatment-naïve MS patients with quiescent disease, who were initiating GA therapy, were enrolled in the study. The first blood sample was obtained prior to GA injection (0h) and subsequently at 4h, 12h, 24h and finally 72h after the first GA injection. Healthy subjects and other treatment-naïve MS patients awaiting their standard-of-care therapy served as controls as they remained untreated in the 72h time frame for this study. Therefore, this study dissected a very unique clinical time frame post-GA therapy (hours post-first injection).
PBMC from all the subjects were used for the isolation of CD8+, CD4+CD25+, CD4+CD25−, CD19+, CD14+ and MDC subsets. Functional assays done on T cells included: 1) allogeneic suppression assays with CD4+CD25+ and CD8+ regulatory cells isolated from project participants, 2) MLR with third party APC and 3) culturing CD4+CD25− T cell population with anti-CD3 for generating induced suppressors, which were subsequently used to inhibit third party CD4+CD25− Teff cells. For the APC evaluations, CD19+, CD14+, and MDC were stimulated for detection of cytokines. Due to cell number constraints, only CD19+ and CD14+ cells were assessed for their APC ability through MLR assays with third party Teff cells. Standardized immunophenotyping of T cells and APC was done on unsorted PBMC at all time points.
Interestingly, phenotypic and functional changes in T cells and APC were observed as early as 4–12h after first GA injection, implying that GA induces rapid changes in immune cell effector functions. The major GA-induced changes within 12h post-first injection included: 1) perturbation in the homeostasis of predominantly CD8+ T cells, associated with decreased CD4/CD8 ratios, 2) significant enhancement in CD8+ T cell-mediated suppression, 3) significant increase in ability of CD4+ T cells to induce CD4+CD25+ Tregs and 4) reduced stimulatory capacity of monocytes. Along with these changes, IL-10 and TNF-α production by LPS-stimulated monocytes was significantly increased at 72h post-therapy.
In contrast, within the same 72h time frame, there were no observable effect of GA on: 1) immune phenotype of CD4+ T cell compartment, 2) suppressive potential of CD4+CD25+ Tregs, 3) MLR activation of CD4+CD25− Teff cells, 4) percentages of CD14+, CD19+, MDC, and PDC in peripheral blood, 5) stimulatory capacity of CD19+ cells in MLR and 6) cytokine production by B cells and MDC.
Our phenotyping data revealed striking changes in the CD8+ T cell compartment within 12h after first GA injection. Prior evidence of GA action on CD8+ T cells comes from our own studies where we have shown that while CD4+ T cell response to GA declined over time, CD8+ T cells progressively expand in MS patients on GA therapy [7]. In the present study, while CD4+ T cell percentages remained stable during the first 72h of GA therapy, CD8+ T lymphocytes were predominantly increased in the peripheral blood of MS patients at 12h after first GA injection. Reversal of CD4/CD8 T cell ratio 12h after GA administration suggests rapid mobilization and/ or GA specific expansion of CD8+ T cells in the blood as early as 12h after treatment. A significant decrease in CD4/CD8 T cell ratio in the blood was also observed in a Polish study 2 years after GA treatment [22]. Although an early change in CD8+ T cells was an unexpected observation, this finding suggests that CD8+ T cells might be among the first responding immune population in vivo after GA administration. This corroborates with our recent unpublished observations in mouse models that the presence of CD8+ T cells is absolutely required for the beneficial effects of GA therapy.
Recent studies from us have shown clinically relevant immune modulation by CD8+ T cells, where we found that suppressive activity of autoreactive CNS-specific CD8+ T cells diminished during relapses of MS and recovered in the patients as they enter remission [15]. Of great mechanistic relevance, the present study reveals that just 12h after first GA injection there was significant improvement in CD8+ regulatory T cell function in 6/7 MS patients. Although the mechanism for such rapid improvement in regulatory function of CD8+ T cells remains unclear, it is interesting that the 12h time point was also associated with an increase in EM CD8+ T cells in the blood of GA-treated patients, implying that CD8+ suppressive phenotype might reside in the EM compartment. We have previously reported improvement in CD8+ T cell’s inhibitory potential in MS patients who have been on GA therapy for 7 months [9]. A similar response to GA therapy happens as early as 12h post injection, as seen in the present study. This is a novel and relevant observation as measuring CD8+ T cell suppressor ability over time in MS patients on GA therapy could potentially be used to determine clinical responsiveness. Interestingly, while the changes in CD8 numbers and suppressive abilities were somewhat maintained at 24 and 72h, they were not statistically different from baseline. In fact, several immunologic effects seemed to be peak at the 12h time point. We believe that this observation is a reflection of timing of the GA dose. Thus, whereas the 4 and 12h time points reflect GA build up, the 24 and 72h time points represent the “trough” for GA levels, as they reflect blood draws right before the daily injections. It is tempting to speculate that in the initial days of GA administration, the mechanisms needed for these changes have to operate on a daily basis (with enhancement at 12h mid-points) for eventual long-term stabilization of these suppressive populations in MS patients. This can be tested in future studies by planning more blood draws at time points between GA doses.
We observed no differences in the suppressive function of CD4+CD25+ and CD8+ regulatory T cells, at baseline, between RRMS patients and HD suggesting that regulatory cells from RRMS patients were not intrinsically deficient. This is in contrast to observations from us and others demonstrating deficient suppressive function of CD4+CD25+ and CD8+ regulatory cells in MS patients [15, 23–25]. This discrepancy may be explained by the choice of autologous vs. allogeneic Teff cells used for suppression cultures. In the current study suppression ability was tested against a common allogeneic effector population. Taken together, these findings suggest that the lower autologous suppressive ability of CD4+ and CD8+ regulatory T cells from MS patients may actually reflect a higher resistance of MS patients’ effector CD4+ T cells to suppression. In fact, resistance of Teff cells to Treg suppression has been reported in type 1 diabetes as well as SLE patients [26, 27]. Similar findings were also present in EAE [28] and murine bone marrow transplant model [29]. To this end, in the current study Teff cells from MS patients did not display any differences in their activation status, as compared to HD, when co-cultured with third party APC. However, other cell intrinsic differences are likely responsible for their relative resistance to suppression. Our study emphasizes the need for re-evaluating regulatory cells from MS patients with the perspective of resistance of Teff cells to suppression as a possible reason for lack of suppression in autologous assay systems.
One of the most interesting observations in the T cell compartment at 12h after GA injection was the significantly reduced ability of MS patient’s derived CD4+CD25− T cells to convert into induced suppressors when stimulated with anti-CD3. Several studies have shown that the CD4+CD25− T cell population upon polyclonal stimulation acquires suppressive phenotype [16, 18, 19]. For the first time, we report a significantly reduced inhibitory potential of MS patient’s induced CD4 suppressors (Fig. 7C), which further underscores an inherent defect in MS patient’s CD4+CD25− Teff cells. It is interesting to note that induced suppressors from HD displayed a strong inhibitory potential in in vitro suppression assays. This feature of CD4+CD25− Teff cells could serve as an additional layer of immune regulation during inflammatory conditions, which seems to be deficient in MS patients. Significant improvement in suppressive potential of induced suppressors in 5/6 GA-treated MS patient’s paired samples at 12h represents an as yet unidentified effect of GA on CD4+ Teff cells. Importantly, while GA had no effect on suppressive potential of CD4+CD25+ Treg cells in the initial 72h after initiation of therapy, it potentiates induced suppressors, which then display improved inhibitory potential towards third-party responders. Although this finding needs to be corroborated in long term studies, we propose that GA modulates the effector CD4+ T cell population to maintain homeostasis during aberrant immune activation. This corroborates with the finding that suppressive function of ex vivo-derived CD4+CD25+ Tregs remained stable during early therapy. Thus, the eventual increase in CD4+CD25+ Treg function described in other studies [24], may in fact represent the stabilized ability of CD4+CD25− T cells to induce potent Tregs in vivo during long-term therapy.
We also evaluated immediate effects of GA therapy on cells of the innate immune system. Although GA effects on APC in MS patients are less understood, there is accumulating evidence to suggest immune modulatory action of GA on monocytes and dendritic cells [20, 21, 30–32]. In this study, major APC subtypes, including CD14+ (monocytes), CD19+ (B cells), MDC, and PDC were not different between the study groups. Further, there was no change in these subset numbers after GA treatment initiation, further emphasizing that with the exception of CD8+ T cell compartment, all other major cellular subtypes remain relatively stable during early days of post-GA therapy initiation. The assays used to evaluate GA-induced functional modification of APC included: 1) co-culture of CD14+ and CD19+ cells with third party Teff cells in MLR, and 2) cytokine assessment in antigen-stimulated culture supernatants of monocytes, B cells and MDC. Our study showed that within the first 72h of therapy, GA-induced changes were only detected in the monocyte subset of APC. At 0h, B cells and monocytes from HD and MS patients activated allogeneic Teff cells to the same extent, implying that monocytes and B cells from MS patients & HD had similar in vitro stimulatory properties. Of special interest, at 12h CD14+ monocytes from GA-treated group showed a trend toward decreased stimulatory capacity, indicating that GA rapidly altered certain metabolic and membrane functional properties of CD14+ peripheral blood monocytes. Some studies have shown that monocytes from GA-treated patients produce less pro-inflammatory cytokines IL-12 and TNFα [21], and have elevated levels of anti-inflammatory cytokine IL-10 [20] in culture supernatants. It is interesting that we were able to observe a similar increase in IL-10 production from the monocytes that were exposed to GA in vivo for just 72h. Increase in TNF-α from GA-treated monocytes at the same time point was unexpected and might imply early activation of monocytes by GA, which need further modulation into a complete anti-inflammatory phenotype. Alternatively, this may reflect the potential of these cells to provide a neuro-regenerative cytokine upon trafficking to the site of pathology, as TNF-α has been shown to have neuroprotective properties under certain conditions in several models of neurologic diseases [33].
To summarize, our study contributes a novel understanding of very early changes following immune therapy of MS. Importantly, most striking early changes were observed in the CD8+ T cell compartment, with monocytes also showing interesting functional modulation within few days of GA therapy initiation. Taken together our results strongly suggest that GA is very active, in vivo, within 12h of administration and induces changes in not only innate immune cell types but also complex changes in T cell functionality, cumulatively suggestive of a GA-induced anti-inflammatory immune modulation. Retrospectively, the results also indicate that obtaining samples at 12h intervals would be more informative and that, at least early on, everyday injections of GA may be needed to develop a sustained effect on the immune system. It is tempting to speculate that critical interactions between modulated monocytes and significantly modulated CD8+ T cells are required for long-term stabilization of immune changes and, consequently, clinical benefit. This hypothesis can now be tested in a focused manner through longitudinal studies.
Supplementary Material
Highlights.
Key Messages: In MS patients:
-
➢
GA is active, in vivo, within 12h of administration
-
➢
GA induced early modulation of not only innate immune cell types but also T cell functionality
-
➢
GA restores inhibitory potential of induced suppressors very early during therapy initiation
-
➢
This study is a critical step toward developing better immunotherapeutic strategies
Acknowledgements
The authors thank all the MS patients and healthy volunteers who consented to participate in the study. We also thank Wallace Baldwin and Thomas Lee for technical assistance as well as all the personnel in the UT Southwestern MS Clinic, particularly Thomas Abraham, Stephanie Taylor, Parul Chaudhary, Yolanda Rodriguez, Samuel Hughes and Gina Remington for their help with patient recruitment and support. We also thank the UT Southwestern CTRC for infrastructural support during admissions.
Footnotes
Publisher's Disclaimer: This is a PDF file of an unedited manuscript that has been accepted for publication. As a service to our customers we are providing this early version of the manuscript. The manuscript will undergo copyediting, typesetting, and review of the resulting proof before it is published in its final citable form. Please note that during the production process errors may be discovered which could affect the content, and all legal disclaimers that apply to the journal pertain.
Disclosures
JPM now works for Teva Pharmaceuticals, manufacturer of GA. CLA works for Opexa Pharmaceuticals. The studies presented here were conducted prior to these affiliations.
References
- 1.Miller A, Shapiro S, Gershtein R, Kinarty A, Rawashdeh H, Honigman S, Lahat N. Treatment of multiple sclerosis with copolymer-1 (Copaxone): implicating mechanisms of Th1 to Th2/Th3 immune-deviation. Journal of neuroimmunology. 1998;92:113–121. doi: 10.1016/s0165-5728(98)00191-x. [DOI] [PubMed] [Google Scholar]
- 2.Brenner T, Arnon R, Sela M, Abramsky O, Meiner Z, Riven-Kreitman R, Tarcik N, Teitelbaum D. Humoral and cellular immune responses to Copolymer 1 in multiple sclerosis patients treated with Copaxone. Journal of neuroimmunology. 2001;115:152–160. doi: 10.1016/s0165-5728(01)00250-8. [DOI] [PubMed] [Google Scholar]
- 3.Duda PW, Schmied MC, Cook SL, Krieger JI, Hafler DA. Glatiramer acetate (Copaxone) induces degenerate, Th2-polarized immune responses in patients with multiple sclerosis. The Journal of clinical investigation. 2000;105:967–976. doi: 10.1172/JCI8970. [DOI] [PMC free article] [PubMed] [Google Scholar]
- 4.Neuhaus O, Farina C, Yassouridis A, Wiendl H, Then Bergh F, Dose T, Wekerle H, Hohlfeld R. Multiple sclerosis: comparison of copolymer-1-reactive T cell lines from treated and untreated subjects reveals cytokine shift from T helper 1 to T helper 2 cells. Proceedings of the National Academy of Sciences of the United States of America. 2000;97:7452–7457. doi: 10.1073/pnas.97.13.7452. [DOI] [PMC free article] [PubMed] [Google Scholar]
- 5.Qin Y, Zhang DQ, Prat A, Pouly S, Antel J. Characterization of T cell lines derived from glatiramer-acetate-treated multiple sclerosis patients. Journal of neuroimmunology. 2000;108:201–206. doi: 10.1016/s0165-5728(00)00263-0. [DOI] [PubMed] [Google Scholar]
- 6.Hong J, Li N, Zhang X, Zheng B, Zhang JZ. Induction of CD4+CD25+ regulatory T cells by copolymer-I through activation of transcription factor Foxp3. Proceedings of the National Academy of Sciences of the United States of America. 2005;102:6449–6454. doi: 10.1073/pnas.0502187102. [DOI] [PMC free article] [PubMed] [Google Scholar]
- 7.Karandikar NJ, Crawford MP, Yan X, Ratts RB, Brenchley JM, Ambrozak DR, Lovett-Racke AE, Frohman EM, Stastny P, Douek DC, Koup RA, Racke MK. Glatiramer acetate (Copaxone) therapy induces CD8(+) T cell responses in patients with multiple sclerosis. The Journal of clinical investigation. 2002;109:641–649. doi: 10.1172/JCI14380. [DOI] [PMC free article] [PubMed] [Google Scholar]
- 8.Biegler BW, Yan SX, Ortega SB, Tennakoon DK, Racke MK, Karandikar NJ. Glatiramer acetate (GA) therapy induces a focused, oligoclonal CD8+ T-cell repertoire in multiple sclerosis. Journal of neuroimmunology. 2006;180:159–171. doi: 10.1016/j.jneuroim.2006.07.015. [DOI] [PubMed] [Google Scholar]
- 9.Tennakoon DK, Mehta RS, Ortega SB, Bhoj V, Racke MK, Karandikar NJ. Therapeutic induction of regulatory, cytotoxic CD8+ T cells in multiple sclerosis. J Immunol. 2006;176:7119–7129. doi: 10.4049/jimmunol.176.11.7119. [DOI] [PubMed] [Google Scholar]
- 10.Ratts RB, Lovett-Racke AE, Choy J, Northrop SC, Hussain RZ, Karandikar NJ, Racke MK. CD28-CD57+ T cells predominate in CD8 responses to glatiramer acetate. Journal of neuroimmunology. 2006;178:117–129. doi: 10.1016/j.jneuroim.2006.06.001. [DOI] [PubMed] [Google Scholar]
- 11.Weber MS, Prod'homme T, Youssef S, Dunn SE, Rundle CD, Lee L, Patarroyo JC, Stuve O, Sobel RA, Steinman L, Zamvil SS. Type II monocytes modulate T cell-mediated central nervous system autoimmune disease. Nature medicine. 2007;13:935–943. doi: 10.1038/nm1620. [DOI] [PubMed] [Google Scholar]
- 12.Begum-Haque S, Sharma A, Christy M, Lentini T, Ochoa-Reparaz J, Fayed IF, Mielcarz D, Haque A, Kasper LH. Increased expression of B cell-associated regulatory cytokines by glatiramer acetate in mice with experimental autoimmune encephalomyelitis. Journal of neuroimmunology. 2010;219:47–53. doi: 10.1016/j.jneuroim.2009.11.016. [DOI] [PubMed] [Google Scholar]
- 13.Kala M, Rhodes SN, Piao WH, Shi FD, Campagnolo DI, Vollmer TL. B cells from glatiramer acetate-treated mice suppress experimental autoimmune encephalomyelitis. Experimental neurology. 2010;221:136–145. doi: 10.1016/j.expneurol.2009.10.015. [DOI] [PubMed] [Google Scholar]
- 14.Crawford MP, Yan SX, Ortega SB, Mehta RS, Hewitt RE, Price DA, Stastny P, Douek DC, Koup RA, Racke MK, Karandikar NJ. High prevalence of autoreactive, neuroantigen-specific CD8+ T cells in multiple sclerosis revealed by novel flow cytometric assay. Blood. 2004;103:4222–4231. doi: 10.1182/blood-2003-11-4025. [DOI] [PubMed] [Google Scholar]
- 15.Baughman EJ, Mendoza JP, Ortega SB, Ayers CL, Greenberg BM, Frohman EM, Karandikar NJ. Neuroantigen-specific CD8+ regulatory T-cell function is deficient during acute exacerbation of multiple sclerosis. Journal of autoimmunity. 2011;36:115–124. doi: 10.1016/j.jaut.2010.12.003. [DOI] [PMC free article] [PubMed] [Google Scholar]
- 16.Pillai V, Ortega SB, Wang CK, Karandikar NJ. Transient regulatory T-cells: a state attained by all activated human T-cells. Clin Immunol. 2007;123:18–29. doi: 10.1016/j.clim.2006.10.014. [DOI] [PMC free article] [PubMed] [Google Scholar]
- 17.Ayers CL, Firan M, Pillai V, Lee WM, Karandikar NJ. Viral interactions with B-cells contribute to increased regulatory T-cells during chronic HCV infection. Viral immunology. 2011;24:119–129. doi: 10.1089/vim.2010.0077. [DOI] [PMC free article] [PubMed] [Google Scholar]
- 18.Walker MR, Carson BD, Nepom GT, Ziegler SF, Buckner JH. De novo generation of antigen-specific CD4+CD25+ regulatory T cells from human CD4+CD25- cells. Proceedings of the National Academy of Sciences of the United States of America. 2005;102:4103–4108. doi: 10.1073/pnas.0407691102. [DOI] [PMC free article] [PubMed] [Google Scholar]
- 19.Walker MR, Kasprowicz DJ, Gersuk VH, Benard A, Van Landeghen M, Buckner JH, Ziegler SF. Induction of FoxP3 and acquisition of T regulatory activity by stimulated human CD4+CD25-T cells. The Journal of clinical investigation. 2003;112:1437–1443. doi: 10.1172/JCI19441. [DOI] [PMC free article] [PubMed] [Google Scholar]
- 20.Kim HJ, Ifergan I, Antel JP, Seguin R, Duddy M, Lapierre Y, Jalili F, Bar-Or A. Type 2 monocyte and microglia differentiation mediated by glatiramer acetate therapy in patients with multiple sclerosis. J Immunol. 2004;172:7144–7153. doi: 10.4049/jimmunol.172.11.7144. [DOI] [PubMed] [Google Scholar]
- 21.Weber MS, Starck M, Wagenpfeil S, Meinl E, Hohlfeld R, Farina C. Multiple scleros is: glatiramer acetate inhibits monocyte reactivity in vitro and in vivo. Brain : a journal of neurology. 2004;127:1370–1378. doi: 10.1093/brain/awh163. [DOI] [PubMed] [Google Scholar]
- 22.Michalowska-Wender G, Losy J, Wender M, Januszkiewicz-Lewandowska D, Nowak J. Effect of immunomodulatory treatment of multiple sclerosis on lymphocyte surface immunomarkers. Polish journal of pharmacology. 2003;55:877–880. [PubMed] [Google Scholar]
- 23.Viglietta V, Baecher-Allan C, Weiner HL, Hafler DA. Loss of functional suppression by CD4+CD25+ regulatory T cells in patients with multiple sclerosis. The Journal of experimental medicine. 2004;199:971–979. doi: 10.1084/jem.20031579. [DOI] [PMC free article] [PubMed] [Google Scholar]
- 24.Venken K, Hellings N, Thewissen M, Somers V, Hensen K, Rummens JL, Medaer R, Hupperts R, Stinissen P. Compromised CD4+ CD25(high) regulatory T-cell function in patients with relapsing-remitting multiple sclerosis is correlated with a reduced frequency of FOXP3-positive cells and reduced FOXP3 expression at the single-cell level. Immunology. 2008;123:79–89. doi: 10.1111/j.1365-2567.2007.02690.x. [DOI] [PMC free article] [PubMed] [Google Scholar]
- 25.Haas J, Hug A, Viehover A, Fritzsching B, Falk CS, Filser A, Vetter T, Milkova L, Korporal M, Fritz B, Storch-Hagenlocher B, Krammer PH, Suri-Payer E, Wildemann B. Reduced suppressive effect of CD4+CD25high regulatory T cells on the T cell immune response against myelin oligodendrocyte glycoprotein in patients with multiple sclerosis. European journal of immunology. 2005;35:3343–3352. doi: 10.1002/eji.200526065. [DOI] [PubMed] [Google Scholar]
- 26.Schneider A, Rieck M, Sanda S, Pihoker C, Greenbaum C, Buckner JH. The effector T cells of diabetic subjects are resistant to regulation via CD4+ FOXP3+ regulatory T cells. J Immunol. 2008;181:7350–7355. doi: 10.4049/jimmunol.181.10.7350. [DOI] [PMC free article] [PubMed] [Google Scholar]
- 27.Venigalla RK, Tretter T, Krienke S, Max R, Eckstein V, Blank N, Fiehn C, Ho AD, Lorenz HM. Reduced CD4+,CD25- T cell sensitivity to the suppressive function of CD4+,CD25high,CD127 -/low regulatory T cells in patients with active systemic lupus erythematosus. Arthritis and rheumatism. 2008;58:2120–2130. doi: 10.1002/art.23556. [DOI] [PubMed] [Google Scholar]
- 28.Korn T, Reddy J, Gao W, Bettelli E, Awasthi A, Petersen TR, Backstrom BT, Sobel RA, Wucherpfennig KW, Strom TB, Oukka M, Kuchroo VK. Myelin-specific regulatory T cells accumulate in the CNS but fail to control autoimmune inflammation. Nature medicine. 2007;13:423–431. doi: 10.1038/nm1564. [DOI] [PMC free article] [PubMed] [Google Scholar]
- 29.Yang J, Brook MO, Carvalho-Gaspar M, Zhang J, Ramon HE, Sayegh MH, Wood KJ, Turka LA, Jones ND. Allograft rejection mediated by memory T cells is resistant to regulation. Proceedings of the National Academy of Sciences of the United States of America. 2007;104:19954–19959. doi: 10.1073/pnas.0704397104. [DOI] [PMC free article] [PubMed] [Google Scholar]
- 30.Vieira PL, Heystek HC, Wormmeester J, Wierenga EA, Kapsenberg ML. Glatiramer acetate (copolymer-1, copaxone) promotes Th2 cell development and increased IL-10 production through modulation of dendritic cells. J Immunol. 2003;170:4483–4488. doi: 10.4049/jimmunol.170.9.4483. [DOI] [PubMed] [Google Scholar]
- 31.Jung S, Siglienti I, Grauer O, Magnus T, Scarlato G, Toyka K. Induction of IL-10 in rat peritoneal macrophages and dendritic cells by glatiramer acetate. Journal of neuroimmunology. 2004;148:63–73. doi: 10.1016/j.jneuroim.2003.11.014. [DOI] [PubMed] [Google Scholar]
- 32.Burger D, Molnarfi N, Weber MS, Brandt KJ, Benkhoucha M, Gruaz L, Chofflon M, Zamvil SS, Lalive PH. Glatiramer acetate increases IL-1 receptor antagonist but decreases T cell-induced IL-1beta in human monocytes and multiple sclerosis. Proceedings of the National Academy of Sciences of the United States of America. 2009;106:4355–4359. doi: 10.1073/pnas.0812183106. [DOI] [PMC free article] [PubMed] [Google Scholar]
- 33.McCoy MK, Tansey MG. TNF signaling inhibition in the CNS: implications for normal brain function and neurodegenerative disease. Journal of Neuroinflammation. 2008;5:45–57. doi: 10.1186/1742-2094-5-45. [DOI] [PMC free article] [PubMed] [Google Scholar]
Associated Data
This section collects any data citations, data availability statements, or supplementary materials included in this article.


