Abstract
Lower back pain is a common problem frequently encountered without specific biomarkers that correlate well with an individual patient's pain generators. MRI quantification of diffusion and T2 relaxation properties may provide novel insight into mechanical and inflammatory changes that occur in lumbosacral nerve roots in patients with lower back pain. Imaging the spinal nerve roots accurately is difficult due to their small caliber and oblique course in all three planes. Two-dimensional in-plane imaging of the lumbosacral nerve roots requires oblique coronal imaging with large field-of-view (FOV) in both dimensions, resulting in severe geometric distortions using single-shot echo planar imaging (EPI) techniques. The present work describes initial success using a reduced-FOV single-shot spin-echo EPI acquisition to obtain in-plane DTI and T2 mapping of the bilateral lumbar nerve roots at the L4 level of healthy subjects, minimizing partial volume effects, breathing artifacts and geometric distortions. A significant variation of DTI and T2 mapping metrics is also reported along the course of the normal nerve root. The FA value is statistically significantly lower in the dorsal root ganglia (0.287 ± 0.068) than in regions more distally in the spinal nerve (0.402 ± 0.040) (p<10−5). The T2 relaxation value is statistically significantly higher in the dorsal root ganglia (78.0 ± 11.9 ms) than in regions more distally in the spinal nerve (59.5 ± 7.4 ms) (p<10−5). Quantification of nerve root DTI and T2 properties using the proposed methodology may identify the specific site of any degenerative and inflammatory changes along the nerve roots of patients with lower back pain.
Keywords: magnetic resonance imaging (MRI), diffusion tensor imaging (DTI), T2 relaxation, peripheral nerves, lumbar nerve roots, reduced field-of-view (FOV) single-shot EPI
INTRODUCTION
Radiculopathy from nerve root irritation is frequently encountered in degenerative lumbar spine disease, most commonly due to spondylosis or disk herniation. Conventional anatomical magnetic resonance (MR) using two-dimensional (2D) T1- and T2-weighted imaging demonstrates changes in the adjacent structures such as to the intervertebral disk or osteophytes that narrow the normal neural foramen (1). These indirect signs of mechanical nerve root impingement may be seen in subjects without symptoms, making it difficult to identify a specific pain generator (2). Therefore, there is a growing interest in exploring the potential of non-invasive imaging techniques to assign significance to nerve root entrapment, to more specifically detect lumbar pain generators and to advance the understanding of the pathophysiology of radicular pain.
In addition to conventional anatomical MRI techniques used in routine clinical scans, advanced MR neurographic imaging techniques have been recently applied to visualize the nerve roots of the lumbosacral and brachial plexus in order to depict disruption, distortion of nerve morphology and intraneural edema. MR neurographic imaging techniques utilize T2-weighted type contrast with isotropic spatial resolution (3) sometimes combined with diffusion weighting to minimize the signal from the surrounding blood vessels and skeletal muscles (4–6). Although still emerging, high-resolution MR neurographic imaging techniques have shown potential on detecting the presence of nerve root compression or increased T2 signal intensity changes (7). However, their analysis remains qualitative.
Quantitative imaging techniques like T2 relaxometry, diffusion-weighted (DW) MRI and diffusion tensor imaging (DTI) have been extensively applied to the white matter of the central nervous system to probe microstructural and connectivity changes in a variety of pathological conditions including stroke (8). The use of quantitative imaging in the peripheral nerves has been less common and has primarily focused on the distal nerves of the upper and lower extremities (9–14). There have been only a limited number of studies applying quantitative imaging methods in the lumbar or cervical spine nerve roots (15–20).
Lumbar spinal nerve roots are small structures (e.g. L4 root ganglia have an average width of 5 mm and an average length of 7 mm) (19). Moreover, the lumbar spinal nerve roots exit the spinal canal at an angle 30–45° to the long axis of the spinal cord and course obliquely in all three imaging planes (inferior, anterior and lateral), making them difficult to image (19,21). Previous studies have employed axial imaging where the nerve root is obliquely cut in multiple slices (15,17,22). In-plane depiction of the nerve root geometry would require oblique coronal imaging.
Single-shot echo planar imaging (EPI) is necessary to reduce the sensitivity of lumbar nerve root DW imaging to respiratory motion, but suffers from high sensitivity to off-resonance effects. To reduce its sensitivity to off-resonance effects, single-shot EPI is usually combined with parallel imaging (23). Previous studies employing axial single-shot EPI of the lumbar nerve roots have used parallel imaging (17) and have quantified DTI metrics based on ROI placement using information from coronal and sagittal maximum intensity projection reformats (18,19) or fiber tracking results (15,17,22).
In-plane imaging of the nerve roots can be accomplished by prescribing the imaging plane orthogonal to the longitudinal extension of the nerve root at a specific level. An oblique coronal single-shot EPI acquisition would enable in-plane nerve root imaging with reduced partial volume effects compared to an axial acquisition, but such an acquisition would require a large field-of-view (FOV) in both dimensions and would result in increased sensitivity to off-resonance effects and thus geometric distortions. An alternative method to increase the spatial resolution of single-shot EPI scans without exacerbating off-resonance effects is to reduce the FOV in the phase encoding (PE) direction using zonally oblique multi-slice (ZOOM) imaging (24,25), outer volume suppression (26–28) or 2D radiofrequency (RF) excitation (29,30). The purpose of the present work is to show the feasibility of in plane DTI and T2 mapping of the bilateral lumbar spinal nerve roots at the L4-L5 levels with reduced sensitivity to partial volume effects, breathing artifacts and geometric distortions, using a reduced-FOV single-shot EPI technique based on 2D RF excitation.
MATERIALS AND METHODS
MRI measurements
Eleven healthy subjects (age 34.6 ± 11.2 years, 8 male, 3 female) without any history of low back pain and normal standard lumbar spine MR scans were scanned on a 3 T whole-body scanner (General Electric Healthcare, Waukesha, WI, USA) using a six-channel spine coil (selected coil element groups 4, 5 and 6). This study was approved by our Institutional Review Board. The MR exam consisted of a high-resolution T2-weighted 3D fast spin echo (FSE) sequence and reduced-FOV DTI and T2 mapping sequences. The DTI and T2 mapping sequences were bilaterally applied on the L4 nerve root of ten subjects and on the L5 nerve root of one subject.
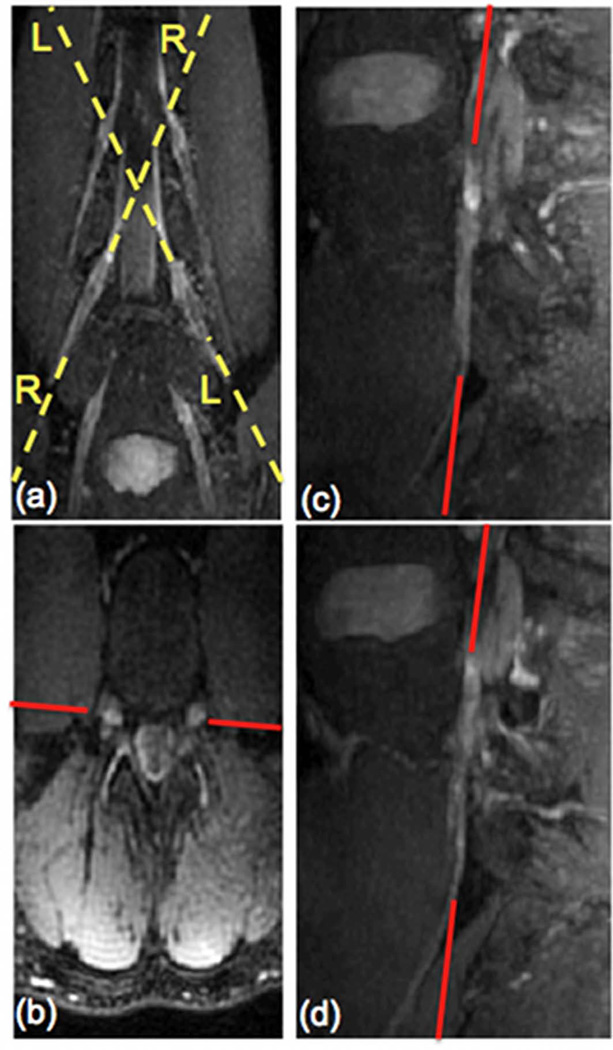
High-resolution sagittal T2-weighted images of the lumbar spine were acquired using a sagittal three-dimensional (3D) fast spin echo (FSE) sequence with fat suppression and the following parameters: TR/TE = 2500/85 ms, echo train length (ETL) = 120, receiver bandwidth = 62.5 kHz, 224×224 acquisition matrix size, FOV = 240×240 mm2, 78 slice locations, acquisition voxel size = 1.1×1.1×2.0 mm3 and reconstruction voxel size = 1.1×1.1×1.0 mm3. To determine the oblique coronal plane orientation for the DTI and the T2 mapping sequences, the acquired reconstructed 3D FSE dataset was reformatted in oblique coronal and straight axial planes/cuts at the level of the L4 or L5 nerve root using maximum intensity projection (MIP) (Figs. 1a and 1b). Then, sagittal oblique reformats were created following the plane of the left L4 or L5 root (line LL in Fig. 1a) and the right L4 or L5 root (line RR in Fig. 1a). The oblique coronal plane of the nerve root was finally determined based on the axial and oblique sagittal reformats. The red line in Fig. 1 shows an example of the oblique coronal plane of L4 nerve root on the axial reformat and the oblique sagittal reformats. During the 5 minutes required to prescribe this imaging plane on the scanner software, additional diagnostic clinical MRI sequences of the subject were obtained.
Figure 1.
L4 nerve root localization for DTI and T2 map acquisition geometries included oblique coronal MIP reformats (a), axial reformats (b), oblique sagittal reformats of left and right nerve roots (c & d respectively) from 3D FSE data.
Both the DTI and T2 mapping sequences were based on a reduced-FOV single-shot spin-echo EPI sequence that limits the excitation FOV in the phase encoding (PE) direction by employing a 2D spatially selective RF excitation. (30). The 2D RF pulse had a duration of 17.3 ms, 44 blips in the slice selection (SS) direction, and time bandwidth products in the PE and SS direction equal to 10 and 3 respectively. Other sequence parameters included: PE direction = S/I, TR = 4000 ms, receiver bandwidth = 250 kHz, 160×42 acquisition matrix size, FOV = 360×90 mm2, acquisition voxel size = 2.2×2.1×4 mm3, 15 slices. The 2D excitation and regular refocusing RF pulse-pair in this sequence also provide inherent fat suppression (30). A partial Fourier acquisition in the PE direction was used with partial Fourier factor equal to 66.7%. The sequence for the DTI acquisition used Nex= 8 and acquired 24 diffusion-weighted gradient directions at a b-value = 500 s/mm2 with TE = 59 ms. The sequence of the T2 mapping acquisition used Nex = 12 and acquired 5 echo times (30, 40, 50, 60 and 70 ms). The overall acquisition time was of the order of 27 minutes (5 minutes for the 3D FSE sequence, 5 minutes for the coronal imaging plane prescription, 13 minutes for the DTI sequence, 4 minutes for the T2 mapping sequence).
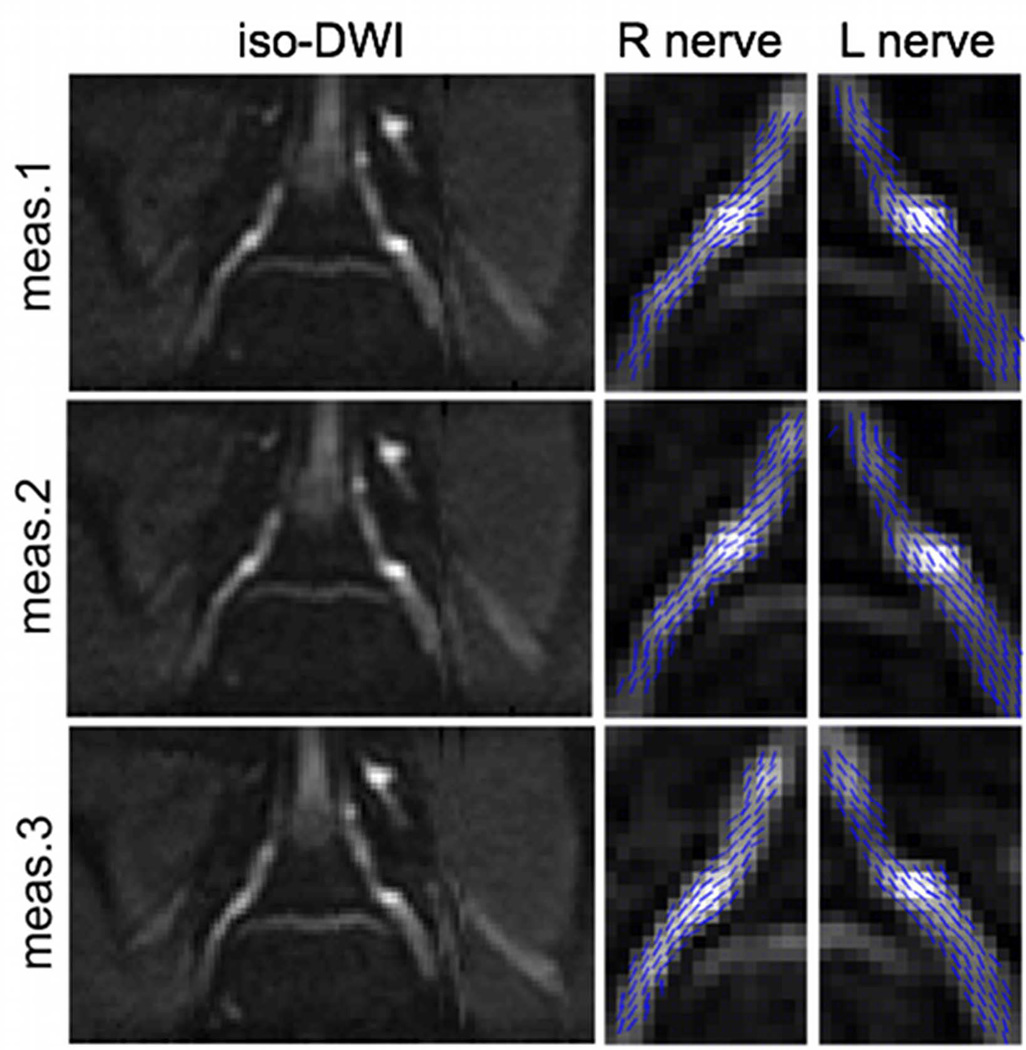
In three of the subjects for whom the quantitative nerve root sequences were applied on the L4 nerve root, the DTI scan was repeated three different times on different days to address the repeatability of the nerve root DTI measurement. In the subject for whom the quantitative nerve root sequences were applied on the L5 nerve root, the DTI scan was also repeated three different times at different days. Finding the oblique coronal slice for the in-plane imaging of the nerve root based on the 3D FSE was performed separately every individual time.
In the subject for whom the quantitative nerve root sequences were applied on the L5 nerve root, a full-FOV DW-EPI sequence was applied in addition to the reduced DW-EPI sequence to study geometric distortion effects. An oblique coronal full-FOV 2D T2-weighted echo-shifted FSE sequence was also acquired to serve as a reference with respect to which the effect of geometric distortions would be evaluated in reduced-FOV and full-FOV EPI scans. The 2D FSE images were also used to estimate the B0-fieldmap in the regions surrounding the nerve root. The sequence parameters of the reduced-FOV EPI scan were kept the same as listed above. The reduced-FOV EPI scan had FOV = 360×90 mm2, 160×42 acquisition matrix size and Nex = 8 and the full-FOV EPI scan had FOV = 360×360 mm2, 160×160 acquisition matrix size and Nex = 2, in order to maintain a similar signal-to-noise ratio (SNR). The acquisition parameters for the echo-shifted FSE scan were as follows: three echoes acquired at relative water-fat phases (-π/6, π/2, 7π/6), TR/TEmin/ΔTE = 3600/98.0/0.8 ms, ETL = 8, 288×224 acquisition matrix, receiver bandwidth = 27.8 kHz. The iterative decomposition of water and fat with echo asymmetry and least-squares estimation (IDEAL) algorithm (31) was employed to measure the fieldmap in the presence of water and fat components.
Image reconstruction and post-processing
The individual single-shot EPI images were complex-averaged after correcting for motion induced-phase. Complex averaging was preferable since it reduces the Rician noise-induced bias compared to magnitude averaging (30,32). The phase correction process included the following steps: The k-space data was first shifted so that the maximum signal is located at the center of k-space. The k-space data was then filtered using a Fermi window function around the center of k-space to derive an image in image space with only low-resolution phase. The conjugate of the low-resolution phase was then multiplied with the original image to remove the low-resolution (motion-induced) phase from the image corresponding to each individual average (thus avoiding the need for any phase unwrapping) (30). The normalized width of the Fermi window was set experimentally to 0.125 providing a good trade-off between reducing Rician noise bias and increasing sensitivity to motion induced phase interferences (33).
Eddy current-induced gradients in the read out (RO), PE and SS direction axes can induce shear distortion in the PE direction, change of scale (compression/stretching) in the PE direction and translation in PE direction, respectively (34). Due to the limited FOV of the present acquisition in the PE direction, the effect of the eddy current-induced gradient in the PE direction could be neglected. That is why the correction of eddy-current induced distortions should primarily include correction of shear and translation in PE direction. This distortion correction was performed by maximizing the signal cross-correlation at each RO location as previously proposed in (34). Specifically, the data at each RO location was first interpolated to 4 times the original matrix size. The distortion shift was then computed at each RO location by maximizing the normalized signal cross-correlation between the non-distorted and the distorted image (34). The derived distortion shift values variation with RO location was then fitted to a linear function with the first order term representing the shear coefficient (for correction of distortion induced by shear) and the constant term representing the translation coefficient (for correction of distortion induced by translation) (34).
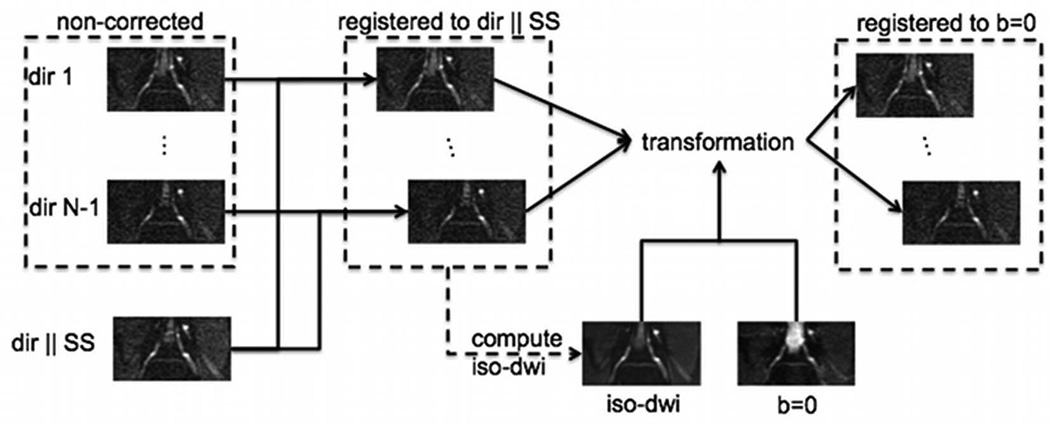
The flowchart of the employed eddy current correction procedure is shown schematically in Fig. 2. All the diffusion-weighted images were first cropped around the nerve anatomy of interest. The individual diffusion-weighted images were then registered to the diffusion-weighted image with diffusion direction perpendicular to the nerve root geometry (parallel to the SS direction) using the distortion correction procedure described above. The iso-diffusion-weighted image (determined as the geometric mean of the diffusion weighted images acquired with different diffusion encoding directions) was then computed and registered to the non-diffusion-weighted (b=0 s/mm2) image also using the distortion correction procedure described above. The derived transformation was applied to the individual diffusion-weighted images registered to the diffusion-weighted image with diffusion direction perpendicular to the nerve root geometry, to impose that all diffusion-weighted images were registered to the non-diffusion-weighted (b=0 s/mm2) image.
Figure 2.
Flowchart of eddy current correction procedure.
DTI and T2 relaxation parameter maps were computed using non-linear least squares fitting routines in MatLab (MathWorks, Natick, MA). Given the low anisotropy values previously reported in the lumbar nerve root regions (15,17,22), the diffusion tensor was modeled having three unequal eigenvalues. Masks defined by manual segmentation of the nerve root region in the iso-diffusion weighted images were applied to the parameter maps when visualizing the DTI and T2 metrics maps. ROIs were then drawn on the level of dorsal root ganglia (DRG) and more distally in the spinal nerve (SPN) at both sides (left and right) of the ten subjects scanned at the L4 nerve root level. Drawing ROIs for the DRG and SPN regions was based on the iso-diffusion-weighted images. The DTI parameters, including diffusion tensor eigenvalues (λ1, λ2, λ3),, mean diffusivity (MD) and fractional anisotropy (FA), as well as T2 relaxation values of the two different regions were then compared using a two-sample t-test. The data from the two regions were presented as mean ± one standard deviation. Coefficients of variation (CV) and intraclass correlation (ICC) values were computed to evaluate the repeatability in the MD and FA measurement of the nerve root of the subject scanned three different times.
RESULTS
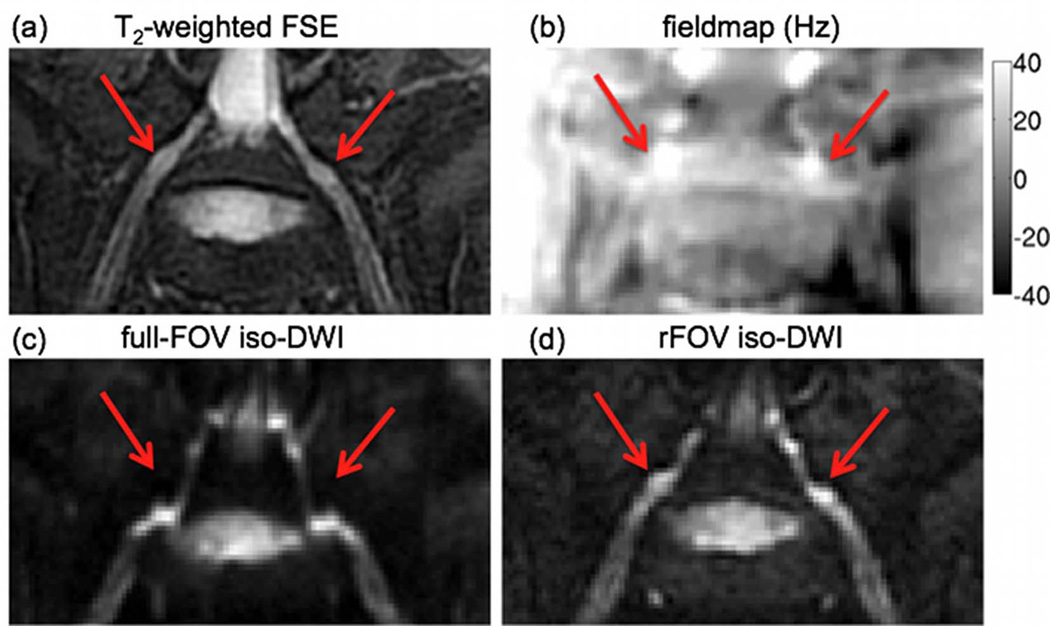
The effect of geometric distortions on the oblique coronal EPI images of the L5 nerve root of a volunteer is shown in Figure 3. The fieldmap shows variations of the local magnetic field up to 40 Hz in the regions where the nerve roots exit the spinal foraminae, due to the magnetic susceptibility difference between bone and nerve tissues (red arrows in Fig. 3). These fieldmap variations induce strong distortions of the nerve root geometry in the locations where the nerve roots exit the spinal foraminae in the PE direction of the full-FOV EPI scan (compared to the undistorted anatomy of the nerve root in the T2-weighted FSE). The geometric distortions are substantially reduced in the EPI images acquired using the proposed reduced-FOV technique (red arrows in Fig. 3).
Figure 3.
Effect of geometric distortions: (a) oblique coronal T2-weighted FSE, (b) fieldmap (grayscale map values in Hz) and oblique coronal iso-diffusion weighted images using (c) full-FOV EPI and (d) reduced-FOV EPI. The red arrow points to the intervertebral foraminal region showing strong fieldmap variations and significant geometric distortions in the full-FOV EPI acquisition along the PE direction (S/I direction).
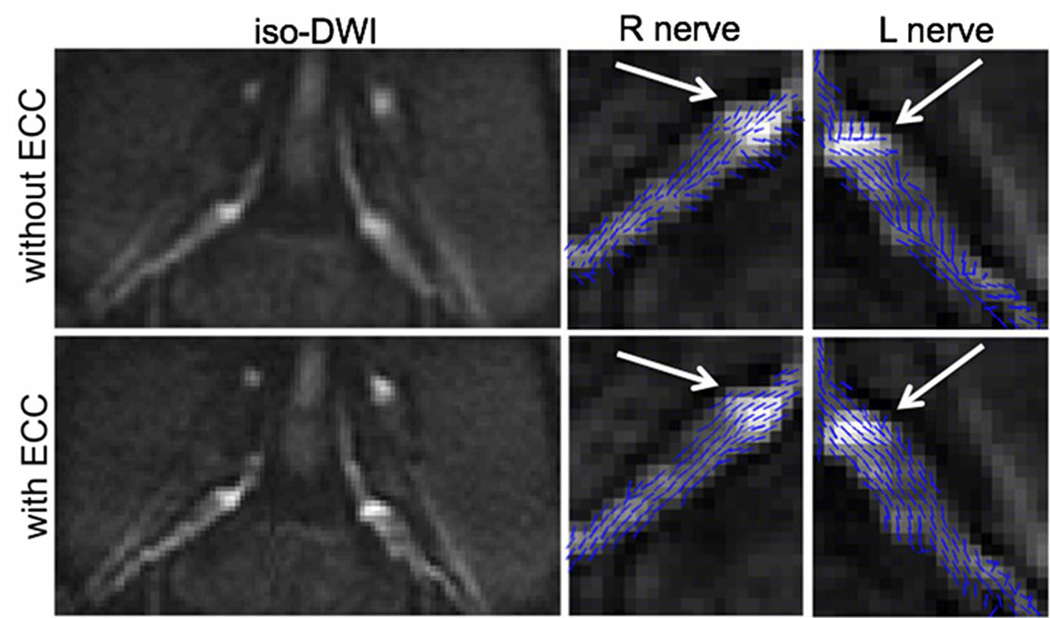
The effect of the eddy current correction on the iso-diffusion-weighted image and the primary diffusion tensor eigenvector orientation map is shown in Figure 4. The iso-diffusion-weighted-image without eddy current correction suffers from serious blurring of the nerve root boundaries in the PE direction. Eddy currents can also induce erroneous nerve fiber orientations, as it is shown on the projection of the primary diffusion tensor eigenvector on the slice plane (white arrow in Fig. 4). After eddy current correction, the blurring of the nerve root boundaries in the iso-diffusion-weighted image is reduced and the nerve fiber orientation follows the expected nerve course (white arrow in Fig. 4).
Figure 4.
Effect of eddy current correction (ECC): bilateral iso-diffusion weighted images, right and left nerve primary diffusion tensor eigenvector projections on slice plane superimposed on iso-diffusion weighted images. The first row shows the images without eddy current correction (without ECC) and the second row shows the images with eddy current correction (with ECC).
The repeatability of the DTI measurement of the L5 nerve root of the same subject at three different days is examined in Figure 5. The iso-diffusion-weighted images highlight the ability to localize the L5 nerve root in a reproducible manner using the 3D FSE localizing scan. The right and left nerve primary eigenvector projections on the slice plane superimposed on the iso-diffusion-weighted images qualitatively confirm the ability of the employed method to resolve the nerve root fibers in a reproducible manner.
Figure 5.
Repeatability of L5 nerve root DTI of the same subject at three different exams. First column shows the bilateral iso-diffusion weighted images. Second column shows the right nerve primary diffusion tensor eigenvector projections on the slice plane superimposed on iso-diffusion weighted images. Third column shows the left nerve primary diffusion tensor eigenvector projections on the slice plane superimposed on iso-diffusion weighted images.
A quantitative analysis of the L4 nerve root DTI metrics resulted in coefficient of variations for the MD equal to 5.8% and 5.9% in the DRG and SPN regions respectively and for the FA equal to 7.1% and 6.6% in the DRG and SPN regions respectively. ICC values for the MD were equal to 0.84 and 0.53 in the DRG and SPN regions respectively and ICC values for the FA were equal to 0.90 and 0.78 in the DRG and SPN regions respectively.
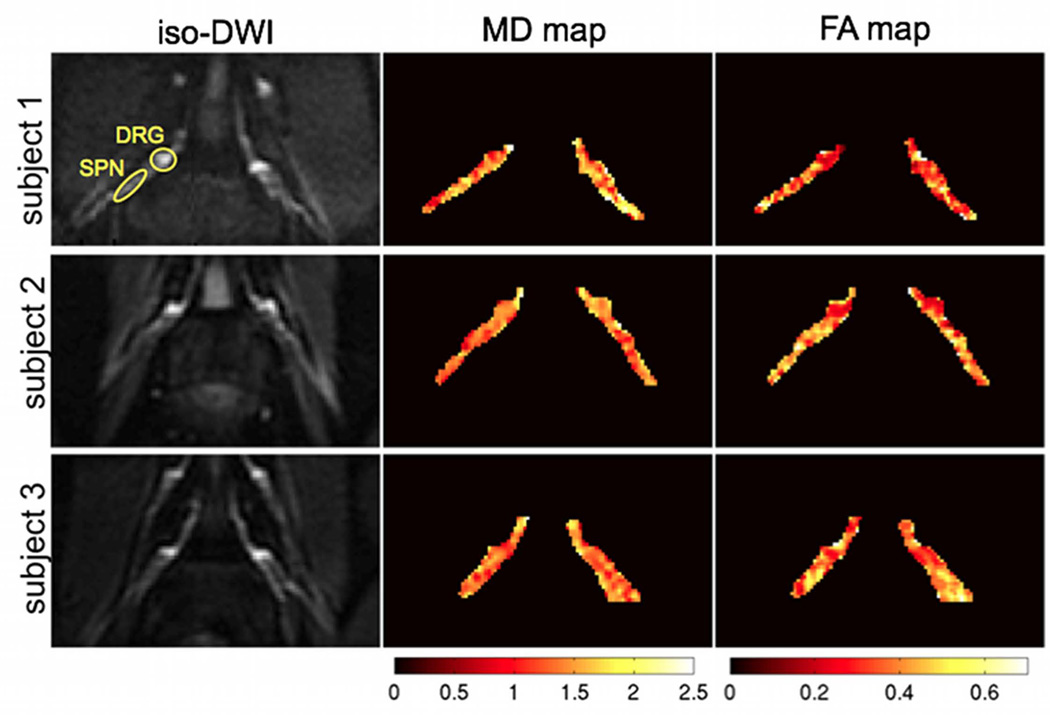
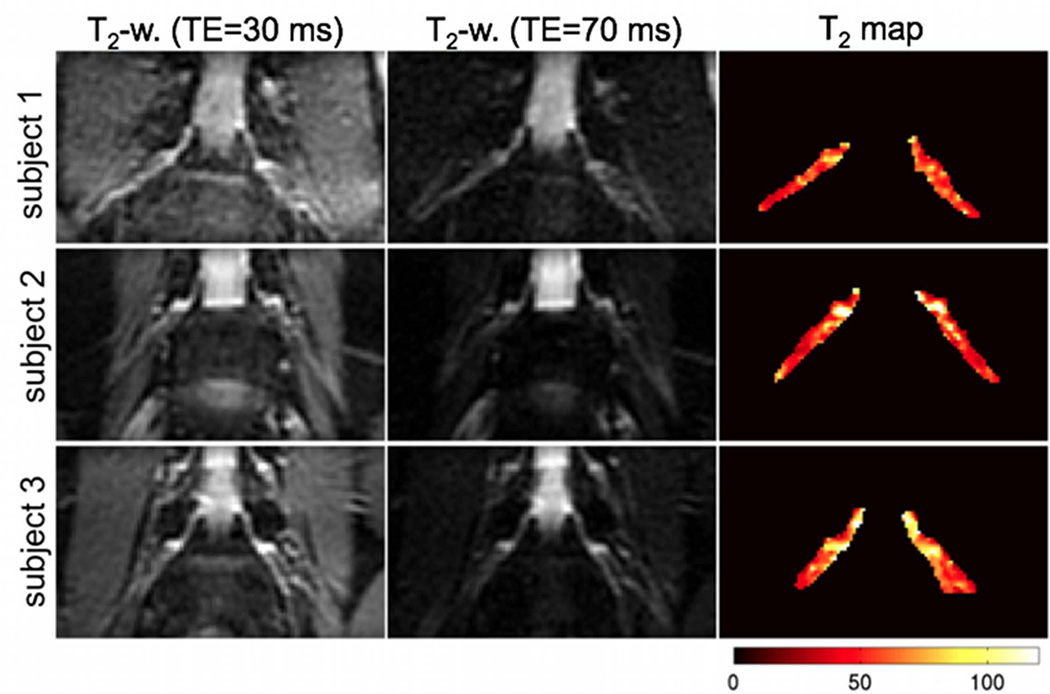
Representative results of the DTI measurements on the L4 nerve roots of three subjects are shown in Figure 6. The iso-diffusion-weighted images in the resulting oblique coronal plane can delineate the bilateral nerve roots well from surrounding muscle due to the longer T2 value of nerve roots relative to muscle. The MD and FA maps also show the spatial variation of the MD and FA along the course of the nerve root. The FA maps show lower FA values in the DRG regions than the rest of the nerve root. Figure 7 shows representative results of the T2 relaxometry measurements on the L4 nerve roots of three subjects. The T2-weighted images with TE=70 ms in the resulting oblique coronal plane can also delineate nerve roots well from surrounding muscle due to the longer T2 value of nerve roots relative to muscle. The T2 relaxation maps show higher T2 relaxation time values in the DRG regions than the rest of the nerve root.
Figure 6.
Representative results of DTI measurements on the L4 nerve roots of three subjects. The first column shows the bilateral iso-diffusion weighted images, the second column shows the mean diffusivity maps (colored scale map values in 10−9 m2/s) and the third column shows the fractional anisotropy maps (colored scale map values have no units). Typical region of interests (ROIs) for DRG and SPN are shown.
Figure 7.
Representative results of T2 relaxometry measurements on the L4 nerve roots of three subjects. The first and second column show the T2-weighted images at TE=30 ms and at TE=70 ms respectively and the third column shows the T2 relaxation maps (colored scale map values in ms).
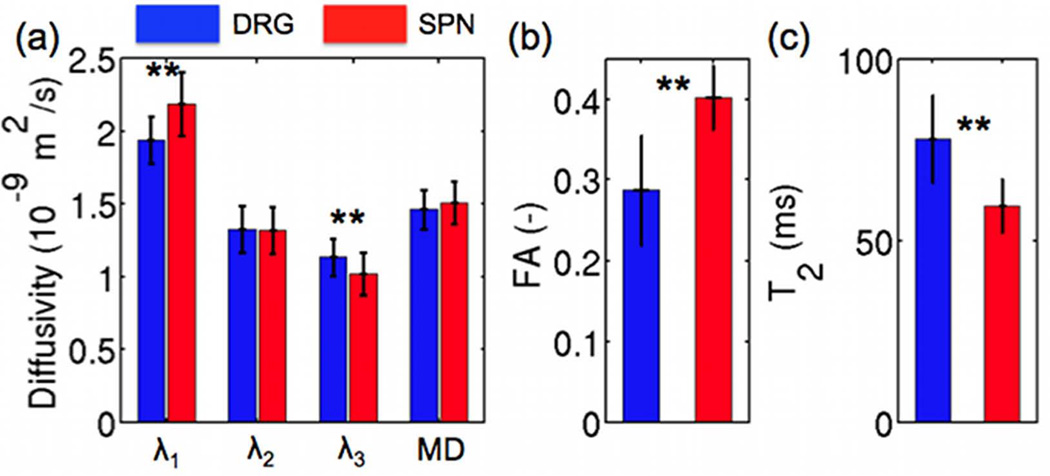
Figure 8 compares the DTI and T2 relaxometry parameter group results between the DRG and SPN regions of the ten scanned subjects. There is no statistically significant difference between mean diffusivity of the DRG (1.47 ± 0.15 × 10⁻⁹ m2/s) and the SPN (1.51 ± 0.14 × 10⁻⁹ m2/s). The primary diffusion tensor eigenvalue in the DRG (1.94 ± 0.22 × 10⁻⁹ m2/s) is significantly lower than in the SPN (2.19 ± 0.16 × 10⁻⁹ m2/s) (p<10−3). There is no statistically significant difference between the secondary diffusion tensor eigenvalue of the DRG (1.32 ± 0.16 × 10⁻⁹ m2/s) and the SPN (1.32 ± 0.16 × 10⁻⁹ m2/s). The tertiary diffusion tensor eigenvalue in the DRG (1.13 ± 0.14 × 10⁻⁹ m2/s) is significantly higher than in the SPN (1.02 ± 0.13 × 10⁻⁹ m2/s) (p=0.01). The fractional anisotropy is significantly lower in the DRG (0.287 ± 0.068) than in the SPN (0.402 ± 0.040) (p<10−5). The T2 relaxation time of the DRG is significantly higher (78.0 ± 11.9 ms) in the DRG than in the SPN (59.5 ± 7.4 ms) (p<10−5).
Figure 8.
Comparison of diffusion tensor eigenvalues (λ1, λ2, λ3), mean diffusivity (MD) (a), fractional anisotropy (FA) (b) and T2 relaxation (c) value differences between the L4 dorsal root ganglia (DRG) and adjacent spinal nerves (SPN) of 10 subjects (** denotes statistical significance with p<0.05).
DISCUSSION
The presented results show that single-shot EPI combined with a 2D RF excitation enables oblique coronal imaging of lumbar nerve roots for in-plane quantification of nerve roots DTI and T2 parameters without significant breathing artifacts or geometric distortions. Most of the previous studies focusing on DTI of the lumbar nerve roots have used axial acquisitions, for which the nerve passes at an angle 30–45 ° through the slice, and hence these are vulnerable to significant partial volume effects. To the best of our knowledge ours is the first study showing the feasibility of in-plane quantitative imaging of the lumbar nerve roots. The proposed methodology can be also used to study the spatial variation in DTI metrics and T2 relaxation values along the course of the nerve root.
An essential step in the post-processing of the acquired diffusion-weighted images was the correction for eddy current effects. The nerve roots are small structures and geometric distortions in the PE direction (of the order of 1–2 voxels) caused by eddy currents can induce significant bias on the DTI parameter results. Compensation of eddy currents in applications of DTI at the central nervous system has been usually performed using a twice-refocused spin-echo acquisition (35). However, such a diffusion preparation scheme would further lengthen the echo time of the employed acquisition, inducing an additional SNR loss, which would be critical to the relatively reduced SNR of the high-resolution reduced-FOV acquisition. Instead correction of the eddy currents was performed based on a simple post-processing algorithm by maximizing the signal cross-correlation at each RO line. The registration occurred in two steps: first registering all the DW images to the DW image with maximum signal for the nerve region (diffusion direction parallel to SS) and then registering the derived iso-DW image to the b=0 s/mm2 image. This two-step process improved the performance of the eddy current correction given the low SNR of the individual DW images and the different contrast between the individual DW images and the b=0 s/mm2 image (CSF shows weak signal on the DW images but strong signal on the b=0 s/mm2 image).
In the present work, in plane T2 mapping of lumbar nerve roots is performed using a single-shot EPI acquisition at variable TEs. T2 mapping of the nerve roots could be also performed using a multi-echo spin-echo acquisition. However, the same single-shot EPI approach as the DTI scan at multiple TEs was preferred to multi-echo spin-echo acquisition for T2 mapping based on the consideration of acquiring co-registered DTI and T2 mapping data.
The reported quantitative parameter results show similar MD, lower FA and higher T2 relaxation values in the dorsal root ganglia than more distally along the spinal nerves. The finding of the higher T2 value in the root ganglia compared to the T2 values more distally in the spinal nerve is consistent with the qualitative observation that in neurographic T2-weighted sequences the root ganglia show higher signal than the rest of the nerve. Both the higher T2 and the lower anisotropy of dorsal root ganglia compared to the spinal nerve could be attributed to the fact that they are composed of both myelinated axons and neuronal cell bodies (36,37). Therefore, one important advantage of the proposed in-plane imaging acquisition technique is the ability to resolve the regional variation of MD, FA and T2 metrics along the course of the nerve root. A regional analysis of the DTI and T2 metrics across the course of the nerve root using a standard axial DTI acquisition would be suffering from significant partial volume effects.
The results of the present study employing the in-plane coronal acquisition show FA nerve values distal to the dorsal root ganglia of the order of 0.40. These FA values are higher than FA values (0.22–0.24) reported in prior studies employing axial acquisitions (15,17). The presently reported FA values are more consistent with previous FA measurements in distal peripheral nerves: 0.42–0.59 in median nerves (10,13), 0.41–0.62 in tibial nerves (12,14). This finding could be attributed to reduced partial volume effects from adjacent fat and muscle in the presently employed oblique coronal plane acquisition compared to previous axial plane acquisitions. However, it should be emphasized that the nerve roots are small caliber structures and there would be some residual partial volume effects even with the relatively high spatial resolution (2.2×2.1×4.0 mm3) of the proposed coronal plane acquisition scheme.
The present study has some limitations. First, a high-resolution neurographic imaging sequence is required to visualize the nerve root morphology in order to determine the imaging plane of the appropriate lumbar nerve root. That was performed in the present acquisition using a 3D T2-weighted FSE sequence that added five minutes to the total scan time. Based on the neurographic imaging sequence, the determination of the imaging plane could be performed in a rather reproducible manner, as the results of the same subject scanned at three different examinations show. Second, good alignment of the imaging plane with the nerve root plane is required to minimize partial volume effects on the quantitative DTI and T2 relaxometry metrics. Good alignment of an oblique coronal imaging plane is in general not feasible for multiple nerve root levels. However, given that there would be some a priori knowledge of the level of the nerve root affected by pathology (using conventional anatomical MRI or routine axial DTI with fiber tracking), the quantitative measurements using the proposed reduced-FOV technique could focus at a specific nerve root level, aiming to quantify any inflammatory or degenerative changes at that level. Third, the scan time of the present DTI acquisition with 24 directions and 8 averages might be relatively long for applying it clinically in patients with severe back pain. Depending on the employed MR hardware set-up (i.e. RF coil) and the maximum size of the reduced FOV in the phase encoding dimension allowed for tolerable geometric distortions, further reduction of the number of directions or averages might be possible to shorten the total scan time without severely compromising SNR and the quality of the derived DTI metric maps.
The present study shows that in plane DTI and T2 relaxometry of the bilateral lumbar nerve roots are feasible using a reduced-FOV single-shot EPI acquisition with reduced sensitivity to geometric distortions and breathing artifacts. Such an acquisition methodology can detect the spatial variation of DTI and T2 relaxation metrics along the course of the nerve root, showing lower FA and higher T2 relaxation values in the dorsal root ganglia than more distally along the spinal nerves. Lumbar spine pain remains a complex clinical disorder. Conventional MRI protocols often detect multiple structural abnormalities without identifying the actual pain generator and target for therapy (1,2). Quantification of nerve root diffusion tensor and T2 values may provide an objective measure of nerve root inflammation, edema, demyelination or ischemia (15–17,19,22). Therefore, quantification of nerve root DTI and T2 relaxation properties using the proposed methodology may improve our understanding and ability to diagnose acute or chronic pathological inflammatory changes underlying pain generation associated with radiculopathy.
ACKNOWLEDGEMENTS
This research was supported by NIH R01-AG17762.
LIST OF ABBREVIATIONS
- CSF
cerebrospinal fluid
- DW
diffusion-weighted
- DWI
diffusion-weighted imaging
- DRG
dorsal root ganglia
- DTI
diffusion tensor imaging
- EPI
echo planar imaging
- FOV
field-of-view
- FSE
fast spin-echo
- IDEAL
iterative decomposition of water and fat with echo asymmetry and least squares estimation
- MIP
maximum intensity projection
- PE
phase encoding
- RF
radiofrequency
- RO
read out
- ROI
region of interest
- SPN
spinal nerves
- SS
slice selection
- TE
echo time
- TR
repetition time
REFERENCES
- 1.Leone A, Cianfoni A, Cerase A, Magarelli N, Bonomo L. Lumbar spondylolysis: a review. Skeletal Radiol. 2011;40(6):683–700. doi: 10.1007/s00256-010-0942-0. [DOI] [PubMed] [Google Scholar]
- 2.Sheehan NJ. Magnetic resonance imaging for low back pain: indications and limitations. Ann Rheum Dis. 2010;69(1):7–11. doi: 10.1136/ard.2009.110973. [DOI] [PubMed] [Google Scholar]
- 3.Shankaranarayan A, Xiao X, Shen H, Madhuranthakam A. MR nerve imaging using blood suppressed 3D T2-weighted imaging with uniform fat suppression. Proceedings of the 19th Annual Meeting of ISMRM; Montreal, Canada. 2011. p. 2462. [Google Scholar]
- 4.Takahara T, Hendrikse J, Kwee TC, Yamashita T, Van Cauteren M, Polders D, Boer V, Imai Y, Mali WP, Luijten PR. Diffusion-weighted MR neurography of the sacral plexus with unidirectional motion probing gradients. Eur Radiol. 2010;20(5):1221–1226. doi: 10.1007/s00330-009-1665-2. [DOI] [PMC free article] [PubMed] [Google Scholar]
- 5.Takahara T, Hendrikse J, Yamashita T, Mali WP, Kwee TC, Imai Y, Luijten PR. Diffusion-weighted MR neurography of the brachial plexus: feasibility study. Radiology. 2008;249(2):653–660. doi: 10.1148/radiol.2492071826. [DOI] [PubMed] [Google Scholar]
- 6.Zhang ZW, Song LJ, Meng QF, Li ZP, Luo BN, Yang YH, Pei Z. High-resolution diffusion-weighted MR imaging of the human lumbosacral plexus and its branches based on a steady-state free precession imaging technique at 3T. AJNR Am J Neuroradiol. 2008;29(6):1092–1094. doi: 10.3174/ajnr.A0994. [DOI] [PMC free article] [PubMed] [Google Scholar]
- 7.Zhang Z, Song L, Meng Q, Li Z, Pan B, Yang Z, Pei Z. Morphological analysis in patients with sciatica: a magnetic resonance imaging study using three-dimensional high-resolution diffusion-weighted magnetic resonance neurography techniques. Spine (Phila Pa 1976) 2009;34(7):E245–E250. doi: 10.1097/BRS.0b013e318197162e. [DOI] [PubMed] [Google Scholar]
- 8.Schaefer PW, Grant PE, Gonzalez RG. Diffusion-weighted MR imaging of the brain. Radiology. 2000;217(2):331–345. doi: 10.1148/radiology.217.2.r00nv24331. [DOI] [PubMed] [Google Scholar]
- 9.Gambarota G, Veltien A, Klomp D, Van Alfen N, Mulkern RV, Heerschap A. Magnetic resonance imaging and T2 relaxometry of human median nerve at 7 Tesla. Muscle Nerve. 2007;36(3):368–373. doi: 10.1002/mus.20826. [DOI] [PubMed] [Google Scholar]
- 10.Hiltunen J, Kirveskari E, Numminen J, Lindfors N, Goransson H, Hari R. Pre- and post-operative diffusion tensor imaging of the median nerve in carpal tunnel syndrome. Eur Radiol. 2012;22(6):1310–1319. doi: 10.1007/s00330-012-2381-x. [DOI] [PubMed] [Google Scholar]
- 11.Hiltunen J, Suortti T, Arvela S, Seppa M, Joensuu R, Hari R. Diffusion tensor imaging and tractography of distal peripheral nerves at 3 T. Clin Neurophysiol. 2005;116(10):2315–2323. doi: 10.1016/j.clinph.2005.05.014. [DOI] [PubMed] [Google Scholar]
- 12.Kakuda T, Fukuda H, Tanitame K, Takasu M, Date S, Ochi K, Ohshita T, Kohriyama T, Ito K, Matsumoto M, Awai K. Diffusion tensor imaging of peripheral nerve in patients with chronic inflammatory demyelinating polyradiculoneuropathy: a feasibility study. Neuroradiology. 2011;53(12):955–960. doi: 10.1007/s00234-010-0833-z. [DOI] [PubMed] [Google Scholar]
- 13.Khalil C, Hancart C, Le Thuc V, Chantelot C, Chechin D, Cotten A. Diffusion tensor imaging and tractography of the median nerve in carpal tunnel syndrome: preliminary results. Eur Radiol. 2008;18(10):2283–2291. doi: 10.1007/s00330-008-0971-4. [DOI] [PubMed] [Google Scholar]
- 14.Tanitame K, Iwakado Y, Akiyama Y, Ueno H, Ochi K, Otani K, Takasu M, Date S, Awai K. Effect of age on the fractional anisotropy (FA) value of peripheral nerves and clinical significance of the age-corrected FA value for evaluating polyneuropathies. Neuroradiology. 2011;54:815–821. doi: 10.1007/s00234-011-0981-9. [DOI] [PubMed] [Google Scholar]
- 15.Balbi V, Budzik JF, Duhamel A, Bera-Louville A, Le Thuc V, Cotten A. Tractography of lumbar nerve roots: initial results. Eur Radiol. 2011;21(6):1153–1159. doi: 10.1007/s00330-010-2049-3. [DOI] [PubMed] [Google Scholar]
- 16.Danagoulian G, Colen RR, Nayak K, Mukundan S, Jolesz F, Schmidt EJ. Detection of nerve injury with diffusion weighted wide band steady state free precession (DW-WBSSFP) in the lumbar spine. Proceedings of the 19th Annual Meeting of ISMRM; Montreal, Canada. 2011. p. 4294. [Google Scholar]
- 17.Eguchi Y, Ohtori S, Orita S, Kamoda H, Arai G, Ishikawa T, Miyagi M, Inoue G, Suzuki M, Masuda Y, Andou H, Takaso M, Aoki Y, Toyone T, Watanabe A, Takahashi K. Quantitative evaluation and visualization of lumbar foraminal nerve root entrapment by using diffusion tensor imaging: preliminary results. AJNR Am J Neuroradiol. 2011;32(10):1824–1829. doi: 10.3174/ajnr.A2681. [DOI] [PMC free article] [PubMed] [Google Scholar]
- 18.Eguchi Y, Ohtori S, Yamashita M, Yamauchi K, Suzuki M, Orita S, Kamoda H, Arai G, Ishikawa T, Miyagi M, Ochiai N, Kishida S, Inoue G, Masuda Y, Ochi S, Kikawa T, Toyone T, Takaso M, Aoki Y, Takahashi K. Diffusion-weighted magnetic resonance imaging of symptomatic nerve root of patients with lumbar disk herniation. Neuroradiology. 2011;53(9):633–641. doi: 10.1007/s00234-010-0801-7. [DOI] [PubMed] [Google Scholar]
- 19.Eguchi Y, Ohtori S, Yamashita M, Yamauchi K, Suzuki M, Orita S, Kamoda H, Arai G, Ishikawa T, Miyagi M, Ochiai N, Kishida S, Masuda Y, Ochi S, Kikawa T, Takaso M, Aoki Y, Toyone T, Suzuki T, Takahashi K. Clinical applications of diffusion magnetic resonance imaging of the lumbar foraminal nerve root entrapment. Eur Spine J. 2010;19(11):1874–1882. doi: 10.1007/s00586-010-1520-9. [DOI] [PMC free article] [PubMed] [Google Scholar]
- 20.Vargas MI, Viallon M, Nguyen D, Delavelle J, Becker M. Diffusion tensor imaging (DTI) and tractography of the brachial plexus: feasibility and initial experience in neoplastic conditions. Neuroradiology. 2010;52(3):237–245. doi: 10.1007/s00234-009-0643-3. [DOI] [PubMed] [Google Scholar]
- 21.Tanitame K, Tanitame N, Tani C, Ishikawa M, Takasu M, Date S, Otani K, Awai K. Evaluation of lumber nerve root compression using thin-slice thickness coronal magnetic resonance imaging: three-dimensional fat-suppressed multi-shot balanced non-steady-state free precession versus three-dimensional T1-weighted spoiled gradient-recalled echo. Jpn J Radiol. 2011;29(9):623–629. doi: 10.1007/s11604-011-0604-8. [DOI] [PubMed] [Google Scholar]
- 22.van der Jagt PK, Dik P, Froeling M, Kwee TC, Nievelstein RA, Ten Haken B, Leemans A. Architectural configuration and microstructural properties of the sacral plexus: A diffusion tensor MRI and fiber tractography study. Neuroimage. 2012;62(3):1792–1799. doi: 10.1016/j.neuroimage.2012.06.001. [DOI] [PubMed] [Google Scholar]
- 23.Bammer R, Auer M, Keeling SL, Augustin M, Stables LA, Prokesch RW, Stollberger R, Moseley ME, Fazekas F. Diffusion tensor imaging using single-shot SENSE-EPI. Magn Reson Med. 2002;48(1):128–136. doi: 10.1002/mrm.10184. [DOI] [PubMed] [Google Scholar]
- 24.Dowell NG, Jenkins TM, Ciccarelli O, Miller DH, Wheeler-Kingshott CA. Contiguous-slice zonally oblique multislice (CO-ZOOM) diffusion tensor imaging: examples of in vivo spinal cord and optic nerve applications. J Magn Reson Imaging. 2009;29(2):454–460. doi: 10.1002/jmri.21656. [DOI] [PubMed] [Google Scholar]
- 25.Wheeler-Kingshott CA, Parker GJ, Symms MR, Hickman SJ, Tofts PS, Miller DH, Barker GJ. ADC mapping of the human optic nerve: increased resolution, coverage, and reliability with CSF-suppressed ZOOM-EPI. Magn Reson Med. 2002;47(1):24–31. doi: 10.1002/mrm.10016. [DOI] [PubMed] [Google Scholar]
- 26.Karampinos DC, Van AT, Olivero WC, Georgiadis JG, Sutton BP. High-resolution diffusion tensor imaging of the human pons with a reduced field-of-view, multishot, variable-density, spiral acquisition at 3 T. Magn Reson Med. 2009;62(4):1007–1016. doi: 10.1002/mrm.22105. [DOI] [PubMed] [Google Scholar]
- 27.von Morze C, Kelley DA, Shepherd TM, Banerjee S, Xu D, Hess CP. Reduced field-of-view diffusion-weighted imaging of the brain at 7 T. Magn Reson Imaging. 2010;28(10):1541–1545. doi: 10.1016/j.mri.2010.06.025. [DOI] [PMC free article] [PubMed] [Google Scholar]
- 28.Wilm BJ, Svensson J, Henning A, Pruessmann KP, Boesiger P, Kollias SS. Reduced field-of-view MRI using outer volume suppression for spinal cord diffusion imaging. Magn Reson Med. 2007;57(3):625–630. doi: 10.1002/mrm.21167. [DOI] [PubMed] [Google Scholar]
- 29.Finsterbusch J. High-resolution diffusion tensor imaging with inner field-of-view EPI. J Magn Reson Imaging. 2009;29(4):987–993. doi: 10.1002/jmri.21717. [DOI] [PubMed] [Google Scholar]
- 30.Saritas EU, Cunningham CH, Lee JH, Han ET, Nishimura DG. DWI of the spinal cord with reduced FOV single-shot EPI. Magn Reson Med. 2008;60(2):468–473. doi: 10.1002/mrm.21640. [DOI] [PubMed] [Google Scholar]
- 31.Reeder SB, Pineda AR, Wen Z, Shimakawa A, Yu H, Brittain JH, Gold GE, Beaulieu CH, Pelc NJ. Iterative decomposition of water and fat with echo asymmetry and least-squares estimation (IDEAL): application with fast spin-echo imaging. Magn Reson Med. 2005;54(3):636–644. doi: 10.1002/mrm.20624. [DOI] [PubMed] [Google Scholar]
- 32.Newbould RD, Skare S, Bammer R. On the utility of complex-averaged diffusion-weighted images. Proceedings of the 16th Annual Meeting of ISMRM; Toronto, Canada. 2008. p. 1810. [Google Scholar]
- 33.Skare S, Holdsworth S, Newbould RD, Bammer R. On the battle between Rician noise and phase-interferences in DWI. Proceedings of the 17th Annual Meeting of ISMRM; Honolulu, Hawaii. 2009. p. 1409. [Google Scholar]
- 34.Haselgrove JC, Moore JR. Correction for distortion of echo-planar images used to calculate the apparent diffusion coefficient. Magn Reson Med. 1996;36(6):960–964. doi: 10.1002/mrm.1910360620. [DOI] [PubMed] [Google Scholar]
- 35.Reese TG, Heid O, Weisskoff RM, Wedeen VJ. Reduction of eddy-current-induced distortion in diffusion MRI using a twice-refocused spin echo. Magn Reson Med. 2003;49(1):177–182. doi: 10.1002/mrm.10308. [DOI] [PubMed] [Google Scholar]
- 36.Kobayashi S, Yoshizawa H, Yamada S. Pathology of lumbar nerve root compression. Part 2: morphological and immunohistochemical changes of dorsal root ganglion. J Orthopaed Res. 2004;22(1):180–188. doi: 10.1016/S0736-0266(03)00132-3. [DOI] [PubMed] [Google Scholar]
- 37.Kobayashi S, Yoshizawa H, Yamada S. Pathology of lumbar nerve root compression. Part 1: Intraradicular inflammatory changes induced by mechanical compression. J Orthopaed Res. 2004;22(1):170–179. doi: 10.1016/S0736-0266(03)00131-1. [DOI] [PubMed] [Google Scholar]


