

Abstract
The aim of the present study was to evaluate the changes in periimplant bone quality, crestal bone level and the implant stability (periotest) for mandibular implant retained overdentures with ball attachments using delayed and immediate loading protocols. Ten completely edentulous patients had two alpha bio dental implants placed in the anterior part of the mandible. The loading protocols for the patients was chosen randomly by drawing lots. Five patients were loaded under immediate loading protocols and other five following delayed. Crestal bone loss and bone quality were assessed around each implant. Periotest values were recorded for each implant at 3, 6 and 12 months after loading. Two implants were lost and were excluded from the study. However mean crestal bone loss around implants was 0.81 mm from the time of prosthetic loading to 12 months after prosthetic loading was seen and no significant result was found between the two groups for the crestal bone loss and the periotest values. Though the periotest value decreased (indicates increased stability) over the time period. The bone density changes were significant for both the groups at coronal level at all time intervals but at middle level significant only after 12 months of prosthetic loading, although individual variation was high. This study concluded that the changes in crestal bone level and periotest values were insignificant for the two groups. But the implant stability increased over the time and the crestal bone loss was evident with decreased rate over the period of time. There was wide individual variation for the bone density changes but overall increase in the density was seen.
Keywords: Overdenture, Crestal bone, Implant stability, Periotest
Introduction
Rehabilitation of the completely edentulous mandible using implants to retain a fixed prosthesis is a predictable long-term treatment modality. High implant success rates have also been achieved using 2 or more implants to anchor an overdenture. Two implant-retained overdentures with separated implants have been reported with similar implant success rates (97–100 %) and functional improvement [1].
In case of completely edentulous arches, the residual ridge provides support to the complete denture and implant retained overdenture. Success of implant retained overdenture depends upon osseointegration and stability of implants. Bone quantity and quality are the two main prerequisite that influence successful osseointegration [2]. Bone quality and quantity both are determining factor not only in diagnosis, treatment planning, surgical approach, healing time but also in initial progressive loading during prosthetic construction.
Implant stability which can occur at two different stages: primary and secondary. Primary stability of an implant comes from mechanical engagement with cortical bone. Secondary stability, on the other hand offers biological stability through bone regeneration and remodelling. Degree of implant stability may also depend on the condition of the surrounding tissues. Primary stability and absence of micromovement are considered fundamental prerequisites for the osseointegration of endosseous implants [3], for this reason three to six months of healing period before loading was usually recommended. However, this healing period was empirically based and not experimentally ascertained. It is therefore justifiable to question whether this healing period is an absolute prerequisite to obtain osseointegration, or if under certain circumstances this period can be shortened without jeopardizing osseointegration and long term results.
This study was conducted to evaluate amount of crestal bone loss and changes in bone density around the implants in time intervals of 3, 6 and 12 months in implant retained overdentures through dentascan and implant stability through periotest and the results were compared between the immediately loaded and delayed loaded groups.
Materials and Methods
Ten edentulous patients of age group 45–70 years were selected to participate in within subject crossover clinical trial in Department of Prosthodontics, KD Dental College, Mathura. In this study 20 implants were placed to retain mandibular implant overdenture. The basic inclusion criteria was the edentulous patients with edentulism not less than 4 months and were not satisfied with the retention of mandibular prosthesis. At the inception, all the patients underwent an initial examination, including recording of their medical and dental histories and evaluation of their existing dentures. A presurgical dentascan was taken with the radiographic stent [4] in the patients mouth and the information from the dentascan was assessed for the placement of two implants in the interforaminal region according to standard technique. Out of 20 implants, 10 were loaded following delayed loading protocol and other 10 implants were placed following immediate loading protocol. The second dentascans were taken after the prosthetic loading and the data were assessed for bone quantity and quality. And the third, fourth and fifth dentascans were taken after a period of 3, 6 and 12 months of prosthetic loading to evaluate the changes in the crestal bone height and bone density in the patients. The patients were evaluated for implant stability by the use of periotest device after the initial healing period and 3, 6 and 12 months after the prosthetic loading (Figs. 1, 2, 3, 4, 5, 6, 7).
Fig. 1.

Preoperative dentascan with radiographic stent in patient’s mouth
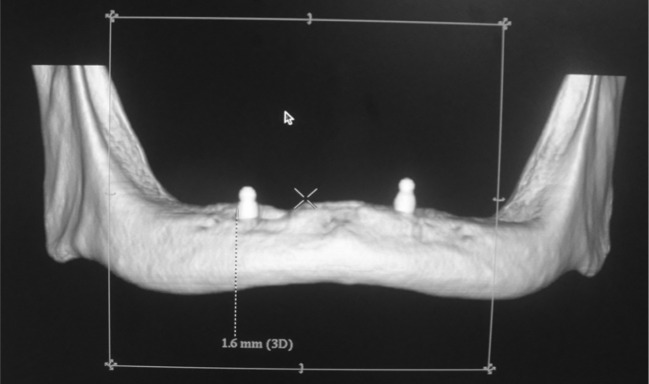
Fig. 2.

3D view of the presurgical dentascan
Fig. 3.
Radiographic stent
Fig. 4.
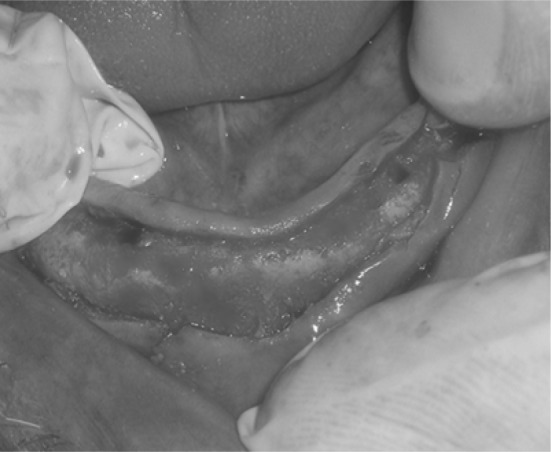
Osteotomy site prepared
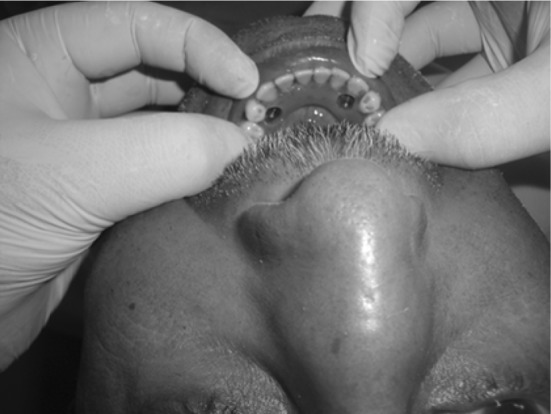
Fig. 5.
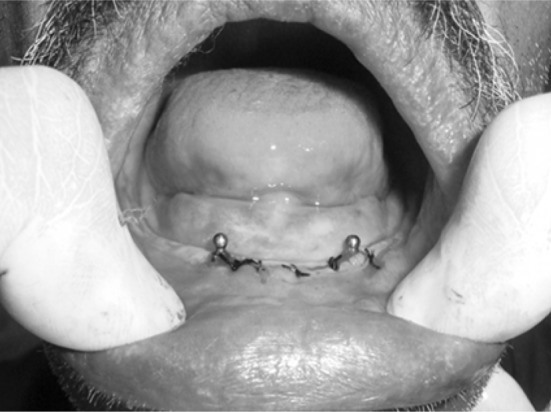
Implants placed
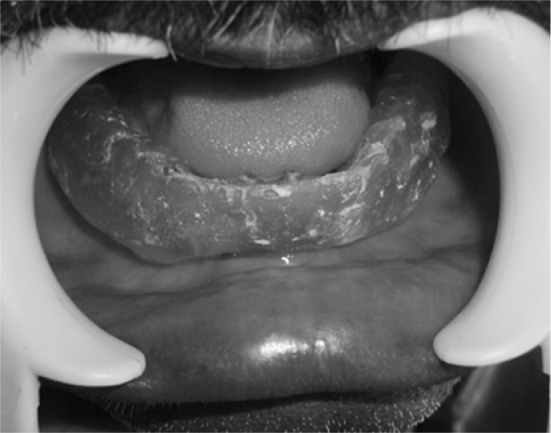
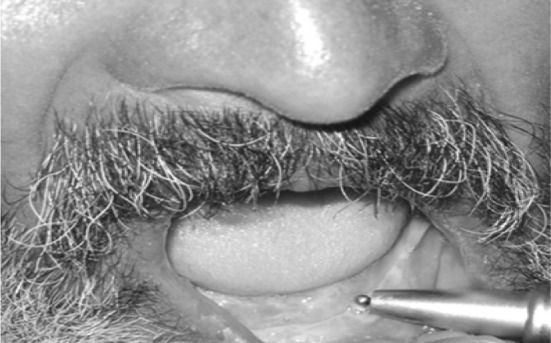
Fig. 6.
Denture relieved over the corresponding site
Fig. 7.
Data collection for bone quality
Data Collection
For Bone Quality
For each of the sites, an image representing a 1 mm buccolingual slice immediately mesial to the implant and an image representing a 1-mm buccolingual slice immediately distal to the implant were selected for analysis. Using the dentascan HOUNSEFIELD UNIT for each point was calculated of 1 mm all along the implant length.
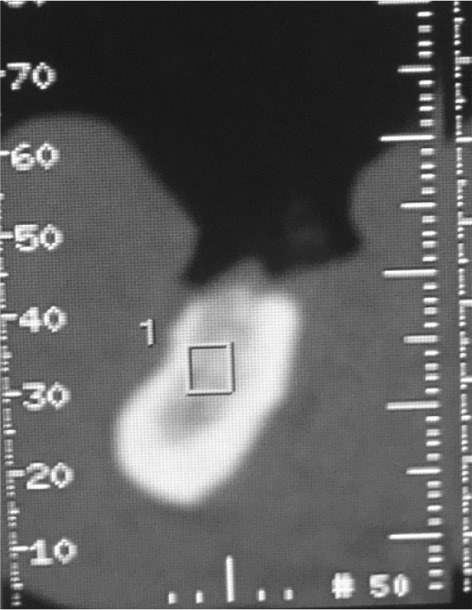
The bone density was also be quantitatively evaluated for slices at an equal interval along the entire length of the implant. A rectangular area mapped relative to the one-third size of the implant was placed over the image. Bone density readings were then obtained from three separate subdivisions of the rectangular area: a coronal third, a middle third, and an apical third. Within the 20 implant sites, between mesial and distal images, the various subdivisions of the rectangular implant areas were compared with respect to the bone density values [3] (Fig. 8).
Fig. 8.
Data collection for crestal bone height
For Crestal Bone Height
The distance between the observed crestal bone level and the implant shoulder was measured at 1-mm buccolingual slice—immediately mesial to the implant and an image representing a 1-mm buccolingual slice immediately distal to the implant (Fig. 9).
Fig. 9.
Implant stability checked using periotest
Implant Stability
The implant stability was checked using periotest. The periotest value for each implant was recorded and assessed for the implant stability.
Results
The peri-implant bone was studied for the changes in crestal bone height, bone density and implant stability (using periotest) at the various time intervals i.e., at the time of prosthetic loading, 3, 6 and 12 months after prosthetic loading. The patients were then divided into two groups the control group (delayed loading) and the test group (immediate loading).In the test group, 10 one-piece implants were placed, compared with 10 two-piece implants in the control group. One group II (immediate loading) participant was not available for follow-up because of implant failure and was therefore excluded.
Crestal Bone Height
Mean of Crestal Bone Loss
The mean of mesial bone loss from the time of prosthetic loading to 3 months after prosthetic loading was 0.44 mm, to 6 months after prosthetic loading was 0.64 mm and 12 months after prosthetic loading was 0.82 mm. The crestal bone changes after 6 and 12 months of prosthetic loading from the time of prosthetic loading were found to be statistically significant. The crestal bone level change from 3 months after prosthetic loading to 6 and 12 months after prosthetic loading was 0.20 and 0.38 mm, respectively and were statistically not significant. The mean change from 6 months after prosthetic loading to 12 months after prosthetic loading was 0.17 mm and found to be statistically not significant (Table 1). The mean of distal bone loss from the time of prosthetic loading to 3, 6 and 12 months after prosthetic loading was 0.51, 0.65 and 0.80 mm, respectively. The results were found to be statistically significant. The mean crestal bone level change from 3 months after prosthetic loading to 6 months after prosthetic loading was 0.14 mm and 12 months after prosthetic loading was 0.29 mm and were statistically not significant. The mean change from 6 months after prosthetic loading to 12 months after prosthetic loading was 0.15 mm and found to be statistically not significant (Table 1). The mean crestal bone loss was calculated from the baseline (at the time of prosthetic loading), from 3, 6 and 12 months after prosthetic loading. The mean loss of crestal bone height after 3 months of prosthetic loading from the baseline was 0.48 mm and at 6 months after prosthetic loading was 0.65 mm and 12 months after prosthetic loading was 0.81 mm. The changes were found to be statistically significant. The mean crestal bone loss from the 3 months after prosthetic loading to 6 months after prosthetic loading was 0.17 mm and not statistically significant and 12 months after prosthetic loading was 0.33 mm and was statistically significant. From 6 months of prosthetic loading to 12 months of prosthetic loading was 0.16 mm the changes were statistically not significant (Table 1).
Table 1.
Mesial, distal and mean crestal bone loss after 3, 6 and 12 months of prosthetic loading and there intergroup comparison (post hoc Tukey test)
| I − time | J − time | Sites | Mean difference (I − J) | Std. error | Sig. |
|---|---|---|---|---|---|
| At the time of prosthetic loading | 3 Months after prosthetic loading | Mesial | −0.44 | 0.15632 | 0.056 |
| Distal | −0.51 | 0.13553 | 0.005 | ||
| Mean | −0.48 | 0.10091 | 0.00 | ||
| 6 Months after prosthetic loading | Mesial | −0.64 | 0.15632 | 0.02 | |
| Distal | −0.65 | 0.13553 | 0.00 | ||
| Mean | −0.65 | 0.10091 | 0.00 | ||
| 12 Months after prosthetic loading | Mesial | −0.82 | 0.15632 | 0.00 | |
| Distal | −0.80 | 0.13553 | 0.00 | ||
| Mean | −0.81 | 0.10091 | 0.00 | ||
| 3 Months after prosthetic loading | 6 Months after prosthetic loading | Mesial | −0.21 | 0.15632 | 0.684 |
| Distal | −0.14 | 0.13553 | 0.842 | ||
| Mean | −0.17 | 0.10091 | 0.435 | ||
| 12 Months after prosthetic loading | Mesial | −0.38 | 0.15632 | 0.132 | |
| Distal | −0.29 | 0.13553 | 0.227 | ||
| Mean | −0.33 | 0.10091 | 0.012 | ||
| 6 Months after prosthetic loading | 12 Months after prosthetic loading | Mesial | −0.17 | 0.15632 | 0.805 |
| Distal | −0.15 | 0.13553 | 0.802 | ||
| Mean | −0.16 | 0.10091 | 0.504 |
Mean Crestal Bone Loss Compared Between the Two Groups (i.e., Delayed Loading Group and Immediate Loading Group)
The mean crestal bone loss was computed for the control group and the test group at 3 months after prosthetic loading, 6 months after prosthetic loading and 12 months after prosthetic loading. No statistically significant differences were found between the two groups. The results obtained were 0.52 ± 0.63 mm (control group) and 0.43 ± 0.65 mm (test group) after 3 months of prosthetic loading, 0.69 ± 0.05 mm (control group) and 0.6 ± 0.06 mm (test group) after 6 months of prosthetic loading and 0.85 ± 0.05 mm (control group) and 0.76 ± 0.10 mm (test group) after 12 months of prosthetic loading (Graph 1).
Graph 1.

The graph shows the mean crestal bone loss in mm (y-axis) at time intervals (x-axis) of 3, 6 and 12 months after prosthetic loading between control and test groups
Bone Density
Changes in Bone Density Over the Time Period
The mean bone density changes at the coronal level when compared from the time of prosthetic loading to the 3 months after prosthetic loading was 34.41 ± 23.48, 85.59 ± 43.73 HU at 6 months after prosthetic loading and 103.35 ± 47.30 HU at 12 months after prosthetic loading and was statistically significant. The bone density changes between the 3 months after prosthetic loading to 6 months after prosthetic loading was 51.18 ± 31.20 HU and 12 months after prosthetic loading was 68.94 ± 32.50 HU and found to be statistically significant. When the mean bone density was compared from 6 months after prosthetic loading to 12 months after prosthetic loading the change found was 17.76 ± 20.84 HU and was statistically significant. The mean bone density changes at the middle level when compared from the time of prosthetic loading to the 3 months after prosthetic loading was 19.29 ± 42.28, 52.27 ± 50.40 HU at 6 months after prosthetic loading and 63.75 ± 61.27 HU at 12 months after prosthetic loading and was statistically significant. The changes between the 3 months after prosthetic loading to 6 months after prosthetic loading was 32.97 ± 23.62 HU and 12 months after prosthetic loading were 44.46 ± 44.67 HU and found to be statistically significant. When the mean bone density was compared from 6 months after prosthetic loading to 12 months after prosthetic loading the change found was 11.48 ± 30.98 HU and was statistically significant. The mean bone density changes at the apical level when compared from the time of prosthetic loading to the 3 months after prosthetic loading was 7.19 ± 45.07, 36.58 ± 60.81 HU at 6 months after prosthetic loading and 37.46 ± 79.65 HU at 12 months after prosthetic loading. The values were statistically significant when compared to 6 and 12 months after prosthetic loading. The changes between the 3 months after prosthetic loading to 6 months after prosthetic loading was 29.39 ± 33.79 HU and 12 months after prosthetic loading was 30.26 ± 56.07 HU and was statistically significant. When the mean bone density was compared from 6 months after prosthetic loading to 12 months after prosthetic loading the change found was 0.87 ± 39.57 HU and was statistically insignificant (Graph 2).
Graph 2.

The graph shows the mean bone density changes in HU (y-axis) at coronal (blue), middle (red) and apical (green) at time intervals (x-axis) of 3, 6 and 12 months after prosthetic loading. (Color figure online)
Mean Bone Density Changes Compared Between Control Group (Delayed Loading Group) and Test Group (Immediate Loading Group)
The mean bone density change at the coronal level after 3 months of prosthetic loading for control group was 41.77 HU and test group was 25.22 HU. And statistically the results found to be significant. After 6 months of prosthetic loading the mean bone density for control group recorded was 101.35 HU and for test group was 65.90 HU. After 12 months of prosthetic loading the mean bone density for the control group was 117.58 HU and for test group was 85.57 HU. The results were statistically significant for both the time intervals. The bone density changes found to be statistically significant in delayed loading group than immediate loading group at the coronal level. The mean bone density after 3 months of prosthetic loading for control group was 31.45 HU and test group was 4.10 HU. And statistically the results found to be non significant. After 6 months of prosthetic loading the mean bone density for control group recorded was 66.43 and for test group was 34.57 HU. The results were statistically not significant. After 12 months of prosthetic loading the mean bone density for the control group was 81.97 HU and for test group was 40.98 HU. The results were statistically significant. The bone density changes were significant only after 12 months of prosthetic loading when compared between the two groups. The mean bone density change after 3 months of prosthetic loading for control group was 2.52 HU and test group was 13.03 HU. After 6 months of prosthetic loading the mean bone density for control group recorded was 34.12 HU and for test group was 39.66 HU. After 12 months of prosthetic loading the mean bone density for the control group was 38.49 HU and for test group was 36.17 HU. All the results were statistically not significant. Though increase in bone density was seen but not to significant level.
Implant Stability
Changes in Mean Periotest Value From the Time of Prosthetic Loading to 3, 6 and 12 Months After Prosthetic Loading
The mean periotest value for the implants at the time of prosthetic loading was −2.06, after 3 months of prosthetic loading was −2.50, 6 months after prosthetic loading was −2.72 and 12 months after prosthetic loading was −3.28. The results were statistically not significant when compared from the time of prosthetic loading to 3 months after prosthetic loading. The results were statistically significant from the time of prosthetic loading to 6 and 12 months after prosthetic loading (Graph 3).
Graph 3.

The graph shows the mean periotest values (y-axis) for the the patients at time intervals (x-axis)
Changes in Periotest Value Compared Between Control Group and Test Group
The periotest value was compared between the delayed and immediate loading groups. The mean periotest value at the time of prosthetic loading was −2.6 ± 1.84 and −1.38 ± 1.77 for the control and test group, respectively and after 12 months of prosthetic loading was −3.6 ± 1.78 and −2.88 ± 1.64 for the control and test group, respectively. And the results found were not statistically significant (Table 2).
Table 2.
Mean periotest values compared for the control group and test group at the time of prosthetic loading, 3, 6 and 12 months after prosthetic loading
| Time interval | Groups | Mean | Std. deviation | Std. error mean | T test | P value |
|---|---|---|---|---|---|---|
| At the time of prosthetic loading | Delayed loading | −2.60 | 1.84 | 0.58 | −1.43 | 0.82 |
| Immediate loading | −1.38 | 1.77 | 0.63 | |||
| 3 Months after prosthetic loading | Delayed loading | −2.80 | 1.87 | 0.59 | −0.80 | 0.65 |
| Immediate loading | −2.13 | 1.64 | 0.58 | |||
| 6 Months after prosthetic loading | Delayed loading | −3.20 | 1.62 | 0.51 | −1.28 | 0.48 |
| Immediate loading | −2.13 | 1.96 | 0.69 | |||
| 12 Months after prosthetic loading | Delayed loading | −3.60 | 1.78 | 0.56 | −0.89 | 0.95 |
| Immediate loading | −2.88 | 1.64 | 0.58 |
Discussion
The loss of teeth and eventual edentulism may constitute a severe handicap. Zarb and Schmitt [5] have presented a historical resume of the development of complete dentures from poorly fitting constructions of the last century to today’s more optimized ones. However, inspite of an undisputable improvement in denture quality with modern prosthodontic techniques, poor retention, especially of the lower denture, is still a great problem for many patients.
Branemarks’ seminal osseointegration research introduced a new era of prosthodontic therapy. Adequate stability of an implant in the surrounding bone is essential to allow undisturbed healing and bone formation to occur following placement and also to permit optimal stress distribution from masticatory and occlusal functional loads through the implant-tissue interface. The stability requirements for healing and function are rather different; primary stability is necessary at the time of implant placement, and secondary stability is needed following osseointegration, which occurs in function.
Primary stability and absence of micromovement are considered fundamental prerequisites for the osseointegration of endosseous implants [3]. Therefore, to avoid high stress/strain in the surrounding bone in the adaptation period, it has been advocated to apply progressive loading on oral implants. A slight load on healing bone shortens healing rather than prolong it. Strains in healing bone not exceeding mild overload might improve healing. Clinical studies [6] have shown that immediately loaded oral implants acting as support for a prosthesis can osseointegrate providing that the forces and implant micro-motion can be controlled [7].
Changes in Mean Crestal Height
The stiffness of oral implants of titanium or its alloys is several times greater than that of cortical bone. When an oral implant is occasionally loaded, the stress will be transferred to the bone, with the highest stress in the most coronal portion of the supporting bone. Therefore, an increased strain in the bone resulting in an overload would also be most likely to happen first in this area [7].
Some marginal bone loss around oral implants during the first year of function has been a common observation. Roe et al. [8] found the similar significant results in accordance to author when they compared eight completely edentulous patients (five men, three women) with a mean age of 69.1 years. Studies involving the bone loss in mandibular implant overdenture cases have reported peri-implant crestal bone level changes ranging from 0.19 to 2.38 mm at time interval of 12 months [9–12]
Periotest Value
The values obtained by the author is in accordance with the recordings of Payne et al. [13] which states that the periotest value became more negative with time period and similar results were found by Chiapasco et al. [14], Rungcharassaeng et al. [15], Payne et al. [13], and Naert et al. [10].
The periotest values were compared between the control (conventional loading group) and test group (immediate loading group). Payne et al. [13] found the periotest values at baseline were −3.84 (control group) versus −2.87 (test group). Mean PTV after 1 year was −4.9 (control) versus −3.78 (test). There was a trend of increasingly negative mean PTVs for all implants in both groups, without any significant differences between baseline and year 1. Chiapasco et al. [14] recorded the medians of periotest values in the test group were −4, −4, −4, −4.3 and control group −3, −4, −5 and −4.5 at the time of prosthetic loading and 6, 12 and 24 months after prosthetic loading, respectively. The results were statistically insignificant.
Bone Density
The changes in bone density as seen by the author is supported by the statement that “it has been shown that more dense bone surrounds mechanically loaded oral implants than non-loaded implants in monkeys. The strength of the bone increases from the beginning of loading after surgical exposure and up to 1 year after loading, both because the bone becomes more dense and because of an increase in mineral content” [7].
This increase in the mean bone density is also evident at the middle and apical level but when compared between the coronal, middle and apical level the mean bone density change is much more evident at the coronal level.
When it is compared between the two groups: conventional loading and immediate loading groups the bone density changes are significant when compared at the coronal level at all the time. At middle there were no significant changes after 3 and 6 months of prosthetic loading but the result was significant after 12 months of prosthetic loading. At apical level changes between the two groups were insignificant for all the time intervals. Thus, the changes at the coronal level were more pronounced than at the middle and the apical level.
Conclusions
The results obtained were compared statistically using SPSS software and following conclusions were made:
The mean crestal bone loss shows significant changes after 3, 6 and 12 months of prosthetic loading. Though the changes between 6 months after prosthetic loading and 12 months after prosthetic loading are not significant but crestal bone loss is still evident.
The periotest values become more negative with the time interval suggesting the increase in the implant stability with the time as the secondary stability is achieved with the bone modeling and remodeling.
There is increase in the bone density with the time period. And the changes are more pronounced at the coronal level than at middle level and very minimal increase in density is seen at apical level.
When compared between the delayed loading and immediate loading groups there was no significant difference between the crestal bone loss of the two groups.
The periotest values were compared between the two groups (delayed loading and immediate loading groups). The results were insignificant.
When compared between the two groups the results were significant for the mean bone density changes at the coronal level at 3, 6 and 12 months after prosthetic loading. At middle level the results were significant only after 12 months of prosthetic loading and at the apical level the changes were insignificant but increase in bone density was seen.
References
- 1.Liddelow GJ, Henry PJ. A prospective study of immediately loaded single implant-retained mandibular overdentures: preliminary one-year results. J Prosthet Dent. 2007;97(6 Suppl):S126–S137. doi: 10.1016/S0022-3913(07)60016-X. [DOI] [PubMed] [Google Scholar]
- 2.Atsumi M, Park SH, Wang HL. Methods used to assess implant stability : current status. Int J Oral Maxillofac Implants. 2007;22:743–754. [PubMed] [Google Scholar]
- 3.Meredith N. Assessment of implant stability as a prognostic determinant. Int J Prosthodont. 1998;11:491–501. [PubMed] [Google Scholar]
- 4.Lima V, Morgano SM. A dual purpose stent for the implant supported prosthesis. J Prosthet Dent. 1993;69:276–280. doi: 10.1016/0022-3913(93)90106-X. [DOI] [PubMed] [Google Scholar]
- 5.Zarb GA, Schmitt A. Implant prosthodontic treatment options for the edentulous patient. J Oral Rehabil. 1995;22:661–671. doi: 10.1111/j.1365-2842.1995.tb01064.x. [DOI] [PubMed] [Google Scholar]
- 6.Attard NJ, David LA, Zarb GA. Immediate loading of implants with mandibular overdentures: one-year clinical results of a prospective study. Int J Prosthodont. 2005;18:463–470. [PubMed] [Google Scholar]
- 7.Au-Yeung KM, Ahuja AT, Ching AS, Metreweli C. Dentascan in oral imaging. Clin Radiol. 2001;56:700–713. doi: 10.1053/crad.2001.0785. [DOI] [PubMed] [Google Scholar]
- 8.Roe P, et al. Immediate loading of unsplinted implants in the anterior mandible for overdentures: a case series. Int J Oral Maxillofac Implants. 2010;25:1028–1035. [PubMed] [Google Scholar]
- 9.Batenburg R, Meijer H, Raghoebar G, Vissink A. Treatment concept for mandibular overdentures supported by endosseous implants: a literature review. Int J Oral Maxillofac Implants. 1998;13:539–545. [PubMed] [Google Scholar]
- 10.Naert IE, Gizani S, Vuylsteke M, van Steenberghe D. A randomized clinical trial on the influence of splinted and unsplinted oral implants in mandibular overdenture therapy. A 3-year report. Clin Oral Investig. 1997;1:81–88. doi: 10.1007/s007840050016. [DOI] [PubMed] [Google Scholar]
- 11.Tawse-Smith A, Perio C, Payne AG, Kumara R, Thomson WM. Onestage operative procedure using two different implant systems: a prospective study on implant overdentures in the edentulous mandible. Clin Implant Dent Relat Res. 2001;3:185–193. doi: 10.1111/j.1708-8208.2001.tb00140.x. [DOI] [PubMed] [Google Scholar]
- 12.Heijdenrijk K, Raghoebar GM, Meijer HJA, van der Reijden WA, van Winkelhoff AJ, Stegenga B. Two stage IMZ implants and ITI implants inserted in a single-stage procedure. Clin Oral Implants Res. 2002;13:371–380. doi: 10.1034/j.1600-0501.2002.130405.x. [DOI] [PubMed] [Google Scholar]
- 13.Payne AGT, Tawse-Smith A, Duncan WD, Kumara R. Conventional and early loading of unsplinted ITI implants supporting mandibular overdentures. Clin Oral Implants Res. 2002;13:603–609. doi: 10.1034/j.1600-0501.2002.130605.x. [DOI] [PubMed] [Google Scholar]
- 14.Chiapasco M, Abati S, Romeo E, Vogel G. Implant retained mandibular overdentures with Branemark system MKII implants: a prospective comparative study between delayed and immediate loading. Int J Oral Maxillofac Implants. 2001;16:537–546. [PubMed] [Google Scholar]
- 15.Rungcharassaeng K, Lozada JL, Kan JYK, Kim JS, Campagni WV, Munoz CA. Peri-implant tissue response of immediately loaded, threaded, HA-coated implants: 1-year results. J Prosthet Dent. 2002;87:173–181. doi: 10.1067/mpr.2002.121111. [DOI] [PubMed] [Google Scholar]