Abstract
A central goal in ecology is to understand the factors affecting the temporal dynamics and spatial distribution of microorganisms and the underlying processes causing differences in community structure and composition. However, little is known in this respect for photosynthetic picoeukaryotes (PPEs), algae that are now recognised as major players in marine CO2 fixation. Here, we analysed dot blot hybridisation and cloning–sequencing data, using the plastid-encoded 16S rRNA gene, from seven research cruises that encompassed all four ocean biomes. We provide insights into global abundance, α- and β-diversity distribution and the environmental factors shaping PPE community structure and composition. At the class level, the most commonly encountered PPEs were Prymnesiophyceae and Chrysophyceae. These taxa displayed complementary distribution patterns, with peak abundances of Prymnesiophyceae and Chrysophyceae in waters of high (25:1) or low (12:1) nitrogen:phosphorus (N:P) ratio, respectively. Significant differences in phylogenetic composition of PPEs were demonstrated for higher taxonomic levels between ocean basins, using Unifrac analyses of clone library sequence data. Differences in composition were generally greater between basins (interbasins) than within a basin (intrabasin). These differences were primarily linked to taxonomic variation in the composition of Prymnesiophyceae and Prasinophyceae whereas Chrysophyceae were phylogenetically similar in all libraries. These data provide better knowledge of PPE community structure across the world ocean and are crucial in assessing their evolution and contribution to CO2 fixation, especially in the context of global climate change.
Keywords: photosynthetic picoeukaryotes, community structure, prymnesiophytes, chrysophytes, global scale
Introduction
Understanding the mechanisms that generate and maintain biodiversity, and more particularly the spatial distributions of taxa, is a key objective in ecology. This is essential to predicting ecosystem responses to future environmental change. However, most of our knowledge about how biodiversity varies across large spatial scales comes from research on macroorganism biogeography, with only relatively few recent studies for microorganisms (for example, see Foissner, 2006; Fuhrman et al., 2008; Caron, 2009; Nolte et al., 2010). Opposing views have claimed that, on one hand, free-living microbial taxa present a cosmopolitan distribution (Finlay and Fenchel, 2004, Finlay et al., 2006; Pither, 2007), with particular implications for organisms in the smallest size classes (for example, <0.5 μm; Yang et al., 2010), and, on the other, are composed primarily of species that have limited geographical distributions (Papke and Ward, 2004; Telford et al., 2006; Härnström et al., 2011).
During the past decade, molecular techniques have begun to provide insights into the structure of small (<3 μm diameter), unicellular photosynthetic picoeukaryote (PPE) communities in various marine environments (reviewed by Vaulot et al., 2008). In particular, cloning and sequencing of both nuclear (for example, see Moon van der Staay et al., 2001; Not et al., 2008) and plastid (for example, see Fuller et al., 2006b; MacDonald et al., 2007; Lepère et al., 2009) small subunit rRNA genes have revealed a vast, previously unsuspected diversity within this assemblage. This focus is largely because of the increased recognition of PPEs as key contributors to phytoplankton biomass and primary production across various marine pelagic ecosystems (Li, 1994; Worden et al., 2004; Richardson and Jackson, 2007; Cuvelier et al., 2010; Jardillier et al., 2010; Grob et al., 2011). Moreover, PPEs have recently been shown to be key bacterivores controlling bacterioplankton abundance in both temperate (Zubkov and Tarran, 2008) and oligotrophic gyre (Hartmann et al., 2012) waters. Furthermore, oceanic nitrogen:phosphorus (N:P) ratios are likely to be governed by plankton biogeography because of the varying nutrient metabolism of different groups (Weber and Deutsch, 2010). Thus, defining the abundance and understanding the diversity and global distribution of natural PPE populations is important for elucidating how specific PPE classes, with potentially different mixotrophy versus autotrophy capability, are linked to various physical and chemical parameters.
In the present study, abundances, α-diversity (richness) and β-diversity (composition) of PPEs were assessed at a global scale (seven research cruises and four major ocean biomes) by different molecular methods, targeting the gene encoding the plastid 16S rRNA.
Materials and methods
Cruises
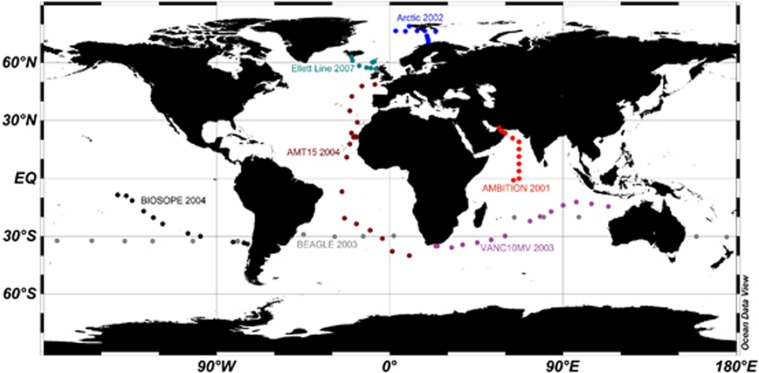
We analysed seven cruises, which took place between 2001 and 2007. The cruise tracks are depicted in Figure 1 with additional information (dates, geographic region and sampling points) summarised in Table 1. The cruise transects encompass (1) all four major ocean biomes (Longhurst, 2007): polar, westerly winds, trade winds and coastal boundary domains; (2) various temperature zones: arctic, temperate, subtropical and tropical; and (3) distinct oceanic regimes (as defined by nutrient status): gyres, upwelling, equatorial and coastal regions.
Figure 1.
Schematic representation of the cruise tracks analysed in this study.
Table 1. Details of cruises analysed in this study.
| Cruise | Date | Geographic region | Latitude/longitude | Sampling | Reference |
|---|---|---|---|---|---|
| AMBITION | 03/09/01 to 27/09/01 | Arabian Sea | 1°S–26°N, 56–67°E | 11 stations, 6 depths | Fuller et al. (2006a) |
| AMT15 | 19/09/04 to 26/10/04 | Atlantic Meridional Transect | 48°N–40°S, 25°W–10°E | 21 stations, 6 depths | Kirkham et al. (2011a) |
| ARCTIC | 24/08/02 to 31/08/02 | Arctic Ocean | 70–79°N, 3–23°E | 11 stations, 5 depths | Not et al. (2005) and this study |
| ELLETT | 25/08/07 to 04/09/07 | Northern North Atlantic | 63–57°N, 20–7°W | 9 Stations, 5–6 depths | Kirkham et al. (2011b) |
| BEAGLE | 08/07/03 to 13/01/04 | Circumnavigation of the Southern Hemisphere | 20–32°S | 15 Stations (surface only) | Bouman et al. (2006) and this study |
| BIOSOPE | 27/10/04 to 06/12/04 | Eastern South Pacific Ocean | 8–34°S, 141–72°W | 11 Stations 6 depths | Lepère et al. (2009) |
| VANC10MV | 16/05/03 to 11/06/03 | Indian Ocean | 35–43°S, 24–113°E | 15 stations, 6 depths | Not et al. (2008) and this study |
Sampling
Sampling procedures and nutrient analyses for the ARCTIC, VANC10MV and BEAGLE cruises (Figure 1 and Table 1) can be found in Not et al. (2005 and Bouman et al. (2006). In brief, samples analysed from the Arctic Ocean cruise were collected at six depths from the surface of the water column to ∼60 m deep in August 2002. Indian Ocean samples were collected from the upper 800 m on the VANC10MV cruise during May–June 2003 between Cape Town (South Africa) and Port Hedland (Australia), passing through the south central Indian Ocean Gyre. The BEAGLE cruise circumnavigated the Southern Ocean between 20°S and 32.5°S, and sampled only at the surface of the water column. Because of the small amount of material collected on the BEAGLE cruise, cells collected from three alternate stations were combined for DNA extraction in order to provide enough material for analysis. Environmental samples were taken with a rosette equipped with Niskin bottles. For DNA extraction, 10 l of sea water was filtered first through a 47 mm diameter, 3 μm pore size polycarbonate filter (Millipore, Billerica, MA, USA) and then onto a 47 mm diameter, 0.45 μm pore size polysulfone filter (Supor450, Gelman Sciences, Ann Arbor, MI, USA) under gentle vacuum (10 mm Hg). The filters were transferred into 5 ml cryotubes containing 3 ml of DNA lysis buffer (0.75 ℳ sucrose, 400 mℳ NaCl, 20 mℳ EDTA and 50 mℳ Tris, pH 9.0), flash-frozen in liquid nitrogen and stored at −80 °C. DNA was subsequently extracted from the filters as described previously (Fuller et al., 2003). Sampling details for the other cruises included in the meta-analysis can be found in Fuller et al. (2006a), Lepère et al. (2009) and Kirkham et al. (2011a, 2011b). We also include sequencing data from a time series taken from the Gulf of Naples, Mediterranean Sea (see McDonald et al., 2007). Environmental parameters measured for each cruise/station can be found in Supplementary Table 1.
Flow cytometric analysis
PPEs, Prochlorococcus and Synechococcus were enumerated by flow cytometry (FACSort, Becton Dickinson, Oxford, UK) using their characteristic pigment autofluorescence and size. The flow rate was calculated by adding a known concentration of 0.5 mm multi-fluorescent latex beads (Polysciences, Eppelheim, Germany) as an internal standard. Flow cytometry data were processed using CellQuest software (Becton Dickinson).
PCR conditions
PCR amplification of the 16S rRNA gene from environmental and control DNA samples for dot blot hybridisation and/or clone library construction were performed as described in Kirkham et al. (2011a) using the algal plastid biased primer PLA491F (Fuller et al., 2006b) coupled with the general oxygenic phototroph primer OXY1313R (West et al., 2001) to give an ∼830 bp PCR product.
Dot blot hybridisation analysis
16S rDNA amplicons from environmental DNAs and control strains were purified, blotted onto nylon membranes and hybridised to algal class-specific oligonucleotide probes, following the method of Fuller et al. (2003). The oligonucleotide probes used for all cruises were: CHLA768, CHRY1037, CRYP862, EUST985, PAVL665, PELA1035, PING1024, PRAS826, PRYM666 and TREB708 targeting the plastids of Chlorarachniophyceae, Chrysophyceae, Cryptophyceae, Eustigmatophyceae, Pavlovophyceae, Pelagophyceae, Pinguiophyceae, Prasinophyceae clade VI (Prasinococcales), Prymnesiophyceae and Trebouxiophyceae, respectively (Fuller et al., 2006a, 2006b). Algal cultures used as controls were the same as those used by Fuller et al. (2006a) and were obtained from the Roscoff Culture Collection (RCC, http://www.sb-roscoff.fr/Phyto/RCC/) and the Provasoli-Guillard National Center for Marine Algae and Microbiota (NCMA, formerly the CCMP, https://ncma.bigelow.org/). Final wash (or dissociation) temperatures (Td) for each probe were determined empirically (Fuller et al., 2006b), following a previously described method (Fuller et al., 2003). Hybridisation was quantified by using a Fujifilm FLA-5000 phosphorimager and Total Laboratory software (Phoretix, Newcastle, UK). The relative hybridisation of a given specific probe compared with that of the eubacterial probe to the control DNAs was averaged where more than one control DNA was used. Any sample giving a signal above 2% was considered above background.
Construction of clone libraries
PCR products were cloned into the TA vector pCR2.1-TOPO (Invitrogen, Paisley, UK) and screened by restriction fragment length polymorphism after digestion with HaeIII and EcoRI as described previously (Kirkham et al., 2011a).
Data analysis
Plastid 16S rRNA gene sequences obtained from the Arctic Ocean library have been deposited in Genbank under accession numbers GQ863885–GQ863899. Sequence accession numbers for the AMBITION (Arabian Sea), BIOSOPE (Pacific Ocean), AMT (Atlantic Ocean), Mediterranean Sea and Ellett Line (North Atlantic Ocean) can be found in Fuller et al. (2006a, 2006b), McDonald et al. (2007), Lepère et al. (2009); Shi et al. (2011), Kirkham et al. (2011a) and Kirkham et al. (2011b), respectively.
The Margalef index (Hill et al., 2003) was used for quantifying the richness (α-diversity) of PPEs as, for some libraries, we lacked data for the abundance of clones associated with each operational taxonomic unit, required for the use of other types of indices. Plastid 16S rRNA gene sequences obtained from cloning–sequencing were aligned and phylogenetic trees (neighbour-joining algorithm with Jukes–Cantor correction) were produced using ARB (Ludwig et al., 2004). The resulting trees were used in Unifrac analysis (http://bmf2.colorado.edu/unifrac/index.psp; Lozupone and Knight, 2005) to compare β-diversity between libraries.
To explore relationships between environmental parameters and the distribution of PPEs measured by hybridisation of class-specific oligonucleotide probes, canonical correspondence analysis (CCA) was used (Ter Braak, 1986). Variables included chlorophyll a, concentrations of phosphate, nitrate and nitrite (measured together), salinity, depth, mixed layer depth, latitude, temperature and season. For each sample, two values were assigned for season. One (Spring) was based on the length of time from the autumn equinox and the second (Summer) on the length of time from the winter solstice. This allowed season to be treated as a continuous variable and made account of the hemisphere from which the sample was collected. The CCA (http://cran.r-project.org/) analysis identifies the linear combinations of class abundance variables explaining the most variation among the samples, constrained to be maximally related to weighted linear combinations of the environmental variables (Legendre and Legendre, 1998). Thus, the fitted analysis model identifies the strongest associations between class abundance and environmental variables. CCA plots were drawn using R software with biplot values of the environmental variables and eigenvalue weighted eigenvectors of dot blot hybridisation data. Associations between classes (from the dot blot hybridisation data) and each environmental variable can be identified by considering the orthogonal projections from each class mean point on the CCA plot onto the appropriate environmental variable vector (Legendre and Legendre, 1998). Pairwise two-sided Spearman correlation coefficients were calculated using R software using the Agricolae package to provide further support for the associations identified from the CCA plots.
Results and discussion
Marine PPE abundance over large spatial scales
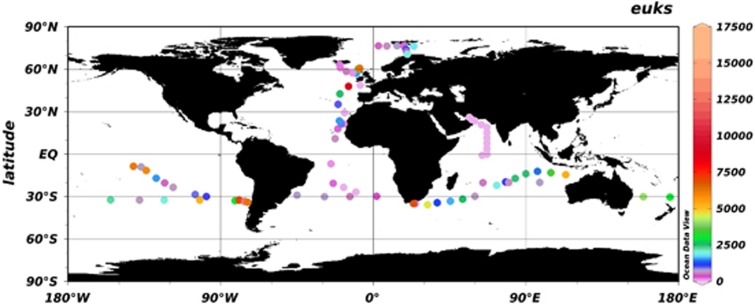
PPEs were enumerated by flow cytometry across all transects (Figure 2 and Supplementary Table 1). The highest PPE abundances were found in the cool (12–15 °C), high chlorophyll a surface (0–10 m) waters in the northern Atlantic Ocean and Arctic Ocean, with a peak of 3.9 × 10⁴ cells per ml encountered in the Rockall trough of the extended Ellett Line transect (Figure 2 and Supplementary Table 1). The lowest abundances were found in the Arabian Sea transect (mean over the transect 8.2 × 10² cells per ml), being below detection limits for much of the transect. PPE densities dropped from the surface to the DCM for all transects. Lowest densities were found in oceanic gyres (with an average of 9.2 × 10² cells per ml for all of the gyre stations sampled) but with higher densities at the more nutrient-rich stations, as described previously (Worden and Not, 2008). Prochlorococcus was the dominant phototroph in oligotrophic regions of all the transects. Although PPEs are generally less abundant than picocyanobacteria, they represent the most abundant group in stations sampled north of 74°N in the Arctic cruise as well as in stations in the easternmost part of the Indian Ocean cruise. These findings support the belief that PPEs play a significant role in the primary production of polar ecosystems, replacing their cyanobacterial counterparts, which numerically dominate at lower latitudes (see, for example, Zubkov et al., 2003). Although there is a general trend in the PPE/total picophytoplankton (that is, PPEs+picocyanobacteria) ratio increasing systematically with increasing latitude and decreasing temperature (Bouman et al., 2012), a considerable amount of variability is observed across the range of latitudes and temperatures. It is important to remember that even at very low cell abundances, PPEs are now known to contribute significantly to marine primary production because of a multifactorial effect of greater biovolume, higher growth rates and high grazing mortality rates (Li, 1994; Worden et al., 2004; Jardillier et al., 2010; Grob et al., 2011).
Figure 2.
Global distribution patterns of PPE abundances, at all depths sampled, determined by flow cytometry.
PPE α-diversity
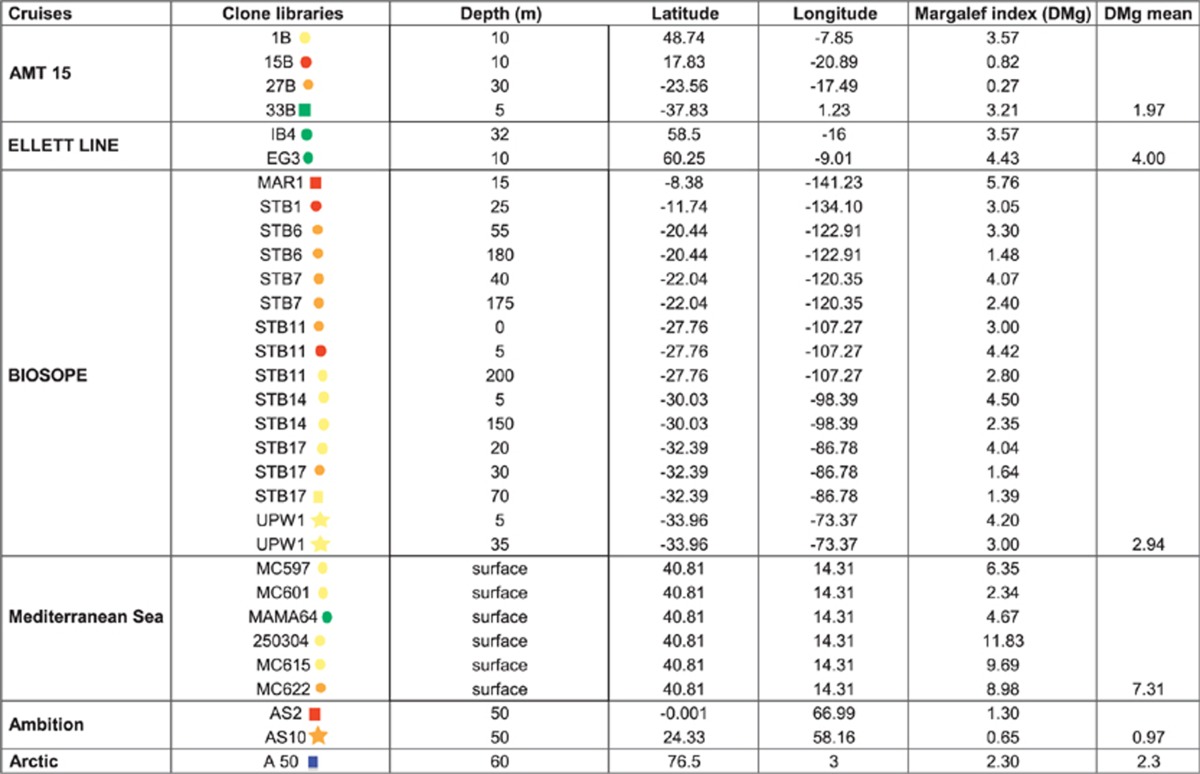
Clone sequence data of the 16S rDNA from all the transects studied here (except the BEAGLE and Indian Ocean transects) representing 31 clone libraries allowed us to calculate species richness values (α-diversity) using the Margalef index (Dmg) (Table 2). A relatively high variation in this index was seen between sites (Table 2) with, on average, samples taken from the Gulf of Naples, Mediterranean Sea, showing the highest diversity (Dmg=7.3). This high richness was positively correlated with temperature (r=0.84, P<0.05) and low nutrient concentrations (r=0.71, P<0.05), that is, oligotrophic stations over the time series. Conversely, the lowest richness was observed along the Arabian Sea and Atlantic Ocean transects (average Dmg=0.97 and 1.97, respectively) and seems to coincide with low PPE abundances. On the BIOSOPE transect (the only cruise where different depths were analysed for α-diversity), PPE species richness decreased with depth. Similar conclusions were made by Schnetzer et al. (2011), but for total microbial eukaryote diversity (again using environmental gene libraries), with depth negatively influencing species richness in the eastern North Pacific.
Table 2. Photosynthetic picoeukaryote (PPE) α-diversity calculated using the Margalef index (DMg).
PPE β-diversity
Global PPE class distributions
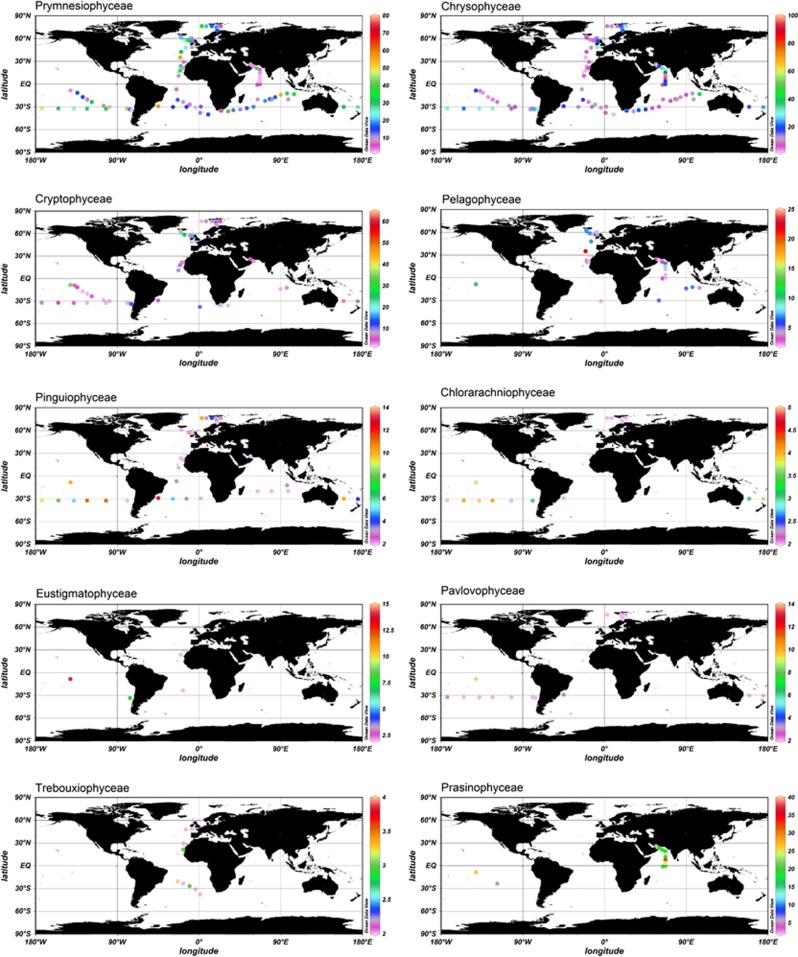
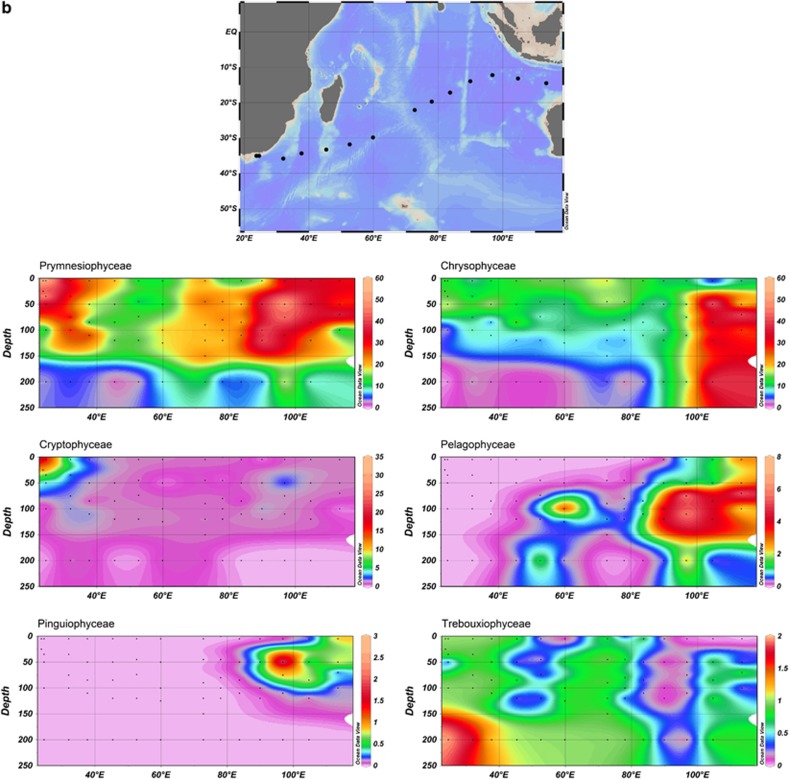
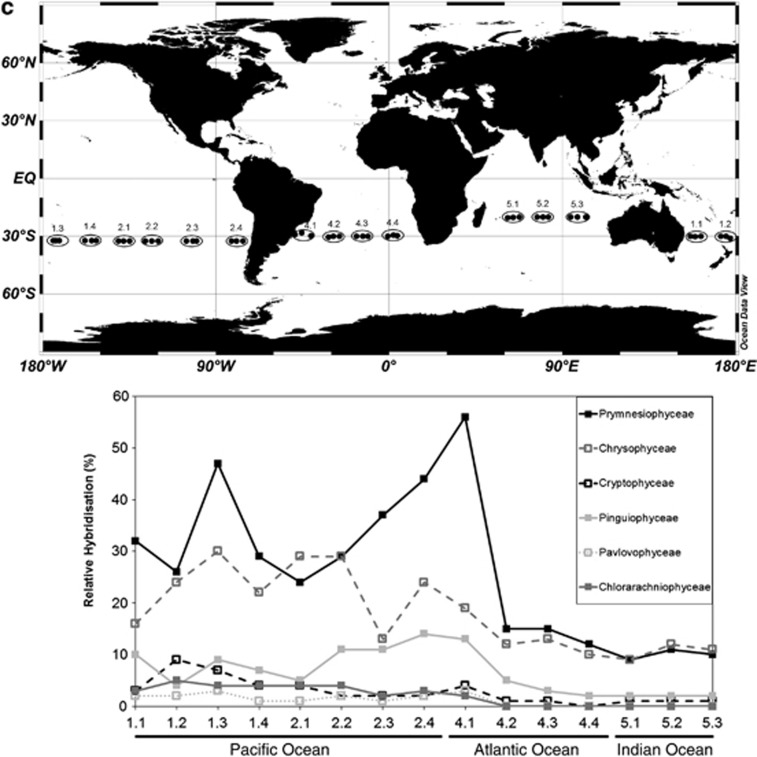
Plastid 16S rRNA oligonucleotide probes used for dot blot hybridisation analysis revealed specific global distribution patterns for each PPE class detected (Figure 3). The classes Prymnesiophyceae and Chrysophyceae were globally important across the range of ocean environments analysed (Figures 3 and 4). These classes were detected in every sample analysed and on average comprise 78% of the total relative hybridisation values obtained with the 10 PPE class-specific probes used over all 7 transects. Interestingly, these two classes have complementary distribution patterns across several transects (AMT, BIOSOPE, ARCTIC and AMBITION). The high Prymnesiophyceae signal detected across all ocean basins (Supplementary Table 3) supports the observation that 19′-hexanoyloxyfucoxanthin, a prymnesiophyte-specific pigment (though also present in a few other Heterokont algae, see Andersen, 2004), often dominates oceanic pigment analyses (Not et al., 2008; Liu et al., 2009). Recent fluorescent in situ hybridisation studies confirm the high abundance of these pico-prymnesiophytes in the Atlantic Ocean (Jardillier et al., 2010; Grob et al., 2011; Kirkham et al., 2011b), Indian Ocean (Not et al., 2008) and in open ocean regions of the Arctic Ocean (Not et al., 2005). However, Prymnesiophyceae have been consistently underestimated in previous amplification-based studies using primers targeting the nuclear 18S rRNA gene, potentially a result of PCR bias (Liu et al., 2009). In contrast, genetic surveys targeting the plastid 16S rRNA gene have shown a high diversity of this group in both open ocean (Lepère et al., 2009; Kirkham et al., 2011a, 2011b) and coastal waters (McDonald et al., 2007). Together, these data suggest large global distributions of pico-sized prymnesiophytes, which contribute significantly to marine primary production (Cuvelier et al., 2010; Jardillier et al., 2010) even though they mostly lack cultured representatives. The success of these organisms could be because of mixotrophic behaviour (that is, an ability to supplement their phototrophic physiology by preying on bacterioplankton). Indeed, recent evidence from natural environments suggests that PPEs can contribute greatly to bacterivory (Zubkov and Tarran, 2008; Sanders and Gast, 2011; Hartmann et al., 2012). The nutritional flexibility offered by mixotrophy gives a significant competitive advantage over both purely phototrophic and aplastidic cells under different light (depth) and nutrient regimes.
Figure 3.
Global distribution patterns of specific PPE classes, at all depths sampled, as determined by dot blot hybridisation analysis.
Figure 4.
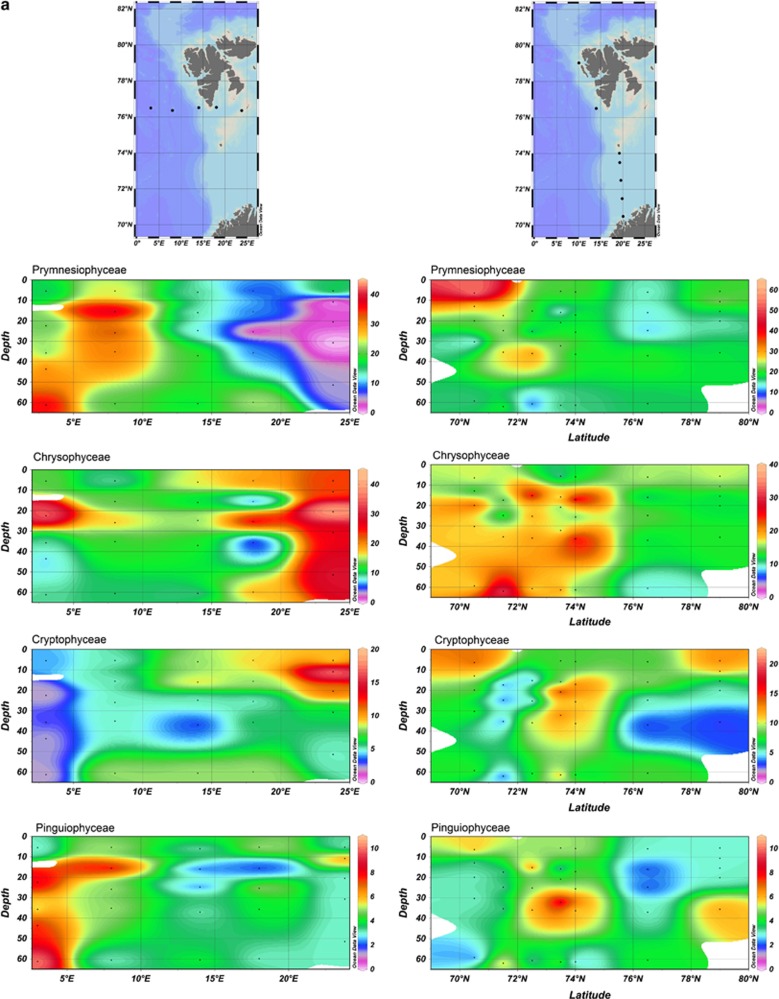
Dot blot hybridisation data showing the distribution of specific PPE classes along (a) the Arctic Ocean transect, plotted by longitude (left) and latitude (right), (b) along the Indian Ocean transect and (c) along the BEAGLE transect, encompassing samples taken in surface waters of the Pacific Ocean, Atlantic Ocean and Indian Ocean. The three dots in red circle correspond to three CTDs from where DNA was pooled. Contour plots (a, b) indicate the percent relative hybridisation (as a proportion of all products amplified by primers PLA491F and OXY1313R). The y-axes plot the depth (m) down each water column, and the x-axes plot the distance along the cruise by longitude (left) and latitude (right). Black dots represent sampling points.
Relative hybridisation values for Chrysophyceae (average 15.1% relative hybridisation across all cruises) were almost as high as those of Prymnesiophyceae (Supplementary Table 3) with peak values of 39% relative hybridisation at the westerly most station (Z59) sampled in the Arctic Ocean and 49% relative hybridisation at the eastern end of the Indian Ocean transect. Interestingly, Chrysophyceae signals were detectable to the bottom of the water column sampled (between 0 and 800 m according to the cruise), whereas most other PPEs classes were not detected below 150 m. The exception was the Trebouxiophyceae class that at some stations in the Indian Ocean was found down to 200 m (outside the gyre) and 800 m (inside the gyre). The presence of Chrysophyceae and Trebouxiophyceae in these deep waters well below the photic zone might be explained by their mixotrophic growth potential (the advantages of which were explained above).
Cryptophyceae were frequently observed in surface coastal waters of the Pacific and Atlantic Oceans. However, relative hybridisation values rarely exceeded 10% (Figure 3). Their low abundance in open ocean waters has also been observed using fluorescent in situ hybridisation analysis (for example, 1–3% of phototrophic cells in the Indian Ocean (Not et al., 2008) and <1% in the northern North Atlantic (Kirkham et al., 2011b)) and by 18S and 16S rRNA gene sequencing (Not et al., 2008; Lepère et al., 2009; Shi et al., 2009; Kirkham et al., 2011a). This class appears to be mostly restricted to coastal waters (see, for example, Romari and Vaulot, 2004). Moreover, cultured cryptophytes are generally larger than 5 μm, although some groups have been documented within the small fraction (Vaulot et al., 2008). Members of the Pinguiophyceae were fairly widespread, reaching relative hybridisation values of ≥2% in at least one sample of every cruise analysed except the Arabian Sea, and reaching up to 8% relative hybridisation in mesotrophic waters of the Pacific Ocean and the four easternmost stations of the Indian Ocean transect. They were also fairly well represented in the western part of the Arctic Ocean transect (Figure 4a).
Pelagophyceae, Pavlovophyceae, Eustigmatophyceae, Chlorarachniophyceae, Trebouxiophyceae and Prasinophyceae clade VI were only detected sporadically (Figure 3). Curiously, despite being readily cultured (Le Gall et al., 2008), Pelagophyceae were not detected in over 80% of the samples analysed, including the entire Arctic Ocean and BEAGLE cruises. This may be because of PCR bias given that Shi et al. (2011) showed the presence of many sequences related to Pelagophyceae using a different plastid 16S rRNA gene primer set on samples from the Pacific Ocean. Moreover, Not et al. (2008) found that pelagophytes contributed up to 40% of photosynthetic pigments in the Indian Ocean, whereas Jardillier et al. (2010) reported that PPEs of size 1.8±0.1 μm comprised 14–57% Pelagophyceae via fluorescent in situ hybridisation analysis across a range of samples in the subtropical North Atlantic.
PPE class distributions: relationships to environmental variables
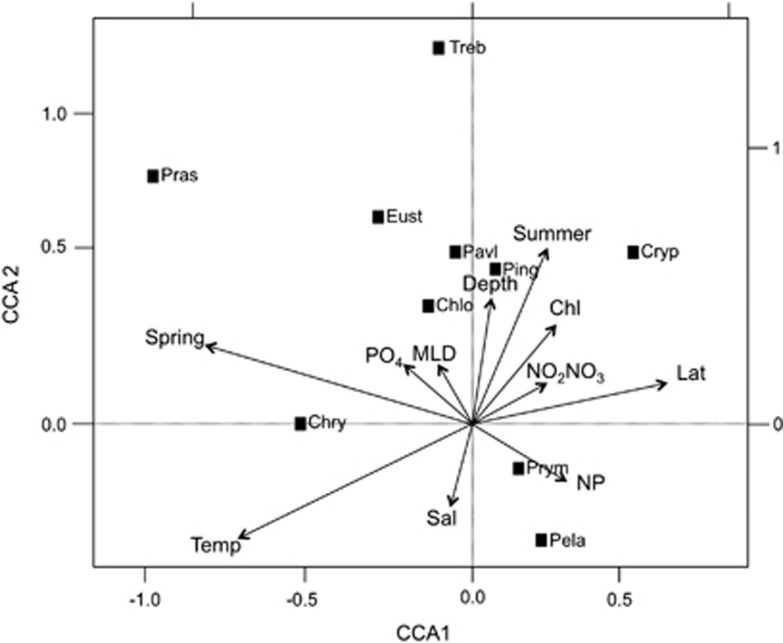
CCA was performed on each cruise separately, revealing associations between PPE class distributions and physicochemical environmental parameters (see Supplementary Figure 1) as well as previously published cruise transects (Lepère et al., 2009; Kirkham et al., 2011a, 2011b). In these separate CCA analyses, the percent change in composition explained by the measured environmental variables was on average 50%. CCAs were also performed for the global data set (n=239), excluding the Indian Ocean cruise and the Gulf of Naples time series for which few chemical parameter measurements were available (Figure 5). Data for 11 environmental parameters were obtained for all the other cruises (Supplementary Table 1), comprising season (spring=length of time from autumn equinox; and summer=length of time from winter solstice), chlorophyll a, phosphate (PO4), nitrate+nitrite concentration (NO3+NO2), nitrate+nitrite:phosphate ratio, salinity, depth, mixed layer depth, latitude and temperature. Only 20.6% of the total variation in dot blot hybridisation values could be explained by the measured environmental parameters. This is likely to be due, in part, to the very large degree of variation observed over such a large-scale study, and the comparatively small number of variables for which data had been collected for all the cruises. Furthermore, the lack of resolution beyond the class level is also likely to have contributed to the large proportion of variation in dot blot hybridisation data that was unexplained by the CCA.
Figure 5.
Canonical correspondence analysis plot using relative hybridisation values (%) detected for all cruises except the Indian Ocean transect. PPE classes are as follows: Prymnesiophyceae (Prym), Chrysophyceae (Chry), Cryptophyceae (Cryp), Pinguiophyceae (Ping), Pelagophyceae (Pela), Eustigmatophyceae (Eust) and Trebouxiophyceae (Treb). Variables are season: length of time from autumn equinox (Spring), season: length of time from winter solstice (Summer), chlorophyll a (Chl), phosphate (PO4), nitrate+nitrite concentration (NO2NO3), nitrate+nitrite:phosphate ratio (NP), salinity (Sal), depth (Depth), mixed layer depth (MLD), latitude (Lat) and temperature (Temp). The x-axis explains 9.3% and the y-axis explains 3.8% of the variation in dot blot hybridisation data.
Interestingly, the observed complementary distribution of Prymnesiophyceae and Chrysophyceae (Figure 4; Kirkham et al., 2011a) is confirmed by the CCA plot where the two classes are mirrored (Figure 5). Based on the orthogonal projections from the class coordinates on the first two canonical axes from the overall CCA (Figure 5), higher abundance of Chrysophyceae is associated with samples collected in early spring (more positive values on the ‘spring' vector), lower latitudes (more negative values on the latitude vector), higher temperatures, lower N:P ratios and higher PO4 concentrations. Conversely, higher abundance of Prymnesiophyceae is associated with samples taken later in the year, at higher latitudes, higher NO3+NO2 concentrations and higher N:P ratios. Based on the orthogonal projections that can be inferred from Figure 5, Pelagophyceae, Prymnesiophyceae and Cryptophyceae are associated with samples collected in the late autumn, with low concentrations of PO4 and higher N:P ratios. In contrast, Prasinophyceae, Trebouxiophyceae, Eustigmatophyceae and Chrysophyceae are associated with samples collected in the early spring, with higher concentrations of PO4 and lower N:P ratios. Some of these associations are supported by considering pairwise Spearman correlations, for example, Chrysophyceae had a correlation coefficient of 0.35 with spring (P<0.01), −0.28 with latitude (P<0.01), 0.36 with temperature (P<0.01) and −0.24 with N:P ratio (P<0.01). Prymnesiophyceae had a correlation coefficient of −0.3 with spring (P<0.01), 0.21 with latitude (P<0.01) and 0.2 with N:P ratio (P<0.01). However, it should be noted that these simple correlation calculations ignore the true complexity of the associations among the class distributions and environmental variables that is captured by the overall CCA model.
Considering the variables of phosphate and NO3+NO2 concentrations in more detail, peaks in relative hybridisation values for the Prymnesiophyceae tended to be linked with lower PO4 concentrations. Large prymnesiophytes in the Ross Sea are responsible for the export of higher N:P organic matter than that attributed to diatoms (Arrigo et al., 1999), and it is possible that pico-prymnesiophytes might co-vary with these larger prymnesiophytes. Samples with peak Chrysophyceae relative hybridisation values tended to have higher PO4 values (especially along the AMBITION, BIOSOPE and AMT transects). Marine production is constrained by nutrient availability, and phytoplankton N:P ratios differ with group. For example, green algae have higher ratios than red algae and growth strategies also alter this ratio (Falkowski et al., 2004; Arrigo, 2005). Generalist strategies have a near Redfield N:P ratio of 16:1, opportunistic strategies rely on low N:P ratios and survivalist strategies rely on high N:P ratios (Arrigo, 2005). The average N:P ratio of the water samples analysed in this study was calculated to be 14:1 by linear regression, similar to the study of Tyrell (1999) that reported a 15:1 N:P ratio. When considering only samples for which Prymnesiophyceae relative hybridisations were >30%, the average N:P ratio was 25:1, whereas when considering only samples for which Chrysophyceae relative hybridisation values were >30%, the average N:P ratio was 12:1. According to Weber and Deutsch (2010), phytoplankton may influence the N:P ratio of their surrounding water because of their differing metabolism. Alternatively, phytoplankton may be adapted to the N:P ratio of their surroundings, resulting in niche differentiation that may underlie the distribution patterns of the Prymnesiophyceae and the Chrysophyceae (see Litchman and Klausmeier, 2008). However, it should be considered that both classes had peaks at very low concentrations of these nutrients and it is likely that other factors in complex interactions also exerted influence over their distributions.
Plastid 16S rRNA gene sequences: global distribution analyses
In order to better understand global distributions of PPEs at a higher taxonomic level, all currently available plastid 16S rRNA gene sequences (this study; Fuller et al., 2003; McDonald et al., 2007; Lepère et al., 2009; Kirkham et al., 2011a, 2011b; Shi et al., 2011) obtained using the PLA491F/OXY1313R primer pair were analysed via Unifrac. This primer set is considered to best encompass the extent of PPE diversity currently observed using other 16S or 18S rRNA primer sets (for example, see Moon van der Staay et al., 2001; Shi et al., 2011) despite some known biases (see McDonald et al., 2007). It should be borne in mind that the number of plastid genomes per cell may also bias the data (see Maguire et al., 1995). Moreover, we would suggest that a cloning–sequencing approach allows targeting of mainly abundant taxa, leaving the rare taxa unseen (Pedros-Alio, 2006). As such, only the distribution of abundant taxa is likely to be deciphered here, and hence we cannot exclude that the distribution of rare taxa within the same group could be different.
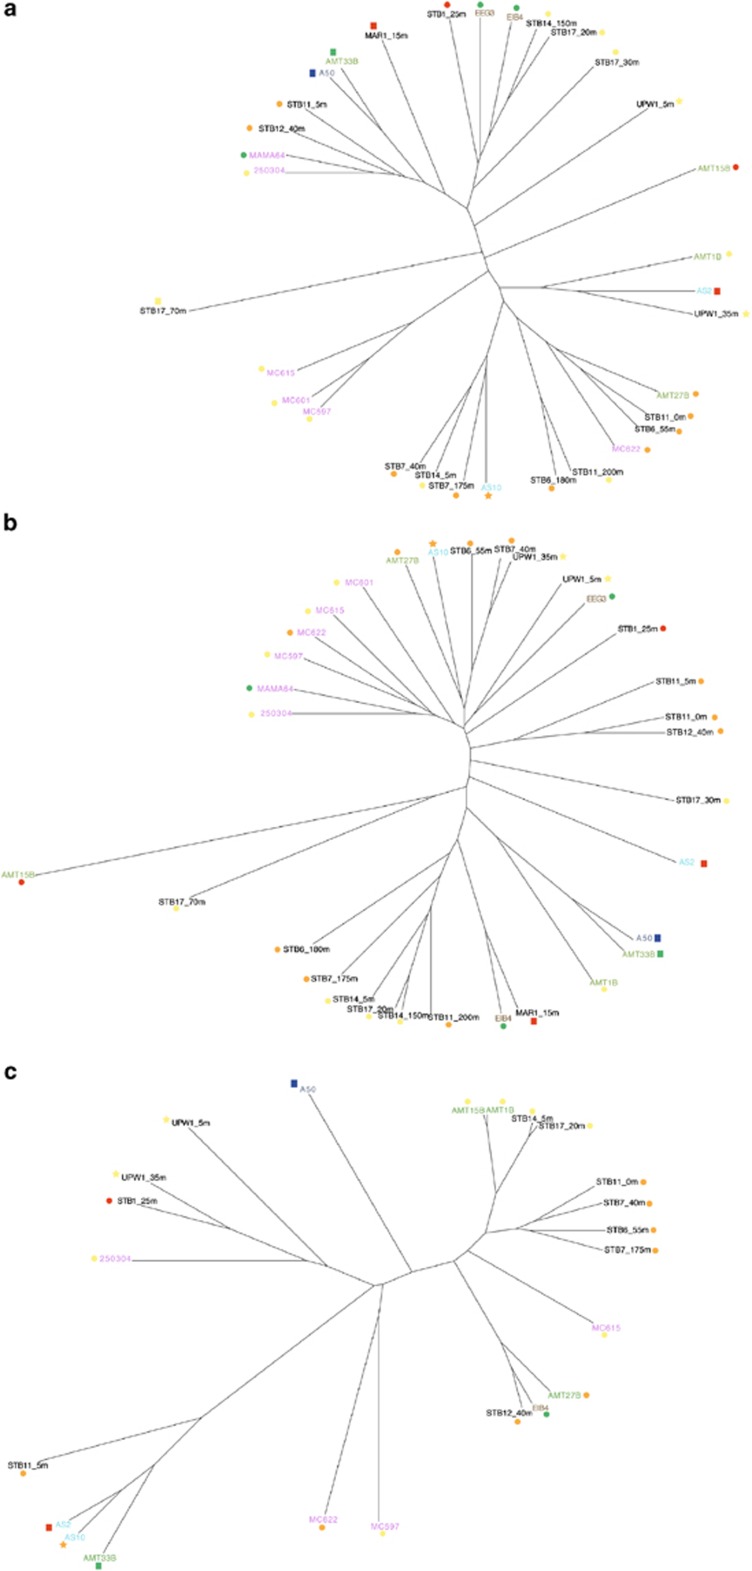
Unifrac analysis was performed on the total PPE genetic diversity as well as within specific PPE classes: Prymnesiophyceae, Chrysophyceae, Prasinophyceae and Cryptophyceae (Figure 6 and Supplementary Table 2). The P-value matrices using the total PPE data set that compared each library with each other showed a significant difference in the phylogenetic composition of PPEs between most of the different ocean basins (Supplementary Table 2a). However, some clustering of libraries from environments with similar nutrient status was noted despite the distance between locations (Figure 6a). For example, libraries from oligotrophic stations in the Atlantic Ocean, Pacific Ocean and Gulf of Naples (Mediterranean Sea) (AMT_27, Biosope_STB11_0, Biosope_STB6_55 and MC622) clustered closely together concomitant with low NO3+NO2 and PO4 concentrations and very similar water column temperatures (>20 °C). The Arctic Ocean and south Atlantic Ocean samples also branched very closely and share similar salinities (34.93 and 34.8 PSU), low temperatures (<13 °C), richness values indicating moderate species richness (compared with the range of values of the other libraries analysed) and similar Chrysophyceae abundances according to dot blot hybridisation data. Conversely, it is clear that the genetic similarity of different libraries is not only based on temperature and trophic status as libraries of similar status are well spread on the tree; for example, the Pacific (BIOSOPE) and Atlantic (AMT) gyre samples are genetically very different from each other, as are sequences from clone libraries derived from upwelling regions. In addition, libraries from dissimilar regions of the Atlantic (AMT1B), Arabian Sea (AS2) and Pacific Ocean upwelling region (UPW1_35m) clustered closely together despite having very different temperature, mixing regimes and nutrient status. However, noteworthy is that all three sites have comparatively high chlorophyll a concentrations (ranging between 0.28 and 1.37 mg m−3) and moderate species richness determined by the Margalef index. Even so, resolving the combination of parameters responsible for structuring the PPE community is likely to be much more complex than for picocyanobacterial communities (Zwirglmaier et al., 2008) given the differences of taxonomic resolution between groups (picocyanobacteria have been studied at the genera level).
Figure 6.
Unifrac analysis illustrating the genetic similarity of clone libraries based on sequences related to (a) all PPE classes, (b) Prymnesiophyceae and (c) Chrysophyceae. Coloured symbols illustrate the temperature and trophic status of the samples from which clone libraries were constructed. Circle, oligotrophic (Phosphate concentration <10 mg m−3); square, mesotrophic (Phosphate concentration 10–20 mg m−3); star, eutrophic (Phosphate concentration >20 mg m−3); blue, very low temperature (<10 °C); green, low temperature (10–14.99 °C); yellow, medium temperature (15–19.99 °C); orange, high temperature (20–24.99 °C); red, very high temperature (⩾25 °C).
For some libraries whose overall similarity was close, substantial genetic variation within a class was observed. For example, two clone libraries from the Ellett Line cruise (EEG3 and EIB4), which are geographically adjacent stations of comparable trophic and temperature status, present a very similar overall composition (Figure 6a and Supplementary Table 2). However, their Prymnesiophyceae sequences are genetically distinct (Supplementary Table 2b). Specific lineages observed within the Prymnesiophyceae (see, for example, Lepère et al., 2009) likely include various ecotypes subject to different long- and short-term ecological constraints (Worden and Not, 2008). In this respect, metagenomic analysis of a natural pico-prymnesiophyte population revealed a mosaic gene repertoire including specific adaptations for growth in oligotrophic environments (Cuvelier et al., 2010), conditions that may represent a driver of niche differentiation. Furthermore, light availability has been shown to be associated with niche partitioning in prokaryotic picophytoplankton (Moore et al., 1998; West and Scanlan, 1999) and within the prasinophyte genus Ostreococcus (Viprey et al., 2008), and may also drive the niche adaptation process in the Prymnesiophyceae. Interestingly, the P-value matrix for Chrysophyceae and Cryptophyceae showed almost no significant difference in their phylogenetic composition between the samples analysed here (Supplementary Tables 2c and e). This may suggest that these classes contain much less variation than the Prymnesiophyceae and Prasinophyceae (Supplementary Tables 2b and d) and may instead contain widespread lineages (Figures 6b and c) with generalist growth strategies rather than differently niche-adapted lineages.
Conclusions
This study further demonstrates the importance of pico-sized representatives of the Prymnesiophyceae and Chrysophyceae across all major ocean basins. At the global scale, our data showed an inverse distribution pattern of these two classes potentially associated with differing N:P requirements. On a vertical scale, our data also showed that although the α-diversity of PPEs decreased with depth, their community structure (β-diversity) did not significantly change over this factor.
According to the cosmopolitan view of the microbial world, community structure (richness, diversity and composition) is likely similar in habitats that are alike, whereas differentiated microbial communities exist along an environmental gradient (Green and Bohannan, 2006). Although the sampling was not exhaustive, and many more taxa (especially low frequency and rare ones) might be present at the sampling sites, Unifrac analysis revealed at higher resolution than the class level that differences in β-diversity were greater between basins (interbasins) than within a basin (intrabasin). However, sampling in the Mediterranean and South Pacific regions showed significantly different PPE β-diversity along their time series or transect, respectively. These inter- and intra-basin changes in overall PPE β-diversity were linked to Prymnesiophyceae and Prasinophyceae composition, whereas Chrysophyceae seemed to be phylogenetically quite similar in all libraries. Within classes, lineages adapted to specific conditions, for example, those encompassing high and low light-adapted ecotypes (Rodŕguez et al., 2005) likely occur (for example, the prasinophyte Ostreococcus; Demir-Hilton et al., 2011). Further study of PPE distribution patterns at a higher taxonomic resolution is thus required and renewed efforts are needed to obtain into culture many PPE representatives only known from environmental gene sequencing.
Acknowledgments
We thank the Captains and crews of all the cruises analysed. This study was supported by the UK Natural Environment Research Council via a PhD studentship award to ARK and NERC Grant NE/C003160/1 to DJS. Sequencing was performed at the NERC Biomolecular Analysis Facility in Edinburgh.
Footnotes
Supplementary Information accompanies the paper on The ISME Journal website (http://www.nature.com/ismej)
Supplementary Material
References
- Andersen RA. Biology and systematics of heterokont and haptophyte algae. Am J Bot. 2004;10:1508–1522. doi: 10.3732/ajb.91.10.1508. [DOI] [PubMed] [Google Scholar]
- Arrigo KR, Robinson DH, Worthen DL, Dunbar RB, DiTullio GR, VanWoert M, et al. Phytoplankton community structure and the drawdown of nutrients and CO2 in the Southern Ocean. Science. 1999;283:365–367. doi: 10.1126/science.283.5400.365. [DOI] [PubMed] [Google Scholar]
- Arrigo KR. Marine microorganisms and global nutrient cycles. Nature. 2005;437:349–355. doi: 10.1038/nature04159. [DOI] [PubMed] [Google Scholar]
- Bouman HA, Lepère C, Scanlan DJ, Ulloa O. Phytoplankton community structure in a high-nutrient, low-chlorophyll region of the eastern Pacific Subantarctic region during winter-mixed and summer-stratified conditions. Deep Sea Res I. 2012;69:1–11. [Google Scholar]
- Bouman HA, Ulloa O, Scanlan DJ, Zwirglmaier K, Li WK, Platt T, et al. Oceanographic basis of the global surface distribution of Prochlorococcus ecotypes. Science. 2006;312:918–921. doi: 10.1126/science.1122692. [DOI] [PubMed] [Google Scholar]
- Caron DA. Past President's address: protistan biogeography: why all the fuss. J Eukaryot Microbiol. 2009;56:105–112. doi: 10.1111/j.1550-7408.2008.00381.x. [DOI] [PubMed] [Google Scholar]
- Cuvelier ML, Allen A, Monier A, McCrow JP, Messié M, Tringe SG, et al. Targeted metagenomics and ecology of globally important uncultured eukaryotic phytoplankton. Proc Natl Acad Sci USA. 2010;33:14679–14684. doi: 10.1073/pnas.1001665107. [DOI] [PMC free article] [PubMed] [Google Scholar]
- Demir-Hilton E, Sudek S, Cuvelier ML, Gentemann CL, Zehr JP, Worden AZ. Global distribution patterns of distinct clades of the photosynthetic picoeukaryote Ostreococcus. ISME J. 2011;5:1095–1107. doi: 10.1038/ismej.2010.209. [DOI] [PMC free article] [PubMed] [Google Scholar]
- Falkowski PG, Schofield O, Katz ME, Van de Schootbrugge B, Knoll AH.2004Why is the land green and the ocean redIn: Thierstein H, Young JR, (eds)Coccolithophores—From Molecular Processes to Global Impact Elsevier: Amsterdam; 429–453. [Google Scholar]
- Finlay BJ, Esteban GF, Brown S, Fenchel T, Hoef-Emden K. Multiple cosmopolitan ecotypes within a microbial eukaryote morphospecies. Protist. 2006;157:377–390. doi: 10.1016/j.protis.2006.05.012. [DOI] [PubMed] [Google Scholar]
- Finlay BJ, Fenchel T. Cosmopolitan metapopulations of free-living microbial eukaryotes. Protist. 2004;155:237–244. doi: 10.1078/143446104774199619. [DOI] [PubMed] [Google Scholar]
- Foissner W. Biogeography and dispersal of micro-organisms: a review emphasizing protists. Acta Protozool. 2006;45:111–136. [Google Scholar]
- Fuhrman JA, Steele JA, Hewson I, Schwalbach MS, Brown MV, Green JL, et al. A latitudinal diversity gradient in planktonic marine bacteria. Proc Natl Acad Sci USA. 2008;105:7774–7778. doi: 10.1073/pnas.0803070105. [DOI] [PMC free article] [PubMed] [Google Scholar]
- Fuller NJ, Campbell C, Allen DJ, Pitt FD, Zwirglmaier K, Le Gall F, et al. Analysis of photosynthetic picoeukaryote diversity at open ocean sites in the Arabian Sea using a PCR biased towards marine algal plastids. Aquat Microb Ecol. 2006b;43:79–93. [Google Scholar]
- Fuller NJ, Marie D, Partensky F, Vaulot D, Post AF, Scanlan DJ. Clade-specific 16S ribosomal DNA oligonucleotides reveal the predominance of a single marine Synechococcus clade throughout a stratified water column in the Red Sea. Appl Environ Microbiol. 2003;69:2430–2443. doi: 10.1128/AEM.69.5.2430-2443.2003. [DOI] [PMC free article] [PubMed] [Google Scholar]
- Fuller NJ, Tarran GA, Cummings DG, Woodward EMS, Orcutt KM, Yallop M, et al. Molecular analysis of photosynthetic picoeukaryote community structure along an Arabian Sea transect. Limnol Oceanogr. 2006a;51:2502–2514. [Google Scholar]
- Green J, Bohannan BJM. Spatial scaling of microbial biodiversity. Trends Ecol Evol. 2006;21:501–507. doi: 10.1016/j.tree.2006.06.012. [DOI] [PubMed] [Google Scholar]
- Grob C, Hartmann M, Zubkov MV, Scanlan DJ. Invariable biomass-specific primary production of taxonomically discrete picoeukaryote groups across the Atlantic Ocean. Environ Microbiol. 2011;12:3266–3274. doi: 10.1111/j.1462-2920.2011.02586.x. [DOI] [PubMed] [Google Scholar]
- Hartmann M, Grob C, Tarran GA, Martina AP, Burkill PH, Scanlan DJ, et al. Mixotrophic basis of Atlantic oligotrophic ecosystems. Proc Natl Acad Sci USA. 2012;109:5756–5760. doi: 10.1073/pnas.1118179109. [DOI] [PMC free article] [PubMed] [Google Scholar]
- Hill TCJ, Walsh KA, Harris JA, Mofett BF. Using ecological diversity measures with bacterial communities. FEMS Micobiol Ecol. 2003;43:1–11. doi: 10.1111/j.1574-6941.2003.tb01040.x. [DOI] [PubMed] [Google Scholar]
- Härnström K, Ellegaard M, Andersen TJ, Godhe A. Hundred years of genetic structure in a sediment revived diatom population. Proc Natl Acad Sci USA. 2011;108:4252–4257. doi: 10.1073/pnas.1013528108. [DOI] [PMC free article] [PubMed] [Google Scholar]
- Jardillier L, Zubkov MV, Pearman J, Scanlan DJ. Significant CO2 fixation by small prymnesiophytes in the subtropical and tropical northeast Atlantic Ocean. ISME J. 2010;4:1180–1192. doi: 10.1038/ismej.2010.36. [DOI] [PubMed] [Google Scholar]
- Kirkham AR, Jardillier LE, Holland R, Zubkov MV, Scanlan DJ. Analysis of phototsynthetic picoeukaryote community structure along an extended Ellett Line transect in the northern North Atlantic reveals a dominance of novel prymnesiophyte and prasinophyte phylotypes. Deep Sea Res I. 2011b;58:733–744. [Google Scholar]
- Kirkham AR, Jardillier LE, Tiganescu A, Pearman J, Zubkov MV, Scanlan DJ. Basin-scale distribution patterns of photosynthetic picoeukaryotes along an Atlantic Meridional Transect. Environ Microbiol. 2011a;13:975–990. doi: 10.1111/j.1462-2920.2010.02403.x. [DOI] [PubMed] [Google Scholar]
- Le Gall F, Rigaut-Jalabert F, Marie D, Garczareck L, Viprey M, Godet A, et al. Picoplankton diversity in the South-East Pacific Ocean from cultures. Biogeosciences. 2008;5:203–214. [Google Scholar]
- Legendre P, Legendre L.1998Numerical Ecology2nd ednElsevier Science BV: Amsterdam [Google Scholar]
- Lepère C, Vaulot D, Scanlan DJ. Photosynthetic picoeukaryote community structure in the South East Pacific Ocean encompassing the most oligotrophic waters on Earth. Environ Microbiol. 2009;11:3105–3117. doi: 10.1111/j.1462-2920.2009.02015.x. [DOI] [PubMed] [Google Scholar]
- Li WKW. Primary production of prochlorophytes, cyanobacteria, and eucaryotic ultraphytoplankton: measurements from flow cytometric sorting. Limnol Oceanogr. 1994;39:169–175. [Google Scholar]
- Litchman E, Klausmeier CA. Trait-based community ecology of phytoplankton. Annu Rev Ecol Evol Syst. 2008;39:615–639. [Google Scholar]
- Liu H, Probert I, Uits J, Claustre H, Aris-Brosou S, Frada M, et al. Extreme diversity in noncalcifying haptophytes explains a major pigment paradox in open oceans. Proc Natl Acad Sci USA. 2009;106:12803–12808. doi: 10.1073/pnas.0905841106. [DOI] [PMC free article] [PubMed] [Google Scholar]
- Longhurst A.2007Ecological Geography of the Sea2nd ednElsevier, Academic Press [Google Scholar]
- Lozupone C, Knight R. UniFrac: a new phylogenetic method for comparing microbial communities. Appl Environ Microbiol. 2005;71:8228–8235. doi: 10.1128/AEM.71.12.8228-8235.2005. [DOI] [PMC free article] [PubMed] [Google Scholar]
- Ludwig W, Strunk O, Westram R, Richter L, Meier H, Yadhukumar, et al. ARB: a software environment for sequence data. Nucleic Acids Res. 2004;32:1363–1371. doi: 10.1093/nar/gkh293. [DOI] [PMC free article] [PubMed] [Google Scholar]
- Maguire MJ, Goff LJ, Coleman AW. In situ plastid and mitochondrial DNA determination: implication of the observed minimal plastid genome number. Am J Bot. 1995;82:1496–1506. [Google Scholar]
- McDonald SM, Sarno D, Scanlan DJ, Zingone A. Genetic diversity of eukaryotic ultraphytoplankton in the Gulf of Naples during an annual cycle. Aquat Microb Ecol. 2007;50:75–89. [Google Scholar]
- Moon van der Staay SY, De Watchter R, Vaulot D. Oceanic 18S rDNA sequences from picoplankton reveal unsuspected eukaryotic diversity. Nature. 2001;409:607–610. doi: 10.1038/35054541. [DOI] [PubMed] [Google Scholar]
- Moore LR, Rocap G, Chisholm SW. Physiology and molecular phylogeny of coexisting Prochlorococcus ecotypes. Nature. 1998;393:464–467. doi: 10.1038/30965. [DOI] [PubMed] [Google Scholar]
- Nolte V, Pandey RV, Jost S, Medinger R, Ottenwälder B, Boenigk J, et al. Constrasting seasonal niche separation between rare and abundant taxa conceals the extent of protist diversity. Mol Ecol. 2010;19:2908–2915. doi: 10.1111/j.1365-294X.2010.04669.x. [DOI] [PMC free article] [PubMed] [Google Scholar]
- Not F, Latasa M, Scharek R, Viprey M, Karleskind P, Balague V, et al. Protistan assemblages across the Indian Ocean, with a specific emphasis on the picoeukaryotes. Deep Sea Res I. 2008;55:1456–1473. [Google Scholar]
- Not F, Massana R, Latasa M, Marie D, Colson C, Eikrem W, et al. Late summer community composition and abundance of photosynthetic eukaryotes in Norwegian and Barents Seas. Limnol Oceanogr. 2005;50:1677–1686. [Google Scholar]
- Papke RT, Ward DM. The importance of physical isolation to microbial diversification. FEMS Microbiol Ecol. 2004;48:293–303. doi: 10.1016/j.femsec.2004.03.013. [DOI] [PubMed] [Google Scholar]
- Pedros-Alio C. Marine microbial diversity: can it be determined. Trends Microbiol. 2006;14:257–263. doi: 10.1016/j.tim.2006.04.007. [DOI] [PubMed] [Google Scholar]
- Pither J. Comment on ‘Dispersal limitations matter for microbial morphospecies'. Science. 2007;316:1124. doi: 10.1126/science.316.5828.1124a. [DOI] [PubMed] [Google Scholar]
- Richardson TL, Jackson GA. Small phytoplankton and carbon export from the surface ocean. Science. 2007;315:838–840. doi: 10.1126/science.1133471. [DOI] [PubMed] [Google Scholar]
- Rodríguez F, Derelle E, Guillou L, Le Gall F, Vaulot D, Moreau H. Ecotype diversity in the marine picoeukaryote Ostreococcus (Chlorophyta, Prasinophyceae) Eniviron Microbiol. 2005;7:853–859. doi: 10.1111/j.1462-2920.2005.00758.x. [DOI] [PubMed] [Google Scholar]
- Romari K, Vaulot D. Composition and temporal variability of picoeukaryote community at a coastal site of the English Channel from 18S rDNA sequences. Limnol Oceanogr. 2004;49:784–798. [Google Scholar]
- Sanders RW, Gast RJ. Bacterivory by phototrophic picoplankton and nanoplankton in Arctic waters. FEMS Microbiol Ecol. 2011;82:242–253. doi: 10.1111/j.1574-6941.2011.01253.x. [DOI] [PubMed] [Google Scholar]
- Schnetzer A, Moorthi SD, Countway PD, Gast RJ, Gilg IC, Caron DA. Depth matters: Microbial eukaryote diversity and community structure in the eastern North Pacific revealed through environmental gene libraries. Deep Sea Res I. 2011;58:16–26. [Google Scholar]
- Shi XL, Lepère C, Scanlan DJ, Vaulot D. Plastid 16S rRNA gene diversity among eukaryotic picophytoplankton sorted by flow cytometry from the South Pacific Ocean. PLoS One. 2011;4:e18979. doi: 10.1371/journal.pone.0018979. [DOI] [PMC free article] [PubMed] [Google Scholar]
- Shi XL, Marie D, Jardillier L, Scanlan DJ, Vaulot D. Groups without cultured representatives dominate eukaryotic picophytoplankton in the Oligotrophic South East Pacific. PLoS One. 2009;4:e7657. doi: 10.1371/journal.pone.0007657. [DOI] [PMC free article] [PubMed] [Google Scholar]
- Telford RJ, Vandik V, Birks HJB. Dispersal limitations matter for microbial morphospecies. Science. 2006;312:1015. doi: 10.1126/science.1125669. [DOI] [PubMed] [Google Scholar]
- Ter Braak CJF. Canonical correspondence analysis: a new eigenvector technique for multivariate direct gradient analysis. Ecology. 1986;67:1167–1179. [Google Scholar]
- Tyrell T. The relative influences of nitrogen and phosphorus on oceanic primary production. Nature. 1999;400:525–531. [Google Scholar]
- Vaulot D, Eikrem W, Viprey M, Moreau H. The diversity of small eukaryotic phytoplankton (⩽3 μm) in marine ecosystems. FEMS Microbiol Rev. 2008;32:795–820. doi: 10.1111/j.1574-6976.2008.00121.x. [DOI] [PubMed] [Google Scholar]
- Viprey M, Guillou L, Ferréol M, Vaulot D. Wide genetic diversity of picoplanktonic green algae (Chloroplastida) in the Mediterranean Sea uncovered by a phylum-biased PCR approach. Environ Microbiol. 2008;10:1804–1822. doi: 10.1111/j.1462-2920.2008.01602.x. [DOI] [PubMed] [Google Scholar]
- Weber TS, Deutsch C. Ocean nutrient ratios governed by plankton biogeography. Nature. 2010;467:550–554. doi: 10.1038/nature09403. [DOI] [PubMed] [Google Scholar]
- West NJ, Scanlan DJ. Niche-partitioning of Prochlorococcus populations in a stratified water column in the eastern North Atlantic Ocean. Appl Environ Microbiol. 1999;65:2585–2591. doi: 10.1128/aem.65.6.2585-2591.1999. [DOI] [PMC free article] [PubMed] [Google Scholar]
- West NJ, Schönhuber WA, Fuller NJ, Amann RI, Rippka R, Post AF, et al. Closely related Prochlorococcus genotypes show remarkably different depth distributions in two oceanic regions as revealed by in situ hybridisation using 16S rRNA-targeted oligonucleotides. Microbiology. 2001;147:1731–1744. doi: 10.1099/00221287-147-7-1731. [DOI] [PubMed] [Google Scholar]
- Worden AZ, Nolan JK, Palenik B. Assessing the dynamics and ecology of marine picophytoplankton: the importance of the eukaryotic component. Limnol Oceanogr. 2004;49:168–179. [Google Scholar]
- Worden AZ, Not F.2008Ecology and diversity of picoeukaryotesIn: Kirchman DL, (eds).Microbial Ecology of the Oceans2nd ednJohn Wiley & Sons: Hoboken, NJ, USA; 159–205. [Google Scholar]
- Yang J, Smith HG, Sherratt TN, Wilkinson DM. Is there a size limit for cosmopolitan distribution in free-living microorganisms? A biogeographical analysis of testate amoebae from polar areas. Microb Ecol. 2010;59:635–645. doi: 10.1007/s00248-009-9615-8. [DOI] [PubMed] [Google Scholar]
- Zubkov MV, Fuchs BM, Tarran GA, Burkill PH, Amann R. High rate of uptake of organic nitrogen compounds by Prochlorococcus cyanobacteria as a key to their dominance in oligotrophic oceanic waters. Appl Environ Microbiol. 2003;69:1299–1304. doi: 10.1128/AEM.69.2.1299-1304.2003. [DOI] [PMC free article] [PubMed] [Google Scholar]
- Zubkov MV, Tarran GA. High bacterivory by the smallest phytoplankton in the North Atlantic Ocean. Nature. 2008;455:224–226. doi: 10.1038/nature07236. [DOI] [PubMed] [Google Scholar]
- Zwirglmaier K, Jardillier L, Ostrowski M, Mazard S, Garczarek L, Vaulot D, et al. Global phylogeography of marine Synechococcus and Prochlorococcus reveals a distinct partitioning of lineages among oceanic biomes. Environ Microbiol. 2008;10:147–161. doi: 10.1111/j.1462-2920.2007.01440.x. [DOI] [PubMed] [Google Scholar]
Associated Data
This section collects any data citations, data availability statements, or supplementary materials included in this article.


