

Abstract
Background
Genome-wide association studies have identified single-nucleotide polymorphisms (SNPs) at 7 loci influencing glioma risk: rs2736100 (TERT), rs11979158 and rs2252586 (EGFR), rs4295627 (CCDC26), rs4977756 (CDKN2A/CDKN2B), rs498872 (PHLDB1), and rs6010620 (RTEL1).
Materials and methods
We studied the relationship among these 7 glioma-risk SNPs and characteristics of tumors from 1374 patients, including grade, IDH (ie IDH1 or IDH2) mutation, EGFR amplification, CDKN2A-p16-INK4a homozygous deletion, 9p and 10q loss, and 1p-19q codeletion.
Results
rs2736100 (TERT) and rs6010620 (RTEL1) risk alleles were associated with high-grade disease, EGFR amplification, CDKN2A-p16-INK4a homozygous deletion, and 9p and 10q deletion; rs4295627 (CCDC26) and rs498872 (PHLDB1) were associated with low-grade disease, IDH mutation, and 1p-19q codeletion. In contrast, rs4977756 (CDKN2A/B), rs11979158 (EGFR), and to a lesser extent, rs2252586 (EGFR) risk alleles were independent of tumor grade and genetic profile. Adjusting for tumor grade showed a significant association between rs2736100 and IDH status (P = .01), 10q loss (P = .02); rs4295627 and 1p-19q codeletion (P = .04), rs498872 and IDH (P = .02), 9p loss (P = .04), and 10q loss (P = .02). Case-control analyses stratified into 4 molecular classes (defined by 1p-19q status, IDH mutation, and EGFR amplification) showed an association of rs4295627 and rs498872 with IDH-mutated gliomas (P < 10−3) and rs2736100 and rs6010620 with IDH wild-type gliomas (P < 10−3 and P = .03).
Conclusion
The frequency of EGFR and CDKN2A/B risk alleles were largely independent of tumor genetic profile, whereas TERT, RTEL1, CCDC26, and PHLDB1 variants were associated with different genetic profiles that annotate distinct molecular pathways. Our findings provide further insight into the biological basis of glioma etiology.
Keywords: etiology, glioma, pathology, SNP
Gliomas account for >30% of all primary brain tumors, and each year in the United States, >20,000 individuals receive a diagnosis of the disease.1 Gliomas are heterogeneous and are typically classified according to tumor grade into pilocytic astrocytomas (World Health Organization [WHO] grade I), diffuse low-grade gliomas (WHO grade II), anaplastic gliomas (WHO grade III) and glioblastoma (GBM; WHO grade IV). Gliomas are also classified on the basis of cellular lineage: astrocytic, oligodendroglial, and mixed tumors.2
Over the past 10 years, specific tumor somatic aberrations have been shown to typify the various glioma subtypes, suggesting that different tumor genetic profiles result from different etiologic pathways. IDH (ie, IDH1 or less frequently IDH2) mutation is involved in the development of low-grade glioma and progressive GBM.3,4 The codeletion of chromosome 1p and 19q is highly correlated with oligodendroglial phenotype grade II and III and with IDH mutation. These molecular phenotypes are associated with good clinical outcome.5 In contrast, loss of chromosome 9p and 10q, homozygous deletions of the oncosuppressor CDKN2A-p16-INK4a, and the amplification of the EGFR oncogene are associated with high-grade disease and, particularly, GBM.6
Although Li-Fraumeni, Turcot, and the melanoma/glioblastoma syndromes are associated with substantive risks of glioma, all are rare and collectively account for <5% of glioma cases. The hypothesis that common genetic variation is a determinant of glioma risk has recently been vindicated by genome-wide association studies (GWASs), which have identified single-nucleotide polymorphisms (SNPs) at 7 loci influencing glioma risk: rs2736100 (TERT), rs11979158 and rs2252586 (EGFR), rs4295627 (CCDC26), rs4977756 (CDKN2A/B), rs498872 (PHLDB1), rs6010620 (RTEL1).7–9 Through an analysis of French and German patients, we previously showed that rs2736100 (TERT) and rs6010620 (RTEL) risk variants are associated with high-grade disease, whereas the rs4295627 (CCDC26) and rs498872 (PHLDB1) risk variants are associated with low-grade disease.10 Furthermore, rs11979158 and rs2252586 (EGFR) and rs4977756 (CDKN2A/B) risk variants appear to have a generic effect on tumor risk. This finding of a relationship between SNP genotype and tumor phenotype is supported by a recent study conducted by Jenkins et al.11
It is entirely possible that specific somatic genetic alterations may be associated with ≥1 of these polymorphisms, independent of tumor grade. To examine this proposition further, we investigated the association among the 7 glioma-risk SNPs and tumor histological and molecular genetic profile in a large French patient series that is part of the aforementioned study. Tumor genetic analyses included EGFR amplification, IDH mutation, CDKN2A-p16-INK4a homozygous deletion, and chromosomal loss on 9p, 10q, and 1p–19q.
Materials and Methods
Patients
Patients treated at the Pitié-Salpêtrière hospital were selected if they were part of a GWAS of gliomas previously reported7,8 and tumor material or tumour DNA from the initial tumor were available.
Clinical data were retrieved from a prospectively maintained database: age at surgery, sex, and tumor histology (astrocytoma grade II, oligoastrocytoma grade II, oligodendroglioma grade II, astrocytoma grade III, oligoastrocytoma grade III, oligodendroglioma grade III, GBM and glioblastoma with oligodendroglial component [GBMO] grade IV). Analyses were restricted to primary tumors. Pilocytic astrocytomas (WHO grade I) were excluded because of their peculiar histological, demographic, and biological characteristics, which differ from gliomagenesis for grades WHO II–IV. All tumor histologies were reviewed by 2 pathologists (V.D. and K.M.).
To calculate the risk of glioma by subtype, we made use of previously generated genotypes on 1190 controls.7 Collection of blood samples and clinico-pathological information was undertaken with informed consent and relevant ethical board approval in accordance with the tenets of the Declaration of Helsinki.
Table 1.
Molecular glioma subtypes by histology
| WHO Grade | Histological Subtype | Tumor Subgroup |
|||
|---|---|---|---|---|---|
| 1 | 2 | 3 | 4 | ||
| 1p-19q codeletion | Yes | No | No | No | |
| IDH mutation | Yes | Yes | No | No | |
| EGFR amplification | No | No | No | Yes | |
| II | Low grade astrocytoma | 4/54 (7.40%) | 35/54 (64.8%) | 15/54 (27.7%) | 0/54 (0.0%) |
| Oligoastrocytoma | 6/62 (9.7%) | 27/62 (43.5%) | 25/62 (40.3%) | 4/62 (6.5%) | |
| Oligodendroglioma | 69/203 (34.0%) | 77/203 (37.9%) | 55/203 (27.1%) | 2/203 (1.0%) | |
| Total | 79/319 (24.8%) | 139/319 (43.6%) | 95/319 (29.8%) | 6/319 (1.9%) | |
| III | Anaplastic astrocytoma | 1/19 (5.3%) | 7/19(36.8%) | 8/19(42.1%) | 3/19(15.8%) |
| Anaplastic oligoastrocytoma | 8/83 (9.6%) | 31/83 (37.3%) | 32/83 (38.6%) | 12/83 (14.5%) | |
| Anaplastic oligodendroglioma | 28/149 (18.8%) | 30/149 (20.1%) | 64/149 (43.0%) | 27/149 (18.1%) | |
| Total | 37/251 (14.7%) | 68/251 (27.1%) | 104/251 (41.4%) | 42/251 (16.7%) | |
| IV | Glioblastoma | 1/221 (0.5%) | 17/221 (7.7%) | 143/221 (64.7%) | 60/221 (27.1%) |
| Glioblastoma with oligodendroglial component | 1/76 (1.3%) | 6/76 (7.9%) | 43/76 (56.6%) | 26/76 (34.2%) | |
| Total | 2/297 (0.7%) | 23/297 (7.7%) | 186/297 (62.6%) | 86/297 (29.0%) | |
SNP Genotyping
Genotyping of rs2736100, rs11979158, rs2252586, rs4295627, rs4977756, rs6010620, and rs498872 SNPs have previously been described.7,10 In brief, DNA was extracted from samples using conventional methods and quantified using PicoGreen (Invitrogen). Genotyping was conducted using single-base primer extension chemistry matrix-assisted laser desorption/ionization time-offlight mass spectrometry detection (Sequenom; http://www.sequenom.com/). Genotyping quality control was evaluated through inclusion of duplicate DNA samples in SNP assays. For all SNP assays, >99% concordant results were obtained. Samples having SNP call rates <90% were excluded from the analysis.
Tumor Genotyping
Glioma samples were snap-frozen in liquid nitrogen. Tumor DNA was extracted from frozen tumors with use of the QIAmp DNA minikit, according to the manufacturer’s instructions (Qiagen). DNA was analyzed by comparative genomic hybridization (CGH) array as previously described.12 In the cases not analyzed by CGH array, 9p, 10q, 1p, and 19q status was determined by routine PCR microsatellite analysis, and EGFR amplification and CDKN2A-p16-INK4a homozygous deletion by quantitative PCR. R132 codon of IDH1 and R172 codon of IDH2 were analyzed by direct sequencing (IDH1f 5- TGTGTTGAGATGGACGCCTATTTG, IDH1r 5-ACTGAACCAGCAACCACCGT, IDH2f 5-GCCCGGTCTGCCACAAAGTC, and IDH2r 5-TTGGCAGACTCCAGAGCCCA), as previously described.3
Statistical Analyses
Statistical analyses were undertaken using R software (www.r-project.org). Differences in the distribution on categorical variables were analyzed using logistic regression. Odds ratios (ORs) and associated 95% confidence intervals (CIs) were calculated using unconditional logistic regression. In all analyses, we considered a P value of .05 (2-sided) as being statistically significant.
Results
Tumors Characteristics and Molecular Classification
One thousand three hundred seventy-two patients with glioma (511 WHO grade II, 410 grade III, and 451 grade IV) fulfilled the inclusion criteria (GBM is slightly under-represented, because unlike grade II and III, genomic analysis has not been performed routinely). The age at diagnosis was correlated with grade (median ages of 39, 50, and 57 years for II, III, and IV grade tumors, respectively). Median survival from diagnosis (50.1 months for the whole series) was strongly related to grade (133.3, 33.5, and 17.6 months for grade II, III, and IV tumors, respectively; P < .0001). The 9p and 10q loss, CDKN2A-p16-INK4a homozygous deletion, and EGFR amplification were associated with high-grade disease, whereas IDH mutation was associated with low-grade disease and 1p-19q codeletion with oligodendroglial tumors (all P < .0001; Supplementary material, Table S1).
Because a number of the molecular alterations in gliomas are highly correlated, we analyzed the association frequency of tumor genetic alterations and found IDH mutation, 1p-19q codeletion, and EGFR amplification showing the strongest association and exclusion scores (Supplementary material, Table S2). On the basis of this finding, we considered 4 mutually exclusive tumor classes:5,12 (1) IDH mutation/1p-19q codeletion/EGFR normal status, (2) IDH mutation/1p-19q normal status/EGFR normal status, (3) IDH wild-type/1p-19q normal status/EGFR normal status, and (4) IDH wild-type/1p-19q normal status/EGFR amplification (Table 1). Survival was correlated to these 4 tumor classes: 211.2 months (95% CI, 139.3-Not Reached) for class 1, 103.9 months (95% CI, 82.1–115.8) for class 2, 26.5 months (95% CI, 22.9–33.5) for class 3, and 16.6 months (95% CI, 14.9–20.0) for class 4 (P < .0001; Fig. 1).
Fig. 1.
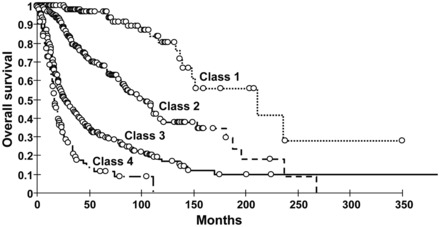
Kaplan–Meier curves in all glioma population show significant overall survival difference between tumor class 1-IDH mut/1p-19q codel/EGFR normal-(median OS 211.2 months), tumor class-2 IDH mut/1p-19q normal/EGFR normal-(median OS 103.9 months), tumor class 3-IDH wt/1p-19q normal/EGFR normal-(median OS 26.5 months), and tumor class 4-IDH wt/1p-19q normal/EGFR amplification-(median OS 16.6 months).
Association between SNP, Tumor Grades, and Tumor Genotypes
The frequency of the risk alleles did not differ by tumor grade for rs4977756 (CDKN2A/B) and rs11979158 (EGFR) but was higher in patients with GBM for rs2252586 (EGFR) (Supplementary material, Table S3) (P = .03). rs11979158 and rs2252586 (EGFR) genotypes were not associated with amplification of EGFR, neither with IDH mutation, CDKN2A-p16-INK4a homozygous deletions, loss of chromosome 9p, loss of chromosome 10q, or 1p-19q codeletion (Supplementary material, Tables S4 and S5). rs4977756 (CDKN2A/B) genotype was not associated with homozygous CDKN2A-p16-INK4a deletion or loss of chromosome 9p. It was also independent of EGFR amplification, IDH mutation, loss of chromosome 10q, and 1p-19q codeletion (Supplementary material, Tables S4 and S5).
The carrier frequencies of the risk alleles for the rs6010620 (RTEL1) and rs2736100 (TERT) were both significantly correlated with a diagnosis of GBM (P = .02 and P = .04, respectively), 10q loss (P = .005 and P = .002, respectively), and absence of IDH mutation (P = .03 and P = .0007, respectively) (Supplementary material, Tables S3–S5).
The carrier status for risk alleles of rs4295627 (CCDC26) and rs498872 (PHLDB1) were both correlated with the diagnosis of low-grade glioma (P < .0001 and P = .007, respectively) (Supplementary material, Table S3). rs4295627 (CCDC26) risk allele was associated with IDH mutation (P = .0002), 1p-19q codeletion (P = .0008), absence of EGFR amplification (P = .03), and absence of CDKN2A-p16-INK4a homozygous deletion (P = .01) (Supplementary material, Table S4 and S5). Similarly, rs498872 (PHLDB1) risk allele was associated with IDH mutation (P = .001), absence of EGFR amplification (P = .02), and retention of chromosomes 9p (P = .01) and 10q (P = .0007) (Supplementary material, Tables S4 and S5).
We then conducted case-control analyses specific for tumor molecular classes. The relationship between SNP genotype and tumor class is detailed in Supplementary material, Table S6 and Fig. 2. Both rs4295627 (CCDC26) and rs498872 (PHLDB1) were associated with IDH mutation (tumor class 1 and 2), defining a less aggressive disease. The association was particularly strong between rs4295627 (CCDC26) and class 1 (1p-19q codeleted gliomas, OR = 2.44, P = 6.8 × 10⁻⁹). Conversely, rs2736100 (TERT) and rs6010620 (RTEL1) genotypes were strongly associated with wild-type IDH, which define an aggressive disease (Fig. 2, Supplementary material, Table S6). A stronger impact of rs2252586 (EGFR) on wild-type IDH versus IDH-mutated tumor is also suggested, particularly on EGFR-amplified tumors.
Fig. 2.
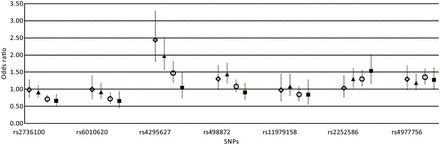
Glioma risk, stratified by specific tumor class, is represented (OR and 95% CI) for each single SNP. The data correspond to the Supplementary material, Table S6. ◊ IDH mutation/1p-19q codeletion/EGFR normal status; ▴ IDH mutation/1p-19q normal status/EGFR normal status; ○ IDH wild-type/1p-19q normal status/EGFR normal status; ▪ IDH wild-type/1p-19q normal status/EGFR amplification.
TERT, CCDC26, and PHLDB1 SNPs Are Associated With Molecular Features Independently of Grade
Because the somatic alterations seen in glioma are strongly related to tumor grade, we investigated whether any associations between SNP genotype and tumor molecular phenotype were independent of grade. Adjusting for tumor grade, we examined the relationship between SNP genotype and the molecular phenotype (Supplementary material, Table S7). Regression analysis adjusted for grade showed a significant association between carrier status for rs2736100 (TERT) and nonmutated IDH (P = .01), 10q loss (P = .02), between rs4295627 (CCDC26) and 1p-19q codeletion (P = .04), between rs498872 (PHLDB1) and IDH mutation (P = .02), retained chromosome 9p (P = .04), and chromosome 10q (P = .025). Adjusting for tumor grade, the rs6010620 (RTEL1) risk allele failed to show a significant association with any of the molecular features assayed in the tumors.
Discussion
Because there is a high rate of interobserver discrepancy in defining glioma subtypes histologically,13 we rather focused our analysis on the association between SNP genotype and molecular alterations. Using this approach, we have demonstrated a strong relationship among 4 of the 7 common risk variants for glioma and tumor phenotype and genotype.
It is particularly striking that GWAS has highlighted CDKN2A/B and EGFR, which are both among the most frequently altered genes in high-grade gliomas and especially GBM.6 However, SNPs annotating these genes were not associated with somatic alterations or GBM phenotype, except for a possible link between rs2252586 and GBM, IDH wild-type, and EGFR amplification (Supplementary material, Table S3 and S6). These data are compatible with the impact of these risk loci having a generic effect on the risk of developing glioma.
Both rs2736100 (TERT) and rs6010620 (RTEL1) were shown to predispose to the specific risk of developing high-grade gliomas and to 10q loss, a genetic alteration tightly related to GBM.14 The TERT gene encodes the catalytic subunit of telomerase, a prerequisite for cellular immortalization, and is aberrantly reactivated in most malignancies, including GBM.15,16RTEL1 is critical for telomere replication and the maintainance of genomic integrity by preventing homologous recombination.17 Multivariate analysis demonstrated that the risk allele of rs2736100 (TERT) is associated with a nonmutated IDH and the loss of chromosome 10q independently of tumor grade. Of interest, telomerase activity is itself associated with the loss of chromosome 10, which contains on 10p15 a repressor of telomerase activity.18
In contrast, rs4295627 (CCDC26) and rs498872 (PHLDB1) risk alleles were associated with the risk of low-grade glioma, rs4295627 being particularly associated with oligodendroglioma. CCDC26 encodes a retinoic acid-dependent regulator of cell differentiation and death.19 The function of PHLDB1 is currently unknown; however, the 11q23.3 region is commonly deleted in neuroblastoma,20 and 11q loss is also reported in low-grade gliomas.21 We found that both risk loci were associated to IDH mutation, which is more frequent in low-grade gliomas, and 1p-19q codeletion, which is tightly related to oligodendroglial phenotype. Independent of the grade, multivariate analysis found that rs4295627 (CCDC26) associated to 1p-19q codeletion and rs498872 (PHLDB1) associated with IDH mutation and retained 10q. The association between rs4295627 and 1p-19q codeletion is concordant with recently published results from a US study in which the CCDC26 (8q24) region polymorphism rs4296627 was strongly associated with oligodendroglial tumor risk, especially with 1p-19q codeletion.11 We found CCDC26 SNP associated with oligodendroglial, but also mixed and astrocytic tumours, and not with GBM (Supplementary material, Table S3).10 Taken together, these studies suggest that rs4295627 (CCDC26) is associated with a risk to develop progressive gliomas (oligodendroglial and astrocytic, mostly IDH mutated) and, particularly, oligodendrogliomas with 1p-19q codeletion.
We clustered our population into 4 subgroups of growing aggressiveness based on 1p-19q codeletion, EGFR amplification (strongly associated with glioblastoma phenotype), and IDH mutation status. IDH mutation is associated with low-grade gliomas and progressive glioblastomas, and it is a constant feature in 1p-19q codeleted gliomas.5 By promoting DNA and histone methylation, IDH mutation results in an hypermethylated phenotype with profound reorganization of gene expression and dysregulation of glial differentiation.22,23 Therefore, it is not surprising that the most relevant and robust association, from our 4-class molecular clustering, was found with the IDH status: IDH-mutated gliomas (class 1–2) are associated with rs4295627 (CCDC26) and rs498872 (PHLDB1) risk alleles, whereas IDH wild type gliomas (class 3–4) are associated with rs2736100 (TERT) and rs6010620 (RTEL1) risk alleles.
In conclusion, we have shown heterogeneity in the risk profile of the different glioma pathways ascribable to common genetic susceptibility. Collectively, our data suggest that risk alleles in TERT and RTEL1 predispose to an aggressive pathway involving loss of chromosome 10, whereas CCDC26 and PHLDB1 risk alleles predispose to lower grade disease involving IDH mutation and 1p-19q loss. Because this was an exploratory study, further studies are needed to replicate these results in independent populations. Although the impact of each of these SNPs on tumor biology is small and, thus, individually, they may not have immediate clinical application, the associations provide novel insights into the biological mechanism underlying glioma formation and development.
Funding
This work was supported by the Délégation à la Recherche Clinique (MUL03012), the Institut National du Cancer (INCa; PL046), the Ligue Nationale contre le Cancer, the program “Investissements d'avenir” ANR-10-IAIHU-06, and Cancer Research UK (C1298/A8362 supported by the Bobby Moore Fund to R. H.).
Supplementary Material
Acknowledgments
We thank the patients for agreeing to participate in this study, Anne-Marie Lekieffre and Muriel Brandel for their assistance, the clinicians and nurses who contributed to data collection, and the Institut Hospitalier Universitaire de Neurosciences Translationnelles de Paris.
Conflict of interest statement. None declared.
References
- 1.Siegel R, Ward E, Brawley O, Jemal A. Cancer statistics. CA Cancer J Clin. 2011;61:212–236. doi: 10.3322/caac.20121. [DOI] [PubMed] [Google Scholar]
- 2.Louis D, Ohgaki H, Wiestler O, et al. The 2007 WHO classification of tumours of the central nervous system. Acta Neuropathologica. 2007;114:97–109. doi: 10.1007/s00401-007-0243-4. [DOI] [PMC free article] [PubMed] [Google Scholar]
- 3.Yan H, Parsons DW, Jin G, et al. IDH1 and IDH2 mutations in gliomas. N Engl J Med. 2009;360:765–773. doi: 10.1056/NEJMoa0808710. [DOI] [PMC free article] [PubMed] [Google Scholar]
- 4.Sanson M, Marie Y, Paris S, et al. Isocitrate dehydrogenase 1 codon 132 mutation is an important prognostic biomarker in gliomas. J Clin Oncol. 2009;27:4150–4154. doi: 10.1200/JCO.2009.21.9832. [DOI] [PubMed] [Google Scholar]
- 5.Labussiere M, Idbaih A, Wang XW, et al. All the 1p19q codeleted gliomas are mutated on IDH1 or IDH2. Neurology. 2010;74:1886–1890. doi: 10.1212/WNL.0b013e3181e1cf3a. [DOI] [PubMed] [Google Scholar]
- 6.Ohgaki H, Kleihues P. Genetic pathways to primary and secondary glioblastoma. Am J Pathol. 2007;170:1445–1453. doi: 10.2353/ajpath.2007.070011. [DOI] [PMC free article] [PubMed] [Google Scholar]
- 7.Shete S, Hosking FJ, Robertson LB, et al. Genome-wide association study identifies five susceptibility loci for glioma. Nat Genet. 2009;41:899–904. doi: 10.1038/ng.407. [DOI] [PMC free article] [PubMed] [Google Scholar]
- 8.Sanson M, Hosking FJ, Shete S, et al. Chromosome 7p11.2 (EGFR) variation influences glioma risk. Hum Mol Genet. 2011;20:2897–2904. doi: 10.1093/hmg/ddr192. [DOI] [PMC free article] [PubMed] [Google Scholar]
- 9.Wrensch M, Jenkins RB, Chang JS, et al. Variants in the CDKN2B and RTEL1 regions are associated with high-grade glioma susceptibility. Nat Genet. 2009;41:905–908. doi: 10.1038/ng.408. [DOI] [PMC free article] [PubMed] [Google Scholar]
- 10.Simon M, Hosking FJ, Marie Y, et al. Genetic risk profiles identify different molecular etiologies for glioma. Clin Cancer Res. 2010;16:5252–5259. doi: 10.1158/1078-0432.CCR-10-1502. [DOI] [PMC free article] [PubMed] [Google Scholar]
- 11.Jenkins RB, Wrensch MR, Johnson D, et al. Distinct germ line polymorphisms underlie glioma morphologic heterogeneity. Cancer Genet. 2011;204:13–18. doi: 10.1016/j.cancergencyto.2010.10.002. [DOI] [PMC free article] [PubMed] [Google Scholar]
- 12.Idbaih A, Marie Y, Lucchesi C, et al. BAC array CGH distinguishes mutually exclusive alterations that define clinicogenetic subtypes of gliomas. Int J Cancer. 2008;122:1778–1786. doi: 10.1002/ijc.23270. [DOI] [PubMed] [Google Scholar]
- 13.Coons SW JP, Scheithauer BW, Yates AJ, Pearl DK. Improving diagnostic accuracy and interobserver concordance in the classification and grading of primary gliomas. Cancer. 1997;79:1381–1393. doi: 10.1002/(sici)1097-0142(19970401)79:7<1381::aid-cncr16>3.0.co;2-w. [DOI] [PubMed] [Google Scholar]
- 14.Albarosa R, Colombo BM, Roz L, et al. Deletion mapping of gliomas suggest the presence of two small regions for candidate tumor-suppressor genes in a 17-cM interval on chromosome 10q. Am J Hum Genet. 1996;58:1260–1267. [PMC free article] [PubMed] [Google Scholar]
- 15.Langford LA, Piatyszek MA, Xu R, Schold SC, Jr, Shay JW. Telomerase activity in human brain tumours. Lancet. 1995;346:1267–1268. doi: 10.1016/s0140-6736(95)91865-5. [DOI] [PubMed] [Google Scholar]
- 16.Hiraga S, Ohnishi T, Izumoto S, et al. Telomerase activity and alterations in telomere length in human brain tumors. Cancer Res. 1998;58:2117–2125. [PubMed] [Google Scholar]
- 17.Barber LJ, Youds JL, Ward JD, et al. RTEL1 maintains genomic stability by suppressing homologous recombination. Cell. 2008;135:261–271. doi: 10.1016/j.cell.2008.08.016. [DOI] [PMC free article] [PubMed] [Google Scholar]
- 18.Leuraud P, Aguirre-Cruz L, Hoang-Xuan K, et al. Telomerase reactivation in malignant gliomas and loss of heterozygosity on 10p15.1. Neurology. 2003;60:1820–1822. doi: 10.1212/01.wnl.0000065894.89082.5e. [DOI] [PubMed] [Google Scholar]
- 19.Yin W, Rossin A, Clifford JL, Gronemeyer H. Co-resistance to retinoic acid and TRAIL by insertion mutagenesis into RAM. Oncogene. 2006;25:3735–3744. doi: 10.1038/sj.onc.1209410. [DOI] [PubMed] [Google Scholar]
- 20.Guo C, White PS, Hogarty MD, et al. Deletion of 11q23 is a frequent event in the evolution of MYCN single-copy high-risk neuroblastomas. Med Pediatr Oncol. 2000;35:544–546. doi: 10.1002/1096-911x(20001201)35:6<544::aid-mpo10>3.0.co;2-2. [DOI] [PubMed] [Google Scholar]
- 21.Dahlback HS, Gorunova L, Brandal P, et al. Genomic aberrations in diffuse low-grade gliomas. Genes Chromosomes Cancer. 2011;50:409–420. doi: 10.1002/gcc.20866. [DOI] [PubMed] [Google Scholar]
- 22.Turcan S, Rohle D, Goenka A, et al. IDH1 mutation is sufficient to establish the glioma hypermethylator phenotype. Nature. 2012;483:479–483. doi: 10.1038/nature10866. [DOI] [PMC free article] [PubMed] [Google Scholar]
- 23.Lu C, Ward PS, Kapoor GS, et al. IDH mutation impairs histone demethylation and results in a block to cell differentiation. Nature. 2012;483:474–478. doi: 10.1038/nature10860. [DOI] [PMC free article] [PubMed] [Google Scholar]
Associated Data
This section collects any data citations, data availability statements, or supplementary materials included in this article.