

Abstract
Aims
To evaluate the safety, tolerability, pharmacokinetics and pharmacodynamics of odanacatib (ODN), a cathepsin K inhibitor, in humans.
Methods
Two double-blind, randomized, placebo-controlled, single oral dose studies were performed with ODN (2–600 mg) in 44 healthy volunteers (36 men and eight postmenopausal women).
Results
Adverse experiences (AEs) with single doses of ODN were transient and mild to moderate, with the exception of one severe AE of gastroenteritis. Headache was the most frequent AE. After absorption of ODN (initial peak concentrations 4–6 h postdose), plasma concentrations exhibited a monophasic decline, with an apparent terminal half-life of ∼40–80 h. The area under the curve0-24 hours (AUC0–24 h), concentration at 24 hours (C24 h) and maximum concentration (Cmax,overal) increased in a less than dose-proportional manner from 2 to 600 mg. Administration of ODN with a high-fat meal led to ∼100% increases in AUC0–24 h, Cmax,day1, Cmax,overall and C24 h relative to the fasted state, while administration with a low-fat meal led to a ∼30% increase in those parameters. Reduction of biomarkers of bone resorption, the C- and N-telopeptides of cross-links of type I collagen, (CTx and NTx, respectively), was noted at 24 h for doses ≥5 mg and at 168 h postdose for ≥10 mg. In postmenopausal women administered 50 mg ODN, reductions in serum CTx of −66% and urine NTx/creatinine (uNTx/Cr) of −51% relative to placebo were observed at 24 h. At 168 h, reductions in serum CTx (−70%) and uNTx/Cr (−78%) were observed relative to baseline. Pharmacokinetic/pharmacodynamic modeling characterized the ODN concentration/uNTx/Cr relation, with a modeled EC50 value of 43.8 nM and ∼80% maximal reduction.
Conclusions
Odanacatib was well tolerated and has a pharmacokinetic and pharmacodynamic profile suitable for once weekly dosing.
Keywords: cathepsin K inhibitor, odanacatib, osteoporosis, pharmacodynamics, pharmacokinetics
WHAT IS ALREADY KNOWN ABOUT THIS SUBJECT
Cathepsin K (CatK), a cysteine protease expressed in osteoclasts, can degrade collagen type I and II components of bone and cartilage. Genetic and pharmacological evidence supports a central role of CatK in mediating bone resorption. In preclinical studies, CatK inhibitors reduce levels of biochemical markers of bone resorption and increase bone mineral density in a dose-dependent manner. These findings have supported CatK as a target for novel molecules to treat osteoporosis.
WHAT THIS STUDY ADDS
This study represents the first introduction of odanacatib, a selective cathepsin K inhibitor, in humans, including the target population of postmenopausal women. This study confirmed that a cathepsin K inhibitor suppresses markers of bone resorption (urine N-terminal telopeptide of type I collagen normalized to creatinine and serum C-terminal telopeptide of type I collagen). This was the first confirmation of a once weekly potential for this novel mechanism, which has demonstrated fracture risk reduction in a Phase III study. This is potentially the first new oral mechanism for the treatment of osteoporosis in approximately 15 years.
Introduction
Osteoporosis is characterized by increased bone turnover, low bone mass and an increased risk of fracture. The bone loss results from an imbalance between bone resorption and formation. Osteoporosis continues to be a major health problem. Approximately 200 million adults worldwide have osteoporosis [1], and approximately 30% of all postmenopausal women in the Europe and the USA have osteoporosis [2]. Osteoporosis results in more days in hospital than myocardial infarction, diabetes or breast cancer [3].
Notwithstanding the availability of effective treatments for osteoporosis, such as the bisphosphonates (alendronate, risedronate, ibandronate and zoledronate), estrogen-based therapies, selective estrogen receptor modulators (raloxifene and bazedoxifene), parathyroid hormone and other niche treatments, including calcitonin, vitamin D derivatives and strontium (in some countries), many individuals with osteoporosis remain untreated. Although many individuals with osteoporosis remain undiagnosed, this lack of treatment may also reflect poor tolerability and mechanism-based toxicities of current therapies for osteoporosis. New therapies for osteoporosis that may potentially improve or augment existing therapies include the recently approved anti-Receptor Activator of NF-KappaB-ligand monoclonal antibody (denosumab/Prolia) and the cathepsin K (CatK) inhibitor odanacatib (ODN), presently in late stage clinical development.
The cathepsins are a family of cysteine and aspartic proteases that have known collagenolytic activity. Cathepsin K, a cysteine protease, can efficiently degrade both type I and II collagen, both of which are major matrix components of bone and cartilage [4]. Cathepsin K is the most abundant cysteine protease expressed in osteoclasts and plays a central role in mediating bone resorption [5]. In pycnodysostosis, a rare osteochondral dysplasia disorder characterized by a life-long absence of CatK, patients demonstrate a high bone mass phenotype together with reduced levels of biomarkers of bone resorption [6]. Correspondingly, mice lacking CatK, generated by gene deletion, exhibit a high bone mass phenotype with hallmark thick bone trabeculae [7] and increased bone strength [8]. In preclinical ovariectomized models, CatK inhibitors reduce levels of biochemical markers of bone resorption [9] and increase bone mineral density [9–11] in a dose-dependent manner. These findings further underscore the appeal of CatK as a target for novel molecules to treat osteoporosis [5].
Antiresorptive therapies are characterized by their ability to decrease biochemical markers of bone resorption which correlate with increases in bone mineral density, and together may be used to predict fracture efficacy [12, 13]. When bone is resorbed, peptide products of type I collagen are released and can be measured in the serum and/or urine [14–16]. The N- and C-telopeptides of the cross-links of type I collagen are termed NTx and CTx, respectively [16]. Both NTx and CTx are generated by the direct enzymatic action of CatK on collagen, and reduction further confirms pharmacological target engagement. Cathepsin K cleaves the N-telopeptide of collagen to generate NTx and also degrades the serum C-terminal telopeptide to type I collagen (1-CTP), a larger C-terminal fragment of type I collagen produced by the action of matrix metalloproteinases [17, 18], to generate CTx [19, 20]. Although there are no approved CatK inhibitors, both balicatib (AAE581) [21] and ONO-5334 [22], no longer in development, and preclinical and early clinical experiments with ODN have demonstrated pharmacodynamic (PD) activity; with reduced markers of bone resorption and increased bone mineral density [9, 11, 23].
Odanacatib (MK-0822; Merck & Co., Inc., Whitehouse Station, NJ, USA) is a potent (in vitro IC50 = 0.20 nm), orally active and selective CatK inhibitor (≥300-fold selectivity against all other known human cathepsins) [24].
This manuscript reports the introduction of ODN in humans performed in healthy volunteers (men and postmenopausal women; first-in-human administration). The two studies described herein were designed to explore the safety and tolerability of rising single oral doses of ODN, the plasma pharmacokinetic (PK) profile of ODN following single dose administration in both the fasted and fed state, and to assess the PD activity of ODN on biochemical markers of bone resorption for the first time.
Methods
Subjects
These two studies enrolled a total of 44 healthy volunteers. The first study (multipanel) included 28 healthy male subjects 18–45 years of age and eight healthy, postmenopausal female subjects ≤60 years of age. The second study (single panel) enrolled a total of eight healthy male subjects 18–45 years of age.
Subject inclusion and exclusion criteria
Participants were judged to be in good health on the basis of medical history, physical examination, electrocardiogram (ECG) and routine laboratory safety assessment. For female volunteers, postmenopausal status was confirmed by no menses for at least 3 years or no menses for at least 1 year with an elevated follicle-stimulating hormone in the postmenopausal range for the reference laboratory. Exclusion criteria included the following: estimated creatinine clearance of ≤80 ml min−1 (study I) and ≤70 ml min−1 (study II); and a history of metabolic bone disease, urolithiasis or treatment with a bisphosphonate or other bone active agent.
All subjects gave written consent, and the protocols were approved by the Ethical Review Committee of the University of Ghent and the Southern Institutional Review Board, Inc. The protocol was conducted in accordance with the guidelines on good clinical practice and with ethical standards for human experimentation.
Study design
The overall study design is represented schematically in Figure 1 and in a tabular form in Table S1. The first study with ODN included four cohorts of subjects evaluated in a multipanel (A–D), multiple period, double-blind, placebo-controlled, alternating panel, rising single dose study to evaluate the safety, tolerability, PK and PD properties of single oral doses of ODN (2–600 mg) in healthy volunteers. Subjects were randomized to treatment sequences within each panel.
Figure 1.
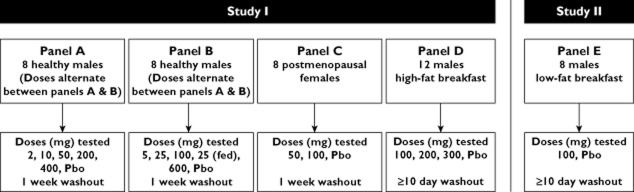
Study design. Abbreviation: Pbo, placebo
In panel A, eight male subjects received single doses of ODN (2, 10, 50, 200 and 400 mg) or placebo and eight different males received single doses of ODN [5, 25, 100, 600 and 25 mg (fed state)] or placebo (panel B) in an alternating sequence, such that no two dose levels were dosed simultaneously. This allowed for two dose levels of ODN to be administered weekly, but the second dose in a given week was not administered until the safety and tolerability had been evaluated from the previous dose, including laboratory evaluations. In each panel, two different subjects received placebo in each of periods 1–4, and two subjects received placebo for a second time in period 5. Each period in panel A and B was separated by 1 week, which constituted the washout for that panel. In panel C, eight postmenopausal female subjects received single doses of ODN (50 and 100 mg) or placebo. All doses were administered after an overnight fast, except for the 25 mg fed dose in males (panel B), which was administered with a high-fat breakfast [24]. At each dose level, six subjects were randomized to receive the drug and two subjects received placebo. The two periods in panel C were separated by 7 days, which served as the washout for the panel. Blood and urine were obtained at selected time points pre- and postdose for determination of ODN plasma concentrations and for measurement of serum CTx (sCTx) and urine NTx/creatinine (uNTx/Cr). Blood samples for PK were collected for 24 h for the 2 and 5 mg doses, 96 h for the 10, 25 (fed and fasted), 50, 100 and 200 mg doses in the men, for 120 h for the 50 mg dose in the women, for 240 h for the 400 and 600 mg doses in men, and for 336 h for the 100 mg dose in women. After an unexpectedly long apparent terminal half-life was observed in early treatment periods, PK collection times were adjusted in later periods in order to improve assessment of the terminal phase of ODN.
The uNTx/Cr was measured at predose and at 24 and 48 h postdose at each dose level. The sCTx was measured at predose and at 4, 10 and 24 h postdose at the 5, 10, 25 (fasted), 50, 100 and 200 mg dose levels in males. The sCTx was measured at predose and at 4, 10, 24 and 48 h postdose at the 400 and 600 mg dose levels in males and the 50 and 100 mg dose level in females. The sCTx was not measured for the 2 or 25 mg fed dose.
Owing to to the relatively short anticipated half-life, 168 h sampling for sCTx and uNTx/Cr was not done. However, because there was a 1 week interval between dosing for the first four periods, the predose measurement of sCTx and uNTx/Cr in periods 2, 3 and 4 served as the 168 h measurement for the doses administered in the previous period; i.e. 2 (uNTx/Cr only), 5, 10, 25, 50 and 100 mg (uNTx/Cr only). Likewise, for the cohort in women, a 168 h measurement was obtained for the 50 mg dose/placebo as the predose value in the second treatment period (100 mg).
In panel D, 12 healthy male subjects received three single doses of ODN (100, 200 and 300 mg) or placebo following a high-fat breakfast in three treatment periods. Nine subjects were randomized to receive ODN and three subjects to placebo. Blood samples were obtained at selected time points pre- and postdose for determination of ODN plasma concentrations. Each period in panel D was separated by at least 10 days, which constituted the washout for that panel.
Study II was a double-blind, randomized, two-period crossover, placebo-controlled study, in which eight healthy male subjects were randomized to receive a single oral dose of 100 mg ODN or placebo following a low-fat breakfast [24] in one period and in the fasted state in another period (panel E). There was a minimal washout period of 10 days between the administration of the two doses. The effect of a low-fat breakfast was evaluated because this more closely reflects the diet that postmenopausal women, the target population, typically consume. Six subjects were allocated to receive active drug and two subjects received placebo.
Safety assessments
In both studies, safety was monitored by physical examinations, vital signs, 12-lead ECGs (including assessment for QTc and PR interval) and safety laboratory measurements consisting of routine haematology, serum chemistry (including liver transaminases) and urinalysis at prestudy, predose, at various time points after dosing, and at post-study. Adverse experiences (AEs) were monitored throughout the study. Investigators assessed all clinical AEs in terms of intensity (mild, moderate or severe), duration, severity, outcome and relation to study drug. The decision to proceed to the next dose level was based on acceptable safety and tolerability during administration at the previous dose.
Pharmacokinetic assessments
Blood samples for plasma ODN concentration assay were drawn predose and at selected postdose times, and the plasma samples obtained were stored at −20°C until assayed. The lower limit of quantification (LLOQ) for this high-performance liquid chromatography tandem mass spectrometry (MS/MS) method is 0.5 ng ml−1, with a linear calibration range from 0.5 to 500 ng ml−1. Intra- and inter-run variability was within 5.88%, with accuracy between 95.6 and 106% of the nominal concentrations [25].
Odanacatib was extracted from human urine by automated μElution solid-phase extraction and analysed by liquid chromatography (LC)-MS/MS under positive ion mode via a turbo ionspray source. The M+6 stable labelled isotope [13C6] L-001037536 was used as the internal standard. For the urine assay, quality control samples were assayed along with the study samples to assess precision and accuracy in the LC-MS/MS analysis. Results showed that assay precision was within 4.79% and bias within 10.5% at low (0.12 ng ml−1), middle (6.0 ng ml−1) and high (30 ng ml−1) concentrations of the ODN calibration curve range. The standard curve and quality control data from the study passed the acceptance criteria for quantitative analysis of ODN in urine over the range of 0.05–50 ng ml−1. The percentage coefficient of variation and percentage bias at the LLOQ concentration were 1.96 and 2.00, respectively, suggesting acceptable performance of the assay at the low concentration range of the calibration curve. The LLOQ for the urine assay was 0.05 ng ml−1, and the linear calibration range was 0.05–50 ng ml−1. Odanacatib metabolites were not assayed in plasma or urine.
The following PK parameters were examined in this study: area under the curve0-24 hours (AUC0–24 h), area under the curve0-168 hours (AUC0–168 h), area under the curve0-infinity (AUC0–∞), concentration at 24 hours (C24 h), concentration at 168 hours (C168 h), maximum concentration, overall (Cmax,overall), time to maximum plasma concentration, overall (Tmax,overall), maximum concentration, day1 (Cmax,day1), Time to Maximum Plasma Concentration, day 1 (Tmax,day1), apparent terminal half-life and excretion in urine, including renal clearance. Given that PK sampling times were adjusted during the course of the study, not all parameters are reported for each subject. Unless stated otherwise, the statistical analyses described below were performed on natural logarithmic scale for AUC0–24 h, AUC0–168 h, AUC0–∞, C24 h, C168 h Cmax,overall and Cmax,day1, and on reciprocal-transformed apparent terminal half-life using established noncompartmental analysis routines in WinNonLin® (Pharsight, Mountain View, CA, USA). If a transformation was applied to a PK parameter, the final results are reported on its original scale after back-transformation. All confidence intervals (CIs) mentioned below are two sided.
In study I, the plasma concentration profile of ODN was measured for up to 240 h following dosing in males (panels A and B) and up to 312 h following dosing in postmenopausal women (panel C). In the high-fat panel D, the plasma concentration profile of ODN was measured for up to 336 h postdose. Given that the study was designed in the anticipation of a shorter drug half-life and the sampling scheme was subsequently modified to accommodate the longer observed half-life, samples were not collected at every time point listed for every subject and panel. Urine was collected over 24 h (collection intervals: 0–4, 4–8, 8–12 and 12–24 h) following dosing to assess urinary recovery of ODN following doses of 2, 10 and 50 mg in males (panel A).
Plasma and urine concentrations for ODN, converted into molar units (nm), and sampling times, converted to elapsed time relative to ODN dosing times, were used to estimate PK parameters (with the exception of Tmax) for each treatment in each subject. Values below the plasma assay limit of quantification (BQL = 0.5ng ml−1 = ∼1 nm) were replaced according to the following rules: predose BQL value = 0; first and subsequent BQL values in the terminal phase = 0. The AUC0–∞ was calculated using the linear trapezoidal method for ascending concentrations and the log trapezoidal method for descending concentrations. The extrapolated portion of the AUC from the last time point collected (Tlast) to infinity was determined by dividing the observed concentration at Tlast (Clast) by the terminal elimination rate constant (k). The AUC0–∞ was then calculated from the sum of the AUC through the last measured time point and the extrapolated area. The value of k was determined from the slope of a least-squares fit to the terminal phase of the concentration–time data. Owing to the long half-life of ODN in humans, PK sampling schemes used early in this study did not adequately capture the terminal elimination phase of the drug. For this reason, apparent terminal half-life values and AUC0–∞ values (the calculation of which requires terminal elimination rate constant) were determined only for those subjects in which at least three ODN plasma concentrations were collected at 96 h postdose or greater, with at least one time point collected at 240 h (approximately three times the estimated half-life of ODN) or greater. When possible, predose concentrations from the next treatment period were used to inform PK parameters for subjects in panels in which the sampling scheme was insufficient to capture the terminal elimination phase adequately. However, even after including these predose samples as appropriate, it was still not possible to estimate terminal elimination rate constants accurately for many subjects, when applying the criteria stated above. In addition, AUC0–168 h values were not calculated for subjects for whom PK samples were not collected at 168 h postdose.
Values of Cmax,overall and Tmax,overall were obtained by inspection of the plasma concentration data. In order to characterize the initial absorption peak better in cases of substantive secondary peaks that were observed in some subjects at all dose levels and in both males and females in this study, the maximal plasma concentration on day 1 (Cmax,day1) and time of maximal plasma concentration on day 1 (Tmax,day1) were also obtained by inspection of the plasma concentration data for time points with nominal collection times less than 24 h. Provided that the observed time of Tmax did not differ in a meaningful way from the nominal plasma sampling time (for both overall and day 1 Cmax/Tmax assessments), nominal plasma sampling times were used to determine Tmax. Values for C168 h were assessed from the plasma concentrations determined for the nominal sampling times at 168 h for those subjects in whom PK samples were collected at that time. Renal clearance was calculated as the ratio of the amount excreted unchanged in urine through 24 h to AUC0–24 h.
In study II, the plasma concentration profile of ODN was measured over 240 h following dosing. Pharmacokinetic parameters that were evaluated included AUC0–∞, Cmax,overall, Cmax,day1, Tmax,overall, Tmax,day1, AUC0–24 h, AUC0–168 h, C24 h, C168 h and apparent terminal half-life.
Pharmacodynamic assessments
Enzyme-linked immunosorbent assays were utilized to measure levels of sCTx, uNTx/Cr biomarkers of bone resorption. The sCTx levels were determined using CrossLaps® ELISA (IDS Inc., Fountain Hills, AZ, USA). The intra- and interassay coefficients of variation for this assay are <11 and <3%, respectively, and the LLOQ = 0.087ng ml−1. The uNTx was determined using second morning void specimens obtained in the fasted state using the Osteomark uNTx ELISA (Alere Inc., Waltham, MA, USA). The intra- and interassay coefficients of variation for this assay are 7.6 and 4.0%, respectively, with a LLOQ = 10 mm bone collagen equivalents. The uNTx data were normalized to creatinine (TECO Diagnostics, Anaheim, CA, USA). Creatinine in urine was measured using the Konelab assay (Thermo Fisher Scientific, Vantaa, Finland). The intra- and interassay coefficients of variation for this assay are 1.0 and 0.8%, respectively, and the LLOQ = 0.002 mmol l−1.
Pharmacokinetic/pharmacodynamic methods
Pharmacokinetic/pharmacodynamic data (ODN plasma concentration and uNTx/Cr) were modelled using a population sigmoidal inhibitory Emax equation, as follows:
where C is plasma concentration, E0 is baseline, Emax is maximal drug effect, EC50 is the concentration at which response is half-maximal, s is the sigmoidicity factor (a constant that modulates the steepness of the response curve), and the η parameters represent intersubject variability terms [incorporated as follows: individual value = typical value × exp(η)]. Parameter estimates were obtained using NONMEM (ICON Development Solutions, Ellicott City, MD, USA). All available data (panels A, B and C) from active subjects in study I, including predose measurements, were used for fitting. The assumption inherent in this equation – that there is no meaningful time delay in PD response relative to PK – was confirmed by an examination of the hysteresis plots of data from the PK/PD analysis in the multiple dose study [23].
Statistical analysis
All statistical analyses were performed using SAS version 9.1 (SAS Institute Inc., Cary, NC, USA). In study I, summary statistics were provided for all available ODN PK parameters (AUC0–24 h, AUC0–168 h, AUC0–∞, C24 h, C168 h, Cmax,overall, Tmax,overall, Cmax,day1, Tmax,day1 and apparent terminal half-life) at each examined dose level of ODN. The parameters (AUC0–24 h, AUC0–168 h, AUC0–∞, C24 h, C168 h, Cmax,overall, and Cmax,day1) were further analysed with separate linear mixed-effect models. In young healthy males in panels A and B, the model included panel and treatment within panel as fixed effects and subject within panel as a random effect. It is recognized that, for this design, treatment and period are partly confounded. In postmenopausal females in panel C, the model included treatment as a fixed effect and subject as a random effect.
Food effect (a high-fat standard breakfast) following a single dose of 25 mg ODN in panel B was assessed via a linear mixed-effect model with treatment (fed and fasted) as a fixed effect and subject as a random effect. Food effect (a high-fat standard breakfast) following a single dose of 100 and 200 mg ODN in panel D was assessed via an analysis of variance (anova) model with treatment (fed and fasted) as a factor. In order to make a preliminarily comparison of the PK of ODN in males and females, an anova model with gender as a factor was fitted separately at ODN 50 and 100 mg.
An exploratory analysis on dose proportionality was conducted separately on PK parameters (Cmax,overall, AUC0–24 h and C24 h) in the fasted state and in the fed state. In the fasted state, dose proportionality for Cmax,overall was assessed with the reduced model, with subject as a random effect and ln(dose) as a covariate, and dose proportionality for AUC0–24 h and C24 h was assessed with the full model, with subject within panel as a random effect, panel as a fixed effect and ln(dose) (log-transformed dose) and panel-by-ln(dose) interaction as covariates. In the fed state, dose proportionality for PK parameters across the dose range of 25–300 mg was assessed with a linear mixed model on log-transformed values, with subject as a random effect and ln(dose) (log-transformed dose) as a covariate. An estimate of the slope associated with ln(dose) and the corresponding 95% CI was obtained from above models. A mean regression line of PK parameters vs. dose was plotted on the linear scale after back-transformation from log scale. A straight regression line indicates consistency with dose proportionality, whereas curvature in the regression line suggests departure from dose proportionality. Ninety-five per cent Scheffé confidence bands were drawn around the regression line, which displayed the variability in the regression line.
The sCTx and uNTx/Cr data were analysed in separate linear mixed-effects models for males (panels A and B) and females (panel C), because no between-gender comparisons were planned. In males, the model included natural log-transformed baseline as a continuous covariate, panel and treatment within panel as fixed effects, and subject within panel as a random effect. For uNTx/Cr, this model also included the comparison between 25 mg in the fed and fasted states. In females, the model included log-baseline, treatment as a fixed effect, and subject as a random effect. Within each panel, active doses were compared with placebo. There were no statistically significant differences in placebo responses between panels A and B. Data were analysed on the log scale, back-transformed and reported as the percentage change.
Any sCTx and uNTx values below the lower limit of quantification (0.087 ng ml−1 and 10 nmol bone collagen equivalents l−1, respectively) were assigned half of the LLOQ value. Data for subjects who had values below the LLOQ at both baseline and postdose time points were excluded from the analysis, because the percentage change from baseline could not be clearly defined.
In study II (panel E), a linear mixed-effects model with fixed effects for sequence, period, treatment and subject within sequence as a random effect was used to analyse the ODN PK parameters (AUC0–∞, Cmax,overall, Cmax,day1, AUC0–24 h, AUC0–168 h, C24 h and C168 h). In order to compare the ODN AUC0–∞ with fed and fasted dosing, the geometric mean ratio (fed/fasted) with corresponding 90% CI was calculated based on the above mixed-effects model. The Cmax,overall, Cmax,day1, AUC0–24 h, AUC0–168 h, C24 h and C168 h of ODN were analysed in a similar fashion to ODN AUC0–∞. Summary statistics are provided for Tmax,overall, Tmax,day1 and apparent terminal half-life.
Results
Safety and tolerability
Forty-four subjects were enrolled in and completed these studies. Clinical safety data from the first study indicate that a single dose up to 600 mg in the fasted state and up to 300 mg administered with food was well tolerated. All AEs were mild to moderate, with the exception of one AE of gastroenteritis, which was considered severe. This subject received subsequent doses of ODN without recurrence. The most common AEs reported in this study by subjects who received ODN included headache, flu-like symptoms and sore throat. Adverse experiences considered by the investigator possibly to be drug related were headache, fatigue, nausea, decreased appetite, increased appetite, dry mouth and abdominal discomfort. No serious AEs were reported. No subjects discontinued the study.
Laboratory AEs occurred in five subjects, none of which was considered by the investigator to be drug related. A review of safety laboratory results, ECGs and vital signs revealed no drug-related trends.
Pharmacokinetics
The fasted plasma concentration–time profile and principal PK parameters in healthy young males and postmenopausal females following single oral dose administration of ODN (2–600 mg) are summarized in Table 1 and Figure 2.
Table 1.
Geometric mean (95% CI) pharmacokinetic parameters of ODN in healthy young males and postmenopausal females following single oral doses of ODN
| Dose | Panel | AUC0–24 h (μm h)† | AUC0–168 h (μm h)† | AUC0–∞ (μm h)† | C24 h (nm)† | C168 h (nm)† | Cmax day1 (nm)† | Cmax overall (nm)† | Tmax day1 (h)† | Tmax overall (h)‡ | Apparent terminal half-life (h)§ |
|---|---|---|---|---|---|---|---|---|---|---|---|
| Study I | |||||||||||
| 2 mg | A | 0.7 (0.5, 0.9) | ND | ND | 28.0 (21.1, 37.1) | 2.9 (1.6, 5.2) | 40.7 (31.4, 52.8) | 40.5 (31.2, 52.6) | 6 (4, 6) | 6 (4, 6) | ND |
| 5 mg | B | 1.5 (1.2, 2.0) | ND | ND | 61.4 (46.3, 81.2) | 7.6 (4.3, 13.3) | 77.6 (59.9, 100.6) | 78.7 (60.7, 102.1) | 5 (4, 9) | 5 (4, 9) | ND |
| 10 mg | A | 2.5 (1.9, 3.1) | 8.8 (6.2, 12.5) | ND | 119 (90.3, 158.4) | 12.1 (6.9, 21.3) | 119.6 (92.2, 155.1) | 125.1 (96.5, 162.3) | 6 (4, 16) | 15 (4, 32) | ND |
| 25 mg | B | 3.2 (2.5, 4.1) | 14.2 (10.0, 20.2) | ND | 147 (111.3, 195.6) | 20.9 (11.8, 36.9) | 154.7 (119.2, 200.8) | 160.4 (123.6, 208.3) | 13 (6, 16) | 13 (6, 48) | ND |
| 25 mg fed* | B | 6.7 (5.2, 8.6) | ND | ND | 310.1 (233.9, 411.0) | ND | 344.7 (265.6, 447.4) | 378.6 (291.6, 491.5) | 6 (4, 12) | 18 (6, 48) | ND |
| 50 mg | A | 4.7 (3.7, 6.1) | 20.2 (14.2, 28.7) | ND | 221.1 (167.0, 292.8) | 29.0 (16.3, 51.4) | 254 (195.9, 329.3) | 258.8 (199.5, 335.7) | 6 (4, 9) | 6 (6, 24) | ND |
| 100 mg | B | 6.4 (5.0, 8.2) | 29.4 (20.7, 41.8) | ND | 210.8 (159.2, 279.1) | 44.4 (25.1, 78.6) | 353.5 (272.6, 458.3) | 349.8 (269.7, 453.7) | 4 (4, 16) | 4 (4, 6) | ND |
| 200 mg | A | 7.7 (6.0, 9.9) | ND | ND | 392.2 (248.7, 436.0) | ND | 425.4 (328.1, 551.5) | 425.4 (327.9, 551.7) | 5 (4, 6) | 5 (4, 6) | ND |
| 400 mg | A | 10.1 (7.9, 13.0) | 35.3 (25.3, 49.2) | 40.8 (24.4, 68.2) | 409.6 (309.1, 543.0) | 54.5 (31.5, 94.4) | 531 (409.2, 689.2) | 528.8 (407.3, 686.5) | 6 (4, 16) | 6 (4, 16) | 43.6 (11.0) |
| 600 mg | B | 9.4 (7.3, 12.0) | 33.8 (24.8, 46.0) | 43.9 (26.3, 73.4) | 392.8 (296.7, 520.2) | 53.2 (31.1, 91.0) | 477.3 (368.1, 618.9) | 482.2 (371.8, 625.4) | 3 (2, 4) | 4 (2, 24) | 59.2 (16.0) |
| 50 mg | C | 3.0 (2.2, 4.1) | ND | ND | 139.1 (93.6, 206.8) | ND | 176.7 (118.3, 263.9) | 183.0 (122.6, 273.2) | 12 (5, 16) | 20 (5, 72) | ND |
| 100 mg | C | 5.5 (4.1, 7.6) | 26.7 (21.7, 32.9) | 34.3 (26.1, 45.2) | 261.3 (175.9, 388.4) | 86.9 (57.2, 132.0) | 350.1 (234.4, 522.7) | 353.0 (236.5,527.0) | 2 (2, 5) | 2 (2, 5) | 77.5 (20.9) |
| 100 mg fed | D | 11.3 (10.0, 12.8) | 44.0 (37.7, 51.4) | 49.5 (40.1, 61.1) | 507.4 (442.3, 582.1) | 58.1 (34.6, 97.5) | 630.4 (533.3, 745.2) | 630.4 (533.2, 745.4) | 8 (5, 12) | 8 (5, 12) | 48.2 (11.7) |
| 200 mg fed | D | 13.6 (12.0, 15.3) | 53.8 (46.1, 62.9) | 61.7 (50.0, 76.2) | 571.0 (497.7, 655.1) | 82.5 (49.2, 138.4) | 738.5 (624.7, 873.0) | 738.5 (624.6, 873.2) | 6 (5, 12) | 6 (5, 12) | 50.5 (13.4) |
| 300 mg fed | D | 16.1 (14.2, 18.1) | 63.8 (54.6, 74.6) | 74.8 (60.6, 92.3) | 709.8 (618.7, 814.4) | 97.0 (57.8, 162.7) | 839.2 (709.8, 992.0) | 843.3 (713.2, 997.0) | 5 (4, 9) | 6 (4, 24) | 62.6 (12.0) |
| Study II | |||||||||||
| 100 mg fasted | E | 7.5 (6.2, 9.0) | 33.0 (26.9, 40.5) | 43.8 (27.7, 69.3) | 326.7, (268.3, 397.8) | 76.5 (50.2, 116.6) | 423.1 (325.0, 550.7) | 423.1 (325.0, 550.7) | 4 (2, 4) | 4 (2, 4) | 77.8 (26.2) |
| 100 mg fed low fat | E | 9.3 (7.7, 11.2) | 42.2 (34.4, 51.7) | 60.9 (38.0, 97.5) | 392.3 (322.2, 477.7) | 110.4 (72.4, 168.2) | 506.7 (389.2, 659.5) | 506.7 (389.2, 659.5) | 4 (3, 5) | 4 (3, 5) | 75.9 (36.9) |
Abbreviations are as follows: AUC0–24 h, area under the curve0-24 hours; AUC0–168 h, area under the curve0-168 hours; AUC0–∞, area under the curve0-infinity; CI, confidence interval; C24 h, Concentration at 24 hours; C168 h, Concentration at 168 hours; Cmax,overall, Maximum concentration, overall; ND, not determined; ODN, odanacatib.
Subjects were given a repeat oral dose of 25 mg ODN following a standard high-fat breakfast.
Back-transformed least-squares mean and 95% CI from mixed-effects model performed on natural log-transformed values. In young healthy males (panels A and B), the model included panel and treatment within panel as fixed effects and subject within panel as a random effect. In postmenopausal females (panel C), the model included treatment as a fixed effect and subject as a random effect. In young healthy males with treatments given with a high-fat breakfast (panel D), the model included treatment as a fixed effect and subject as a random effect.
Median; minimum, maximum.
Harmonic mean; jack-knife SD. The AUC0–168 h, C168 h values, apparent terminal half-life and AUC0–∞ could not be determined for subjects with insufficient PK sampling.
Figure 2.
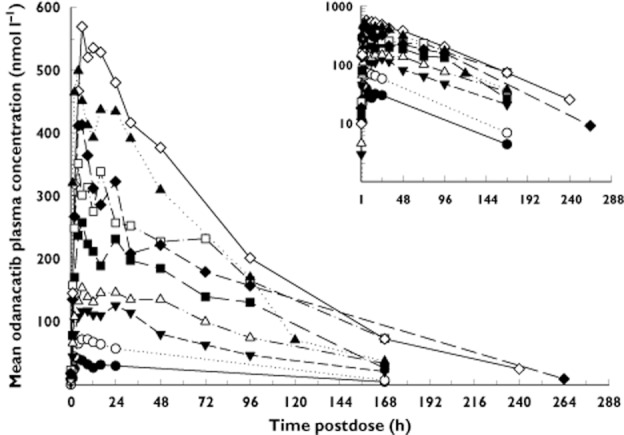
Arithmetic mean odanacatib plasma concentrations vs. time postdose following single dose administration of 2–600 mg in the fasted state to young healthy male healthy subjects (inset: semi logarithmic scale). One data point from the 5 mg treatment group (time 0, value <0.1 nmol l−1) is not included in the inset plot for scaling purposes.  , 2 mg;
  , 5 mg;
  , 10 mg;
  , 25 mg;
  , 50 mg;
  , 100 mg;
  , 200 mg;
  , 400 mg;
  , 600 mg
Single dose PK data for ODN indicate that ODN is absorbed with an initial plasma concentration peak ∼4–6 h postdose (Cmax,day1 and Tmax,day1 values). The plasma concentration–time profiles largely exhibited a monophasic decline after peaking, although some subjects in the first study exhibited a prominent secondary peak in the PK profile around ∼24–48 h postdose that sometimes exceeded the initial peak in size, with the majority of the AUC attributable to the long monophasic decline phase. The apparent terminal half-life of ODN ranged from 44 to 78 h.
Estimates and the corresponding 95% confidence bands of the linear regressions from the power-law models used to assess dose proportionality of ODN Cmax,overall, AUC0–24 h and C24 h in the fasted state and in the fed state are shown in Figure S1a and b. The direction of curvature indicates that ODN PK parameters increased in a less than dose-proportional manner from 2 to 600 mg (Figure S1a) in the fasted state and from 25 to 300 mg (Figure S1b) in the fed state.
The estimate (95% CI) of the slope of Cmax,overall across the smaller dose range of 25–200 mg was 0.694 (0.474, 0.914) and the point estimate (90% CI) of the geometric mean ratio (5 mg/2 mg) was 0.78 (0.59, 1.04) for dose-adjusted Cmax,overall. The point estimates (90% CI) of the geometric mean ratio (10 mg/2 mg) were 0.71 (0.576, 0.87) for dose-adjusted AUC0–24 h and 0.86 (0.68, 1.08) for dose-adjusted C24 h.
The effect of a high-fat standard breakfast on the PK profile of ODN at 25, 100 and 200 mg dose levels in young healthy males is shown in (Table 2 and Figure 3A–C). A standard high-fat breakfast produced an increase in PK parameters (AUC0–24 h, Cmax,day1, Cmax,overall C24 h and Tmax,overall) of approximately twofold relative to administration in the fasted state (Table 2 and Figure 3A–C). At ODN 25 mg, the high-fat meal increased AUC0–24 h by approximately 110%, Cmax,overall by 130% and C24 h by 110%. This is likely to be a maximal estimate of the effect of the high-fat meal food for ODN, because the concentration profiles in the 25 mg fed period had nonzero predose concentrations carried over from prior treatments, such that these results may slightly overestimate the extent of the food effect at 25 mg (e.g. note that at 100 and 200 mg, administration of high-fat meals with ODN resulted in smaller increases in PK parameters). Although median Tmax,overall was 18 h at the 25 mg dose level in the fed state, 5 h longer compared with that in the fasted state (13 h), this result appears to reflect a modest shift in the relative size of the initial absorption peak relative to secondary peaks rather than any meaningful delay in the initial absorption peak. Median Tmax values on day 1 were the same (6 h) in both the fed state and the fasted state. At ODN 100 mg, the high-fat condition increased AUC0–24 h by approximately 70%, Cmax,day1 and Cmax,overall by 80% and C24 h by 130%.
Table 2.
Effect of food on ODN pharmacokinetic parameters following administration of single oral doses of ODN of 25, 100 and 200 mg to young healthy male subjects
| PK parameter | Comparison (fed/fasted)† | Comparison (fed/fasted) | ||
|---|---|---|---|---|
| 25 mg high-fat meal | 100 mg high-fat meal | 200 mg high-fat meal | 100 mg low-fat meal | |
| AUC0–24 h (μm h) * | 2.11 (1.56, 2.85) | 1.73 (1.37, 2.18) | 1.87 (1.46, 2.40) | 1.25 (0.94, 1.66) |
| AUC0–168 h (μm h)* | ND | 1.40 (1.00, 1.95) | ND | 1.28 (0.97, 1.68) |
| AUC0–∞ (μm h)* | ND | ND | ND | 1.39 (0.98, 1.98) |
| C24 h (nm)* | 2.10 (1.58, 2.80) | 2.30 (1.58, 3.34) | 1.87 (1.42, 2.45) | 1.2 (0.89, 1.63) |
| C168 h (nm)* | ND | 0.95 (0.44, 2.07) | ND | 1.44 (0.98, 2.13) |
| Cmax, day1 (nm)* | 2.23 (1.56, 3.18) | 1.76 (1.37, 2.24) | 1.82 (1.39, 2.40) | 1.20 (0.82, 1.74) |
| Cmax, overall (nm)* | 2.36 (1.67, 3.34) | 1.76, (1.37, 2.24) | ND | 1.20 (0.82, 1.74) |
| Apparent terminal half-life (h)‡ | ND | 48.2 (11.7) | 50.5 (13.4) | 75.9 (36.9) |
Abbreviations are as follows: CI, confidence interval; AUC0-24 h, aea under the curve0-24 hours; AUC0-168 h, area under the curve0-168 hours; AUC0-∞, area under the curve0-infinity; C24 h, concentration at 24 hours; C168 h, concentration at 168 hours; Cmax,day1, maximum concentration, day1; ND, not determined; ODN, odanacatib Tmax,day1, time to maximum plasma concentration, day 1.
Back-transformed least-squares mean and 90% CI from mixed-effects model performed on natural log-transformed values.
Comparison at 25 mg ODN was made from within subjects, and comparisons at 100 and 200 mg ODN were made from between subjects.
Harmonic mean, jack-knife SD.
Figure 3.

Arithmetic mean odanacatib plasma concentrations vs. time postdose following single dose administration of 25 mg (A), 100 mg (B) and 200 mg (C) in the fasted and fed (high-fat meal) states to young healthy male subjects (inset, semi-logarithmic scale) and in healthy young males following a single oral dose of 100 mg odanacatib (D) taken with and without a light breakfast. (A)  , 25 mg Fasted;
  , 25 mg Fed; (B)
  , 100 mg Fasted;
  , 100 mg Fed; (C)
  , 200 mg Fasted;
  , 200 mg Fed; (D) ○, Fasted; ▿, Low-fat Breakfast
In the light meal assessment, healthy male subjects received 100 mg ODN or placebo in the fasted state and following a low-fat breakfast, revealing a more modest food effect than that seen with a high-fat meal, as can be seen in the plasma concentration curves (Figure 3D). Following the administration of a 100 mg dose to young healthy men, geometric mean AUC0–∞ and Cmax,overall were elevated by 39 and 20%, respectively, in men during low-fat breakfast fed conditions relative to data in men during the fasted state (Table 2).
Administration of 50 and 100 mg doses to healthy postmenopausal women revealed exposures similar to those of the younger male subjects. Overall, postmenopausal females appeared to have somewhat lower AUC0–24 h, Cmax and C24 h values compared with males following an ODN dose of 50 mg, but PK parameters in females were similar to those of males following an ODN dose of 100 mg (Table 1).
The mean percentage excretion of ODN in the urine and renal clearance was observed to be low. The mean percentage (±SD) excreted after administration of 50 mg ODN to healthy young males and healthy postmenopausal women was identical (0.4 ± 0.3%). Renal clearance (in litres per hour) was also low (0.09 ± 0.07 for healthy young males and 0.16 ± 0.17 for postmenopausal women). These results are consistent with only a small portion of the administered dose being recovered intact in urine.
Pharmacodynamics
Summary statistics and comparisons of ODN vs. placebo for sCTx at 24 and 168 h postdose are provided in Table 3. Time-profile plots of the percentage change from baseline during the 168 h postdose period for all examined fasted ODN doses are given for healthy males in Figure 4A and for postmenopausal women in Figure 4B. The sCTx decreased by 51% at 24 h postdose with 5 mg ODN compared with placebo. Similar or greater decreases were evident at 24 h postdose with the higher doses of ODN in young healthy males. Reductions of 66 and 43% at 24 h postdose compared with placebo were observed after single dose administration of 50 and 100 mg ODN, respectively, in postmenopausal females. The sCTx at 168 h postdose decreased relative to placebo by 21% at 10 mg, by 66% at 25 mg and by 41% at 50 mg in young healthy males. The decrease relative to baseline was 70% at 50 mg in postmenopausal females; there were insufficient subjects (n = 2) to permit a meaningful comparison with placebo at the 168 h time point for the postmenopausal women.
Table 3.
Summary statistics as a percentage change from baseline of serum CTx at 24 and 168 h postdose following single doses of of ODN administered to healthy male and postmenopausal female subjects
| Treatment | Panel | CTx at 24 h | CTx at 168 h‡ | ||||
|---|---|---|---|---|---|---|---|
| n | Least-squares mean (95% CI) | Difference (95% CI) compared with placebo | n | Least-squares mean (95% CI) | Difference (95% CI) compared with placebo | ||
| Male | |||||||
| Placebo | A | 7† | −13.5 (−32.5, 11.0) | — | 4 | −3.7 (−30.5, 33.5) | — |
| Placebo | B | 8 | −4.4 (−24.6, 21.1) | — | 4 | 21.2 (−12.5, 67.9) | — |
| ODN 2 mg | A | 0 | ND | ND | 0 | ND | ND |
| ODN 5 mg | B | 6 | −55.8 (−66.0, −42.6) | −51.4 (−72.1, −31.8) | 6 | −2.6 (−26.8, 29.8) | −23.7 (−61.5, 13.3) |
| ODN 10 mg | A | 6 | −65.0 (−73.1, −54.4) | −51.5 (−70.6, −33.6) | 6 | −24.9 (−43.8, 0.4) | −21.2 (−50.9, 7.8) |
| ODN 25 mg | B | 6 | −72.8 (−79.1, −64.5) | −68.4 (−86.8, −51.3) | 6 | −44.7 (−58.6, −26.3) | −65.9 (−97.2, −36.6) |
| ODN 50 mg | A | 6 | −72.0 (−78.4, −63.5) | −58.5 (−76.3, −42.0) | 6 | −44.6 (−58.8, −25.5) | −41.0 (−68.4, −14.8) |
| ODN 100 mg | B | 6 | −61.7 (−70.8, −49.8) | −57.3 (−78.1, −37.9) | 0 | ND | ND |
| ODN 200 mg | A | 6 | −69.3 (−76.5, −60.0) | −55.9 (−73.8, −39.2) | 0 | ND | ND |
| ODN 400 mg | A | 6 | −72.2 (−78.6, −63.8) | −58.7 (−76.5, −42.2) | 0 | ND | ND |
| ODN 600 mg | B | 6 | −72.2 (−78.7, −63.8) | −67.8 (−86.4, −50.7) | 0 | ND | ND |
| ODN 25 mg (fed) | B | 0 | ND | ND | 0 | ND | ND |
| Placebo | C | 4 | −12.1 (−39.0, 26.6) | — | 2 | −16.3 (−51.0, 43.0) | — |
| ODN 50 mg | C | 6 | −78.0 (−84.1, −69.5) | −65.9 (−95.6, −40.2) | 6 | −69.6 (−77.6, −58.7) | −53.3 (−91.9, −19.8) |
| ODN 100 mg | C | 4*,† | −54.9 (−69.7, −32.8) | −42.7 (−79.8, −8.7) | ND | ND | ND |
Between-subject coefficient of variation ranged from 8 to 63% across panels/doses/time points; within-subject coefficient of variation ranged from 21 to 33% across panels/time points. There were no statistically significant differences between panel A and panel B placebo. Abbreviations are as follows: CI, confidence interval; CTx, C-terminal telopeptide of type I collagen; ND, CTx not measured at this dose level/time point; ODN, odanacatib; —, comparison not applicable. By design, CTx was not measured during the 2 and 25 mg fed treatment periods.
One subject with no reportable result.
One subject with values below the level of quantification at both baseline and 24 h; the percentage change could not be defined clearly.
CTx levels at 168 h were obtained as the predose measurement in the succeeding treatment period and thus are available only for 5, 10, 25 and 50 mg treatment periods; the number of available placebo observations is correspondingly reduced.
Figure 4.

Percentage change (observed geometric mean ± SEM) from baseline of serum CTx during the 168 h postdose period in panels A and B following administration of single oral doses of odanacatib (ODN) to healthy male subjects (A) and in panel C following administration of single oral doses of ODN to healthy postmenopausal female subjects (B). Percentage change (observed geometric mean ± SEM) from baseline of urinary NTx/Cr during the 168 h postdose period in panels A and B following administration of single oral doses of ODN to healthy male subjects (C) and in panel C following administration of single oral doses of ODN to healthy postmenopausal female subjects (D). (A), □, Panel A: Placebo (n = 2 to 8);  , Panel B: Placebo (n = 2 to 8);
  , Panel A: Odanacatib 10 mg (n = 6);
  , Panel B: Odanacatib 5 mg (n = 6); ▵, Panel A: Odanacatib 50 mg (n = 6); ▴, Panel B: Odanacatib 25 mg (n = 6);
  , Panel A: Odanacatib 200 mg (n = 6); ⋆, Panel B: Odanacatib 100 mg (n = 6); ○, Panel A: Odanacatib 400 mg (n = 6); •, Panel B: Odanacatib 600 mg (n = 6); (B), □, Panel C: Placebo (n = 2 to 4); ▴, Panel C: Odanacatib 50 mg (n = 6); ⋆, Panel C: Odanacatib 100 mg (n = 6); (C), □, Panel A: Placebo (n = 6 to 10);
  , Panel B: Placebo (n = 6 to 8);
  , Panel A: Odanacatib 2 mg (n = 6);
  , Panel B: Odanacatib 5 mg (n = 6); ▵, Panel A: Odanacatib 10 mg (n = 6); ▴, Panel B: Odanacatib 25 mg (n = 6);
  , Panel A: Odanacatib 50 mg (n = 6); ⋆, Panel B: Odanacatib 100 mg (n = 6); ○, Panel A: Odanacatib 200 mg (n = 6); •, Panel B: Odanacatib 600 mg (n = 6); ◃, Panel A: Odanacatib 400 mg (n = 6); ◂, Panel B: Odanacatib 25 mg (n = 6); (D), □, Panel C: Placebo (n = 2 to 3); ▴, Panel C: Odanacatib 50 mg (n = 5 to 6); ⋆, Panel C: Odanacatib 100 mg (n = 6). Cr, creatinine; CTx, C-terminal telopeptide of type I collagen; NTx, N-terminal telopeptide of type I collagen
Summary statistics and comparisons of ODN vs. placebo for uNTx/Cr at 24 and 168 h postdose are provided in Table 4. Time-profile plots of the percentage change from baseline during the 168 h postdose period for all examined ODN doses are given for healthy males in Figure 4C and for postmenopausal women in Figure 4D. The uNTx/Cr decreased by 11% at 24 h postdose with 2 mg ODN compared with placebo. Similar or greater decreases were evident 24 h postdose with higher doses of ODN in young healthy males. Reductions relative to placebo were approximately 51 and 57% at 24 h after single dose administration of 50 and 100 mg ODN, respectively, in postmenopausal females. The uNTx/Cr at 168 h postdose decreased by 61% at 10 mg, by 62% at 25 mg, by 88% at 50 mg and by 44% at 100 mg in young healthy males. The decrease relative to baseline was 78% at 50 mg in postmenopausal females; there were insufficient subjects (n = 2) to permit a meaningful comparison with placebo at the 168 h time point for the postmenopausal women. There was no meaningful difference between fed and fasted states in the percentage change from baseline for uNTx/Cr at 24 h postdose following ODN 25 mg. The observed mean reductions in uNTx/Cr at 24 h were −68.3 and −65.1% for the fasted and fed 25 mg administration, respectively.
Table 4.
Summary statistics as a percentage change from baseline of urine NTx/Cr at 24 and 168 h postdose following single doses of of ODN administered to healthy male and postmenopausal female subjects
| Treatment | Panel | NTx/Cr at 24 h | NTx/Cr at 168 h¶ | ||||
|---|---|---|---|---|---|---|---|
| n | Least-squares (95% CI) | Difference (95% CI) compared with placebo | n | Least-squares mean (95% CI) | Difference (95% CI) compared with placebo | ||
| Male | |||||||
| Placebo | A | 8* | −4.8 (−32.0, 33.3) | — | 6 | 25.8 (−13.3, 82.4) | — |
| Placebo | B | 8 | 0.3 (−27.9, 39.6) | — | 6 | 17.8 (−18.7, 70.8) | — |
| ODN 2 mg | A | 6 | −15.6 (−41.9, 22.5) | −10.9 (−51.5, 29.3) | 6 | 11.7 (−23.2, 62.3) | −14.1 (−77.9, 48.7) |
| ODN 5 mg | B | 6 | −35.5 (−55.4, −6.6) | −35.8 (−72.5, −0.8) | 6 | 4.6 (−27.9, 51.7) | −13.2 (−73.1, 45.7) |
| ODN 10 mg | A | 6 | −65.2 (−76.0, −49.5) | −60.4 (−91.0, −32.8) | 6 | −35.1 (−55.2, −5.7) | −60.8 (−113.8, −12.1) |
| ODN 25 mg | B | 6 | −68.3 (−78.1, −54.0) | −68.6 (−98.9, −41.5) | 6 | −43.7 (−61.1, −18.3) | −61.5 (−110.1, −17.2) |
| ODN 50 mg | A | 6 | −78.8 (−85.4, −69.3) | −74.0 (−101.2, −50.3) | 6 | −62.1 (−74.0, −44.7) | −87.9 (−136.2, −46.1) |
| ODN 100 mg | B | 6 | −74.5 (−82.4, −62.9) | −74.8 (−104.5, −48.7) | 6 | −26.5 (−50.0, 7.9) | −44.4 (−98.3, 6.3) |
| ODN 200 mg | A | 6 | −82.2 (−87.8, −74.1) | −77.5 (−103.8, −54.7) | 0 | ND | ND |
| ODN 400 mg | A | 6 | −75.8 (−83.3, −64.9) | −71.0 (−99.5, −46.1) | 0 | ND | ND |
| ODN 600 mg | B | 6 | −73.9 (−82.0, −62.1) | −74.2 (−103.4, −48.5) | 0 | ND | ND |
| ODN 25 mg (fed) | B | 6 | −65.1 (−75.9, −49.5) | 3.1 (−12.2, 18.6)‡ | 0 | ND | ND |
| Female | |||||||
| Placebo | C | 3† | −13.0 (−49.5, 50.0) | — | 2 | −32.7 (−58.4, 8.9) | — |
| ODN 50 mg | C | 6 | −63.8 (−77.4, −41.9) | −50.8 (−101.4, −7.4) | 5§ | −78.4 (−84.1, −70.8) | −45.7 (−73.4, −21.8) |
| ODN 100 mg | C | 4§ | −70.4 (−83.4, −47.2) | −57.4 (−110.4, −13.9) | 0 | ND | ND |
Between-subject coefficient of variation ranged from 15 to 90% across panels/doses/time points; within-subject coefficient of variation ranged from 23 to 43% across panels/time points. There were no statistically significant differences between panel A and panel B placebo. Abbreviations are as follows: CI, confidence interval; CTx, C-terminal telopeptide of type I collagen; ND, NTx not measured at this dose level/time point; ODN, odanacatib; Urine NTx/Cr, urine N-terminal telopeptide of type I collagen normalized to creatinine; —, comparison not applicable.
Includes two subjects with one observation in each of two periods; replicate values were averaged prior to analysis.
One subject with no reportable result.
Comparison between ODN 25 mg fed and ODN 25 mg fasted.
Two subjects with values below the level of quantification at both baseline and 24 h; the percentage change could not be defined clearly.
NTx levels at 168 h were obtained as the predose measurement in the succeeding treatment period. Thus, not all dose levels have 168 h measurements; numbers of placebo observations are correspondingly reduced.
Pharmacokinetic/pharmacodynamic analysis
Parameter estimates from the PK/PD analysis of uNTx/Cr are provided in Figure 5. The experimental data were well represented by a sigmoidal maximal drug effect (Emax) model. The estimate of half-maximal effective concentration (EC50) was 43.8 nm, and the maximal reduction in uNTx/Cr was estimated to be ∼80%.
Figure 5.
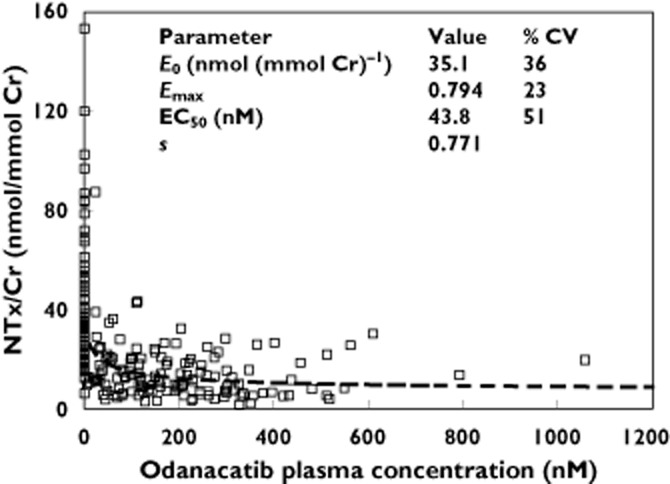
Pharmacokinetic/pharmacodynamic data and population mean model fit for NTx/Cr following single doses of odanacatib. Abbreviations: Cr, creatinine; CV, coefficient of variation; E0, baseline; EC50, half-maximal effective concentration; Emax, fractional maximal drug effect; NTx, N-terminal telopeptide of type I collagen; s, sigmoidicity factor. □, Observed;  , Model Fit
Discussion
These double-blind, placebo-controlled, single oral dose studies describe the first administration of ODN, a selective CatK inhibitor in man. The primary purpose of these studies was to assess the safety and tolerability and to characterize the PK and initial PD parameters of rising doses of ODN in healthy young men and postmenopausal women. Doses of 2–600 mg administered as single oral doses were evaluated, and urinary excretion across the 2–50 mg single oral dose range was examined. The effect of food (high fat and low fat) on PK of ODN was also examined.
Based on preclinical predictions from multiple species, the study was designed with the expectation that ODN would have a relatively short apparent terminal half-life, suitable for once daily dosing [26]. However, results from panels of the first study indicated that ODN had an unexpectedly long apparent terminal half-life of approximately 40–80 h. This long half-life required adjustments in sampling schemes and washout times during the course of the study to allow for improved PK parameter assessment. As a result, estimates of half-life from this study may underestimate the true apparent terminal half-life.
Another consequence of the unexpectedly long half-life of ODN was measurable plasma ODN concentrations from prior treatment at predose of the next treatment. When possible, these predose values were used to inform PK parameters for the prior treatment to characterize exposure and C168 h better. Pharmacokinetic parameters were not adjusted on the basis of predose concentrations because, in general, half-lives could not be calculated accurately for those profiles owing to insufficient PK sampling. Thus, the PK parameters reported represent the exposures experienced by subjects in this study, though those exposures may be somewhat higher than would have been observed in the absence of measurable predose concentrations.
Assessment of dose proportionality of the available PK data indicates that exposures of ODN increased in a less-than-dose-proportional manner over the dose range of 2–600 mg. The degree of disproportionality is reduced at the lower dose range (2–10 mg). While these results indicate that less than dose-proportional PK are seen in the lower dose range, the point estimates and lower bounds of CIs from these analyses are closer to one than those obtained over the full dose range, suggesting that PK increases in this lower dose range are closer to dose proportional than those obtained at higher doses. Although PK sampling was not ideal to determine dose proportionality for PK parameters at 168 h, based on the available data it is likely that trends observed at 24 h extend to 168 h. These results are most likely to reflect reductions in bioavailability with increasing dose, because half-life did not appear to vary with doses. This phenomenon is most likely to be related to low solubility of ODN in gastrointestinal luminal fluids.
A standard high-fat breakfast consumed immediately prior to dosing for the 25–300 mg doses produced an increase in plasma concentrations averaging approximately twofold relative to fasted administration. This result is consistent with absorption-limited exposure related to low solubility of a somewhat hydrophobic drug and is likely to represent the maximal food effect. Similar to the discussion of the 25 mg results, delays in Tmax,overall in fed relative to fasted conditions appear largely to reflect shifts in the relative size of the initial and secondary peaks rather than a meaningful delay in the initial absorption peak. At ODN 200 mg, the high-fat conditions increased AUC0–24 h by approximately 90%, Cmax,day1 and Cmax,overall by 80% and C24 h by 90%. While administration with food increased both maximal concentrations and exposures, food intake did not appear to have a substantial impact on the shape of the profile. In particular, secondary peaks were observed when ODN was administered in both fasted and fed conditions, and there was no clear relation between the magnitude of the secondary peaks and food intake.
Odanacatib is a lipophilic compound with relatively poor solubility [27], and dosing with dietary fat increases bile secretion and gastrointestinal fluid volume, which may further increase dissolution for ODN. This interpretation is further supported by PK measurements following a low-fat breakfast, which resulted in a more modest increase in PK parameters. The 24 h change from baseline uNTx/Cr data for the 25 mg dose administered in both the fasted and the fed state in the same subjects was −68 and −65%, respectively. These changes are fairly comparable, and the food effect is not anticipated to alter efficacy for ODN at higher doses, because the biomarker response profile is relatively flat at steady state for doses ≥25 mg administered once weekly [23].
Overall, postmenopausal females appeared to exhibit modestly lower AUC0–24 h, Cmax and C24 h values in comparison to males following ODN doses of 50 mg, although PK parameters were more similar to males following doses of 100 mg ODN. Odanacatib appears to be absorbed at a moderate rate, with median Tmax,overall values in the fasted state ranging from 4 to 13 h across the dose levels from 2 to 600 mg, but with the Tmax,day1 typically ranging around 4–6 h, reflective of the initial absorption peak behaviour. Secondary peaks around 24 h or later were noted in many individual plasma concentration–time profiles and, in some cases, these secondary peaks exceeded the initial peak, resulting in longer Tmax,overall values. The cause of these secondary peaks is unclear from the present study results, but may reflect processes such as enterohepatic recycling or other transporter-mediated mechanisms of recirculation.
In comparing fed vs. fasted profiles and in some of the female vs. male profile comparisons, an apparent delay in Tmax,overall was noted, but on examination of the day 1 peaks, more similar Cmax,day1 and Tmax,day1 values were noted, suggesting that this delay in overall Tmax may primarily reflect modest shifts in the relative peak sizes of the initial and secondary peaks, such that the secondary peak exceeded the initial peak more often in females. These differences in Tmax values are likely to be a result of the multiple-peak absorption profile of ODN and are not considered likely to be clinically relevant, given the similarity in the day 1 peak behaviour in these comparisons.
After single dose administration of ODN, less than 1% of the oral ODN dose was excreted unchanged in urine at doses of 10–50 mg, suggesting that urinary excretion is not a significant route of elimination for ODN. However, a final assessment of the clinical relevance of renal elimination will require information on oral bioavailability from a future study. Of note, the percentage of dose excreted unchanged in urine trended downwards as dose increased (from 3.1% at 2 mg to 0.4% at 50 mg). This result may reflect reduced oral bioavailability at the higher doses (as demonstrated by the less than dose-proportional PK results), but could also reflect a contribution of a saturable transport process in renal elimination. However, renal clearance did not exhibit a meaningful trend across doses, making the latter hypothesis less likely.
Importantly, this study provided a preliminary assessment of the effect of ODN on PD markers sCTx and uNTx/Cr. These bone resorption markers are well characterized and validated [28, 29]. Furthermore, their reduction in response to pharmacological therapy is considered generally predictive of subsequent increases in bone mineral density [12, 13]. A panel of postmenopausal women was specifically included to approximate more closely the intended patient population, because they exhibit increased markers of bone turnover. Given that both sCTx and uNTx are generated by direct action of CatK, it was anticipated that reduction would probably be observed with ODN administration in this single dose study, consistent with target engagement. It was, however, noteworthy that these biomarkers exhibited robust reduction and remained suppressed for up to 7 days following single dose ODN administration. This was in keeping with the unanticipated lengthy PK half-life observed for ODN. Together, these results provided the first evidence that ODN may exhibit a profile supportive of a once weekly regimen for this novel mechanism. Substantial reductions in sCTx (−66%) and uNTx/Cr (–51%) were observed after 24 h following a single dose of 50 mg ODN administration compared with placebo in postmenopausal women. The rapid decrease in sCTx observed in the study may in part reflect biochemical target engagement. Both sCTx and uNTx are generated by the direct action of CatK on collagen. A greater reduction in sCTx was observed with 50 mg ODN (66%) compared with 100 mg ODN (43%) in postmenopausal women at 24 h. The difference is thought, in part, to reflect an incomplete washout prior to administration of the 100 mg dose in this group. The 100 mg dose was administered 1 week after the 50 mg dose, which resulted in an incomplete return to baseline in biochemical markers of bone resorption (sCTx and uNTx/Cr). The reduction of the bone resorption marker data was equally compelling at 168 h (1 week) postdose. Although there were insufficient placebo measurements (n = 2) to permit a robust comparison, the corresponding reductions in sCTx and uNTx/Cr relative to baseline were −70 and −78%, respectively, in postmenopausal women following a single dose of 50 mg ODN.
The overall concentration–uNTx/Cr PK/PD relation observed in this study was consistent with another clinical study of ODN [23], with a modelled EC50 value of 43.8 nm and approximately 80% maximal biomarker reduction. These PD data in combination with the observed PK profile were very provocative and provided impetus to support further investigation of a once weekly dosing regimen.
Single dose administration of ODN, at doses from 2 to 600 mg fasted, from 25 to 300 mg with a highfat meal, and 100 mg with a light meal, were well tolerated. Clinical AEs associated with ODN were qualitatively similar to those seen with placebo and were generally mild, transient and self-limited. There were no serious AEs or discontinuations due to AEs. There were no qualitative differences in the incidence of any AEs (overall or of any specific type) with increasing dose. Five subjects had laboratory AEs, all of which were considered by the investigator probably not to be drug related. There were no clinically significant, treatment-related effects of ODN observed upon analysis of chemistry/haematology laboratory data, vital signs (semi-recumbent or orthostatic) or ECG parameters.
In summary, ODN was generally well tolerated in this dose range study at single oral doses up to 600 mg. Co-administration of ODN with high-fat and low-fat meals increased exposures and concentrations by ∼100 and 30%, respectively. Furthermore, the uNTx/Cr reduction data were not different whether ODN was administered in the fasted state or following a high-fat meal. These data suggest little effect of food on PD efficacy based on the observed concentration–response relation. The long half-life of ODN and robust sustained reduction of biomarkers of bone resorption through 168 h suggests that once weekly dosing can achieve sustained pharmacological activity and provides the first pharmacological proof of concept for a once weekly regimen of a CatK inhibitor.
Competing Interests
All authors have completed the Unified Competing Interest form at http://www.icmje.org/coi_disclosure.pdf (available on request from the corresponding author) and declare: S.A.S., S.Z., J.A.S., D.L.M., B.P., C.C., B.B.S. and J.A.W. are employees of Merck Sharp and Dohme Corp., the studies' sponsor, and may own stock/stock options in the company; Q.L., L.L., Y.D. and K.G. were employees of Merck Sharp and Dohme Corp. during the conduct of these studies and the preparation of this manuscript; and L.V.B. and K.C.L. had support from Merck Sharp and Dohme Corp. for conduct of the study.
Supporting Information
Additional Supporting Information may be found in the online version of this article at the publisher's web-site:
Figure S1
Assessment of dose proportionality for plasma Cmax,overall following administration of single oral doses of odanacatib in the fasted state (a) or fed state (b) to young healthy male subjects
Table S1
Study characteristics
References
- 1.Cooper C. Epidemiology of osteoporosis. Osteoporos Int. 1999;2(9 Suppl. 2):S2–S8. doi: 10.1007/pl00004156. [DOI] [PubMed] [Google Scholar]
- 2.Melton LJ., III How many women have osteoporosis now? J Bone Miner Res. 1995;10:175–177. doi: 10.1002/jbmr.5650100202. [DOI] [PubMed] [Google Scholar]
- 3.Kanis JA, Delmas P, Burckhardt P, Cooper C, Torgerson D on behalf of the European Foundation for Osteoporosis and Bone Disease. Guidelines for diagnosis and management of osteoporosis. Osteoporos Int. 1997;7:390–406. doi: 10.1007/BF01623782. [DOI] [PubMed] [Google Scholar]
- 4.Yasuda Y, Kaleta J, Bromme D. The role of cathepsins in osteoporosis and arthritis: rationale for the design of new therapeutics. Adv Drug Deliv Rev. 2005;57:973–993. doi: 10.1016/j.addr.2004.12.013. [DOI] [PubMed] [Google Scholar]
- 5.Stoch SA, Wagner JA. Cathepsin K inhibitors: a novel target for osteoporosis therapy. Clin Pharmacol Ther. 2008;83:172–176. doi: 10.1038/sj.clpt.6100450. [DOI] [PubMed] [Google Scholar]
- 6.Schilling AF, Mülhausen C, Lehmann W, Santer R, Schinke T, Rueger JM, Amling M. High bone mineral density in pycnodysostotic patients with a novel mutation in the propeptide of cathepsin K. Osteoporos Int. 2007;18:659–669. doi: 10.1007/s00198-006-0311-y. [DOI] [PubMed] [Google Scholar]
- 7.Saftig P, Hunziker E, Wehmeyer O, Jones S, Boyde A, Rommerskirch W, Moritz JD, Schu P, von Figura K. Impaired osteoclastic bone resorption leads to osteopetrosis in cathepsin-K-deficient mice. Proc Natl Acad Sci U S A. 1998;95:13453–13458. doi: 10.1073/pnas.95.23.13453. [DOI] [PMC free article] [PubMed] [Google Scholar]
- 8.Pennypacker B, Shea M, Liu Q, Masarachia P, Saftig P, Rodan S, Rodan G, Kimmel D. Bone density, strength, and formation in adult cathepsin K (-/-) mice. Bone. 2009;44:199–207. doi: 10.1016/j.bone.2008.08.130. [DOI] [PubMed] [Google Scholar]
- 9.Masarachia PJ, Pennypacker BL, Pickarski M, Scott KR, Wesolowski GA, Smith SY, Samadfam R, Goetzmann JE, Scott BB, Kimmel DB, Duong le T. Odanacatib reduces bone turnover and increases bone mass in the lumbar spine of skeletally mature ovariectomized rhesus monkeys. J Bone Miner Res. 2012;27:509–523. doi: 10.1002/jbmr.1475. [DOI] [PubMed] [Google Scholar]
- 10.Pennypacker BL, Duong le T, Cusick TE, Masarachia PJ, Gentile MA, Gauthier JY, Black WC, Scott BB, Samadfam R, Smith SY, Kimmel DB. Cathepsin K inhibitors prevent bone loss in estrogen-deficient rabbits. J Bone Miner Res. 2011;26:252–262. doi: 10.1002/jbmr.223. [DOI] [PubMed] [Google Scholar]
- 11.Cusick T, Chen CM, Pennypacker BL, Pickarski M, Kimmel DB, Scott BB, Duong le T. Odanacatib treatment increases hip bone mass and cortical thickness by preserving endocortical bone formation and stimulating periosteal bone formation in the ovariectomized adult rhesus monkey. J Bone Miner Res. 2012;27:524–537. doi: 10.1002/jbmr.1477. [DOI] [PubMed] [Google Scholar]
- 12.Garnero P, Shih WJ, Gineyts E, Karpf DB, Delmas PD. Comparison of new biochemical markers of bone turnover in late postmenopausal osteoporotic women in response to alendronate treatment. J Clin Endocrinol Metab. 1994;79:1693–1700. doi: 10.1210/jcem.79.6.7989477. [DOI] [PubMed] [Google Scholar]
- 13.Garnero P, Darte C, Delmas PD. A model to monitor the efficacy of alendronate treatment in women with osteoporosis using a biochemical marker of bone turnover. Bone. 1999;24:603–609. doi: 10.1016/s8756-3282(99)00087-3. [DOI] [PubMed] [Google Scholar]
- 14.Seibel MJ, Baylink DJ, Farley JR, Epstein S, Yamauchi M, Eastell R, Pols HA, Raisz LG, Gundberg CM. Basic science and clinical utility of biochemical markers of bone turnover – a Congress report. Exp Clin Endocrinol Diabetes. 1997;105:125–133. doi: 10.1055/s-0029-1211740. [DOI] [PubMed] [Google Scholar]
- 15.Tesch G, Amur S, Schousboe JT, Siegel JN, Lesko LJ, Bai JP. Successes achieved and challenges ahead in translating biomarkers into clinical applications. AAPS J. 2010;12:243–253. doi: 10.1208/s12248-010-9182-4. [DOI] [PMC free article] [PubMed] [Google Scholar]
- 16.Cremers S, Garnero P. Biochemical markers of bone turnover in the clinical development of drugs for osteoporosis and metastatic bone disease: potential uses and pitfalls. Drugs. 2006;66:2031–2058. doi: 10.2165/00003495-200666160-00001. [DOI] [PubMed] [Google Scholar]
- 17.Delaissé JM, Engsig MT, Everts V, del Carmen Ovejero M, Ferreras M, Lund L, Vu TH, Werb Z, Winding B, Lochter A, Karsdal MA, Troen T, Kirkegaard T, Lenhard T, Heegaard AM, Neff L, Baron R, Foged NT. Proteinases in bone resorption: obvious and less obvious roles. Clin Chim Acta. 2000;291:223–234. doi: 10.1016/s0009-8981(99)00230-2. [DOI] [PubMed] [Google Scholar]
- 18.Everts V, Delaissé JM, Korper W, Jansen DC, Tigchelaar-Gutter W, Saftig P, Beertsen W. The bone lining cell: its role in cleaning Howship's lacunae and initiating bone formation. J Bone Miner Res. 2002;17:77–90. doi: 10.1359/jbmr.2002.17.1.77. [DOI] [PubMed] [Google Scholar]
- 19.Garnero P, Borel O, Byrjalsen I, Ferreras M, Drake FH, McQueney MS, Foged NT, Delmas PD, Delaissé JM. The collagenolytic activity of cathepsin K is unique among mammalian proteinases. J Biol Chem. 1998;273:32347–32352. doi: 10.1074/jbc.273.48.32347. [DOI] [PubMed] [Google Scholar]
- 20.Sassi ML, Eriksen H, Risteli L, Niemi S, Mansell J, Gowen M, Risteli J. Immunochemical characterization of assay for carboxyterminal telopeptide of human type I collagen: loss of antigenicity by treatment with cathepsin K. Bone. 2000;26:367–373. doi: 10.1016/S8756-3282(00)00235-0. [DOI] [PubMed] [Google Scholar]
- 21.Adami S, Supronik J, Haha T, Brown JP, Garnero P, Haemmerle S, Ortmann CE, Bousset F, Trechel U. Effect of one Year treatment with the cathepsin-K inhibitor, balicatib, on bone mineral density (BMD) in postmenopausal women with osteopenia/osteoporosis. J Bone Miner Res. 2006;24(Suppl 1) [Google Scholar]
- 22.Eastell R, Nagase S, Ohyama M, Small M, Sawyer J, Boonen S, Spector T, Kuwayama T, Deacon S. Safety and efficacy of the Cathepsin K inhibitor, ONO-5334, in postmenopausal osteoporosis – the OCEAN study. J Bone Miner Res. 2011;26:1303–1312. doi: 10.1002/jbmr.341. [DOI] [PubMed] [Google Scholar]
- 23.Stoch SA, Zajic S, Stone J, Miller DL, Van Dyck K, Gutierrez MJ, De Decker M, Liu L, Liu Q, Scott BB, Panebianco D, Jin B, Duong LT, Gottesdiener K, Wagner JA. Effect of the cathepsin K inhibitor odanacatib on bone resorption biomarkers in healthy postmenopausal women: two double-blind, randomized, placebo-controlled phase I studies. Clin Pharmacol Ther. 2009;86:175–182. doi: 10.1038/clpt.2009.60. [DOI] [PubMed] [Google Scholar]
- 24.U.S.Department of Health and Human Services Food and Drug Administration Center for Drug Evaluation and Research (CDER) Guidance for industry food-effect bioavailability and fed bioequivalence studies. 2002. Available at http://www.FDA.gov (last accessed 15 September 2012)
- 25.Sun L, Forni S, Schwartz MS, Breidinger S, Woolf EJ. Quantitative determination of odanacatib in human plasma using liquid-liquid extraction followed by liquid chromatography-tandem mass spectrometry analysis. J Chromatogr B Analyt Technol Biomed Life Sci. 2012;885-886:15–23. doi: 10.1016/j.jchromb.2011.12.004. [DOI] [PubMed] [Google Scholar]
- 26.Kassahun K, Black WC, Nicoll-Griffith D, McIntosh I, Chauret N, Day S, Rosenberg E, Koeplinger K. Pharmacokinetics and metabolism in rats, dogs, and monkeys of the cathepsin k inhibitor odanacatib: demethylation of a methylsulfonyl moiety as a major metabolic pathway. Drug Metab Dispos. 2011;39:1079–1087. doi: 10.1124/dmd.110.037184. [DOI] [PubMed] [Google Scholar]
- 27.Isabel E, Bateman KP, Chauret N, Cromlish W, Desmarais S, Duong le T, Falgueyret JP, Gauthier JY, Lamontagne S, Lau CK, Léger S, LeRiche T, Lévesque JF, Li CS, Massé F, McKay DJ, Mellon C, Nicoll-Griffith DA, Oballa RM, Percival MD, Riendeau D, Robichaud J, Rodan GA, Rodan SB, Seto C, Thérien M, Truong VL, Wesolowski G, Young RN, Zamboni R, Black WC. The discovery of odanacatib (MK-0822), a selective inhibitor of cathepsin K. Bioorg Med Chem Lett. 2008;18:923–928. doi: 10.1016/j.bmcl.2007.12.047. [DOI] [PubMed] [Google Scholar]
- 28.Garnero P. Biomarkers for osteoporosis management: utility in diagnosis, fracture risk prediction and therapy monitoring. Mol Diagn Ther. 2008;12:157–170. doi: 10.1007/BF03256280. [DOI] [PubMed] [Google Scholar]
- 29.Garnero P. Bone markers in osteoporosis. Curr Osteoporos Rep. 2009;7:84–90. doi: 10.1007/s11914-009-0014-3. [DOI] [PubMed] [Google Scholar]
Associated Data
This section collects any data citations, data availability statements, or supplementary materials included in this article.