Abstract
pH-sensitive liposomes represent an effective gene vector in cancer therapy. However, their use is greatly hampered by their relatively low transfection efficiency. To improve the transfection efficiency of pH-sensitive liposomes, we prepared complexes containing 3β-[N-(N′,N′-dimethylaminoethane) carbamoyl] cholesterol (DC-Chol) and dioleoylphosphatidyl ethanolamine (DOPE) liposomes and pH-sensitive liposomes composed of cholesteryl hemisuccinate (CHEMS) and DOPE, and evaluated the influence of various factors on plasmid DNA (pDNA) transfection efficiency. All DC-Chol/DOPE liposome/pDNA and pH-sensitive liposome complexes showed similarly potent pH sensitivity. In the presence of serum-containing medium, two optimized complexes of DC-Chol/DOPE liposomes/pDNA and pH-sensitive PEGylated liposomes showed high transfection efficiency of 22.94% and 20.07%, respectively. Notably, DC-Chol/DOPE (2:3) liposomes/pH-sensitive PEGylated (1%) liposome complexes with a charge ratio of 1:1 (m/m [+/−]) showed enhanced accumulation in tumors in vivo. Our results show the influence of various factors on pDNA transfection efficiency in complexes of DC-Chol/DOPE liposomes and pH-sensitive PEGylated liposomes. Understanding of such mechanisms will lead to better design of complexes of DC-Chol/DOPE liposomes and pH-sensitive liposomes for gene therapy.
Keywords: cationic liposomes, pH-sensitive liposomes, pDNA, transfection, PEGylated
Introduction
Gene delivery is a potent therapeutic strategy in tumor biotherapy.1 The delivery system used is critical in gene therapy. Generally, gene delivery systems can be classified into two categories, ie, viral and nonviral vectors.2 Nonviral vectors composed of cationic liposomes and polymers have many advantages, including being less immunogenic, biodegradable, and less toxic.34 Cationic liposomes composed of 3β-[N-(N′,N′-dimethylaminoethane) carbamoyl] cholesterol (DC-Chol) and dioleoylphosphatidylethanolamine (DOPE) (DC-Chol/DOPE) are one of the most efficient gene vectors for plasmid (pDNA) transfection in preclinical experiments and clinical trials.5 However, although cationic liposomes show excellent transfection efficiency in vitro, further development of DC-Chol/DOPE liposomes is severely hampered by their poor stability in serum and low transfection efficiency6,7
pH-sensitive liposomes targeted to tumors are stable at physiological pH, but are designed to become unstable and fusogenic under acidic conditions, resulting in release of their drug cargo.8 pH-sensitive liposomes take advantage of the acidification that occurs in pathological tissue, such as tumors. Hypoxia in the tumor microenvironment reduces pH, which could potentially trigger drug release from acid-sensitive systems.9 Therefore, pH-sensitive liposomes represent a potent therapeutic approach in gene therapy.10
However, the gene transfection efficiency of pH-sensitive liposomes remains unsatisfactory,11,12 with numerous pH-sensitive liposomes showing low transfection efficiency in the presence of serum. For example, Legendre et al reported that cationic liposomes achieved only transient transfection in their experimental cell lines, whereas pH-sensitive liposomes composed of cholesteryl hemisuccinate (CHEMS) and DOPE at a 2/1 molar ratio mediated gene transfer with an efficiency that was 1%–30% of that obtained using cationic liposomes.13 This low transfection efficiency was due to the negative charge on the pH-sensitive liposomes and their low binding affinity for pDNA.14 Therefore, there is an urgent need to improve the transfection efficiency of pH-sensitive liposomes.15
In this study, we mixed DC-Chol/DOPE liposomes (which have excellent transfection efficiency in vitro) and pH-sensitive liposomes to enhance their transfection efficiency and avoid the excess positive charge of cationic liposomes. Further, to overcome their limited circulation time in the bloodstream and to avoid uptake by the reticuloendothelial system, we PEGylated pH-sensitive liposomes and then mixed them with DC-Chol/DOPE liposomes. The influence of various factors on the pDNA transfection efficiency of the liposome complexes was evaluated. Comprehension of such mechanisms will lead to design of liposomes better adapted for application in gene therapy.
Materials and methods
Materials
DC-Chol and DOPE were provided by Avanti Polar Lipids (Alabaster, AL, USA). 1,2-distearoyl-sn-glycero-3-phosphoethanolamine [methoxy(polyethylene glycol)-2000] (DSPE-mPEG) was sourced from Lipoid (Ludwigshafen, Germany). CHEMS was purchased from Sigma-Aldrich (St Louis, MO, USA). All other organic reagents were of analytical grade and provided by Sinopharm (Shanghai, People’s Republic of China). Calcein was sourced from Maibio Co, Ltd (Shanghai, People’s Republic of China). Dir, a lipophilic near-infrared fluorescent cyanine dye, was obtained from Biotium (Hayward, CA, USA). FITC (fluorescein isothiocyanate) and rhodamine were purchased from AAT Bioquest (Sunnyvale, CA, USA). pGPH1/GFP/Neo plasmid was provided by GenePharma (Shanghai, People’s Republic of China). Modified Eagle’s Medium was purchased from Hyclone (Logan, UT, USA) and fetal bovine serum from Life Technologies (Carlsbad, CA, USA).
Cell lines
A human hepatocellular carcinoma (HepG2) cell line was obtained from the Cell Center of the Shanghai Academy of Life Sciences, Chinese Academy of Sciences (Shanghai, People’s Republic of China). The cells were maintained in Modified Eagle’s Medium supplemented with 10% fetal bovine serum, 25 mM hydroxyethyl piperazine ethanesulfonic acid (HEPES) buffer, penicillin 100 U/mL, and streptomycin 100 μg/mL at 37°C in a humidified atmosphere of 5% CO2.
Preparation of DC-Chol/DOPE liposomes
DC-Chol/DOPE liposomes were prepared using a thin-film method as described elsewhere.16 Briefly, DC-Chol and DOPE at different molar ratios were dissolved in chloroform, and the solution was evaporated under reduced pressure on a rotary evaporator to remove excess chloroform. The resulting thin film was dried further in a vacuum for 12 hours to remove any remaining solvent. The dried film was hydrated with 2 mL of 20 mM HEPES buffer (pH 7.4). After adequate hydration, the film was suspended by vortexing. The liposomes were then sonicated, and extruded 15 times each through two stacks of polycarbonate membranes with progressively decreasing pore sizes (400 nm, 200 nm, 100 nm, Nuclepore®, Whatman, Maidstone, UK), using a hand-held extruder (Avestin, Ottawa, Canada). The resulting DC-Chol/DOPE liposomes were sterilized by passage through a sterile 0.22 μm filter and stored at 4°C. The liposomes remained stable at 4°C for up to 2 months, without any significant change in their mean size. The DC-Chol/DOPE (molar ratio 1:1) liposomes contained a final DC-Chol concentration of 4 μmol/mL and a DOPE concentration of 4 μmol/mL. The DC-Chol/DOPE (molar ratio 2:3) liposomes contained a final DC-Chol concentration of 4 μmol/mL and a DOPE concentration of 6 μmol/mL. The DC-Chol/DOPE (molar ratio 1:2) liposomes contained a final DC-Chol concentration of 4 μmol/mL and a DOPE concentration of 8 μmol/mL. FITC (fluorescein isothiocyanate) or rhodamine was added at a molar ratio of 0.25% and 0.1%, respectively, to enable the liposomes to fluoresce.
Preparation of pH-sensitive and PEGylated liposomes
We also prepared pH-sensitive liposomes composed of CHEMS and DOPE using a thin-film method. Briefly, CHEMS and DOPE were dissolved at a molar ratio of 4/6 in chloroform and the solution was evaporated on a rotary evaporator under reduced pressure to remove any remaining chloroform. The resulting thin film was dried further in a vacuum for 12 hours to remove any remaining solvent. The dried film was hydrated with 1 mL of 20 mM HEPES (pH 7.4) and 1 mL of diethyl ether. After adequate hydration, the film was suspended by vortexing. The liposomes were then sonicated to obtain a white emulsion. Next, 1 mL of HEPES buffer was added and the diethyl ether was removed under reduced pressure by a rotary evaporator. The liposomes were extruded 15 times each through two stacks of polycarbonate membranes with progressively decreasing pore sizes (400 nm, 200 nm, 100 nm) using a hand-held extruder. The resulting pH-sensitive liposomes were sterilized by passage through a sterile 0.22 μm filter and stored at 4°C. The liposomes were stable at 4 °C for up to 2 months, without any significant change in their mean size. pH-sensitive PEGylated liposomes were prepared in the same way as that used for the pH-sensitive liposomes, except that DSPE-mPEG of various molar ratios (1%, 3%, 5%) was added with the CHEMS and DOPE. FITC (fluorescein isothiocyanate) or rhodamine was added at molar ratios of 0.25% and 0.1%, respectively, to enable the liposomes to fluoresce.
Preparation of liposome/pDNA complexes
DC-Chol/DOPE liposomes/pDNA complexes with different charge ratios of 2, 3, and 4 (ratio of the positive charge on DC-Chol/DOPE liposomes to the negative charge on pDNA, ie, the N/P ratio) were prepared as follows. DC-Chol/DOPE liposomes were diluted in HEPES buffer to a final volume of 20 μL. At an N/P charge ratio of 2, 3, or 4, the final DC-Chol concentration of the diluted DC-Chol/DOPE (respective molar ratios 1:1, 1:2 or 2:3) liposomes was 0.3, 0.45, or 0.6 μmol/mL. The diluted liposomes were then incubated with 20 μL of plasmid DNA (1 μg) at room temperature for 25 minutes.
Preparation of DC-Chol/DOPE liposomes/pDNA and pH-sensitive and pH-sensitive PEGylated liposomes
DC-Chol/DOPE liposomes/pDNA and pH-sensitive or pH-sensitive PEGylated liposomes with different charge ratios of 1:0.5, 1:1, 1:1.5, 1:2, 1:2.5, and 1:3 (ratio of the positive charge on DC-Chol/DOPE liposomes to the negative charge on pH-sensitive liposomes or on pH-sensitive PEGylated liposomes [ie, m/m (+/−)]) were prepared as follows. pH-sensitive liposomes and pH-sensitive PEGylated liposomes were diluted with HEPES buffer to a final volume of 20 μL. The diluted liposomes were then incubated with 20 μL of DC-Chol/DOPE liposomes/pDNA at room temperature for a further 25 minutes to prepare DC-Chol/DOPE liposomes/pDNA and pH-sensitive liposomes or pH-sensitive PEGylated liposomes (see Figure 1).
Figure 1.
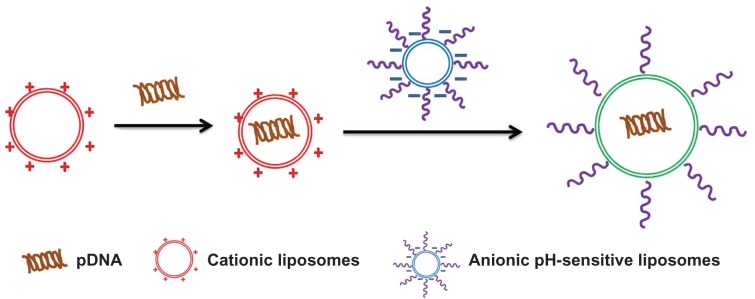
Schematic diagram for formation of complexes containing cationic liposomes and anionic pH-sensitive liposomes.
Particle size and zeta potential
The size and zeta potential of the liposomes and liposomal complexes (50 μL) dispersed in 1 mL of deionized water were analyzed using a Zetasizer Nano S (Malvern Instruments, Worcestershire, UK).
Atomic force microscopy
Ten microliters of the liposomes or liposomal complexes were placed in a piece of mica and observed at a scanning frequency of 1 Hz in a scanning field of 2.5 μm × 2.5 μm using an atomic force microscope (SPM-9500J, Shimadzu Corporation, Japan).
Gel retardation assay
A gel retardation assay was used to assess the ability of the liposomes to bind with pDNA. Briefly liposomal complexes containing 1 μg of pDNA were loaded into 1% agarose gel. The samples were electrophoresed and stained with ethidium bromide. Staining of pDNA was done by ultraviolet irradiation.
In vitro transfection of pDNA
For analysis of transfection efficiency HepG2 cells were seeded overnight in 24-well plates at a density of 2 × 10⁵ cells per well. Liposomal complexes containing 0.5 μg of pDNA were incubated with the cells for 8 hours, after which the culture medium was refreshed. Fifty-eight hours later, the cells were trypsinized washed and analyzed using a flow cytometer (Becton Dickinson, San Jose, CA, USA). The medium was then replaced with serum-free culture medium for serum-free transfection. Eight hours after transfection, the serum-free culture medium was replaced with medium containing serum. Standard transfection using Lipofectamine® 2000 (Life Technologies) was used as a positive control, and performed according to the manufacturer’s instructions. The transfection efficiency of pDNA was evaluated by flow cytometry, with excitation at 488 nm to detect green fluorescence protein (GFP) in the transfected cells. Transfection efficiency was expressed as the percentage of transfected cells against all cells counted.
Confocal microscopy
A confocal microscopic study was done to observe colocalization of the FITC-labeled DC-Chol/DOPE (2:3) liposomes and rhodamine-labeled pH-sensitive DC-Chol-DOPE (2/3) liposomes/pDNA and pH-sensitive liposomes (m/m [+/−] = 1:1), and colocalization of 1 DC-Chol/DOPE (2/3) liposomes/pDNA and pH-sensitive PEGylated liposomes (m/m [+/−] = 1:1). Confocal microscopy was also used to observe binding and internalization of the liposomes in HepG2 cells. Briefly, HepG2 cells (2.5 × 10⁵ cells per well) were seeded overnight on coverslips in a 12-well tissue culture plate and treated with the liposomes for different periods of time. After washing with phosphate-buffered solution, the cells were fixed with 4% paraformaldehyde, counterstained with 4′,6-diamidino-2-phenylindole dihydrochloride (DAPI, Sigma, Fluka Chemie, Buchs, Israel) and mounted with glass coverslips. Immunofluorescence was visualized using a TCS SP5 confocal microscope (Leica, Nussloch, Germany).
Cell viability assay
Cell viability was measured using the methylthiazol tetrazolium (MTT) assay. Briefly, cells were seeded in 96-well plates (2.5 × 10⁴ cells per well) and incubated overnight. Liposome complexes containing 0.5 μg of pDNA were incubated with the cells for 8 hours, after which the culture medium was refreshed. Forty-eight hours later, cell proliferation was evaluated by adding 20 μL of MTT (5 mg/mL) solution to each well. After incubation for 4 hours at 37°C, 150 μL of dimethyl sulfoxide was added and absorbance was measured at 490 nm/620 nm using a universal microplate reader (ELx800, Bio-Tek, Winooski, VT, USA). Cell viability was calculated using the formula [(AE − AB)/(AC − AB)], where AE, AC, and AB are defined as absorbance of the experimental samples, untreated samples, and blank controls, respectively. For serum-free transfection, the medium was replaced with serum-free culture medium before transfection, and 8 hours after transfection, the medium was exchanged for culture medium containing serum. Transfection using Lipofectamine 2000 was performed according to the manufacturer’s standard protocol.
pH sensitivity of liposomal complexes
One hundred microliters of DC-Chol/DOPE liposomes/pDNA or pH-sensitive liposomes and DC-Chol/DOPE liposomes/pDNA and pH-sensitive PEGylated liposomes (m/m [+/−] = 1:1) loaded with 80 mM calcein was placed in 2 mL of 20 mM HEPES buffer (pH 7.5). Background fluorescence intensity (F0) was detected at an excitation wavelength of 495 nm and a detection wavelength of 520 nm. Next, 100 μL of the same samples were placed in 2 mL of HEPES buffer at pH 4.5, 5.0, 5.5, 6.0, 6.5, or 7.0. After incubation for 30 minutes, the fluorescence intensity (F1) was detected under the same conditions. Following detection, 20 μL of Triton X-100 was mixed and fluorescence intensity was determined under the same conditions (F2). The release rate for calcein was calculated as: (F1 − F0)/(F2 − F0) × 100%.
Animal studies
The mice used in these experiments were obtained from the Shanghai Experimental Animal Center of the Chinese Academy of Sciences, placed in a pathogen-free environment, and allowed to acclimatize for a week prior to the study. All procedures were performed in accordance with the guidelines of the Committee on Animals of The Second Military Medical University, Shanghai, People’s Republic of China.
In vivo study
BALB/c nude mice (male, 4–6 weeks, weighing approximately 20 g) were inoculated subcutaneously on the right back with 2 × 10⁸ HepG2 cells. When the volume of the tumors reached about 500 mm3, the mice bearing subcutaneous HepG2 tumors were randomly assigned in groups of three mice each to receive one of the following treatments: Dir-labeled DC-Chol/DOPE liposomes (molar ratio 2:3); pH-sensitive PEGylated (1%) liposomes; or DC-Chol/DOPE liposomes and pH-sensitive PEGylated (1%) liposomes. All treatments were injected intravenously as a single dose via the tail vein. The mice were anesthetized using 5% (m/v) chloral hydrate. At different time points after injection, in vivo images were captured on a Maestro Dynamic™ in vivo imaging system (Cambridge Research and Instrumentation Inc, Woburn, MA, USA) and recorded using a built-in charge-coupled device camera.
Statistical analysis
The study data were analyzed using the Statistical Package for Social Sciences version 13.0 (IBM Corporation, Armonk, NY, USA). The Student’s non-paired t-test was used to compare normally distributed values between the groups. P < 0.05 was considered to be statistically significant.
Results
Characteristics of DC-Chol/DOPE liposomes/pDNA complexes
Before complexation with pDNA, the DC-Chol/DOPE liposomes had a particle size of 120–140 nm. However, the size of DC-Chol/DOPE liposomes/pDNA complexes became much larger than that of the liposomes from which they were produced (Supplementary Figure 1A). The size of the DC-Chol/DOPE liposomes/pDNA complexes was greatest when the N/P ratio was 2, and gradually decreased with an increasing N/P ratio; however, their size was still larger than that of the liposomes from which they were produced. Of note, the size of the DC-Chol/DOPE (1:2) liposomes/pDNA complexes was smaller than that of the DC-Chol/DOPE (1:1) liposomes/pDNA complexes (P < 0.05 at N/P ratios of 2 and 4). The polydispersity index of the liposomes/pDNA complexes was around 0.15, indicating homodispersion (Supplementary Figure 1B). The zeta potential is another important parameter of cationic liposomes, and gradually increased in DC-Chol/DOPE liposomes/pDNA complexes with an increasing N/P ratio (Supplementary Figure 1C).
The gel retardation assay is the method most commonly used to examine the pDNA binding affinity of cationic liposomes. As shown in Supplementary Figure 2, all DC-Chol/DOPE liposomes could completely encapsulate pDNA, with no pDNA migration observed, suggesting there was no significant difference in pDNA binding affinity between DC-Chol/DOPE liposomes containing various molar ratios of DC-Chol/DOPE.
pDNA transfection of DC-Chol/DOPE liposomes/pDNA complexes
The molar ratio of DC-Chol/DOPE plays an important role in the transfection of DC-Chol/DOPE liposomes. It has been reported that DC-Chol/DOPE liposomes with a 3:2 or 1:1 molar ratio show the highest transfection efficiency.17 A set of experiments were performed over a DC-Chol/DOPE molar ratio range from 1:1 to 1:2 (1:1, 2:3 and 1:2). Supplementary Figure 3 shows that the pDNA transfection of DC-Chol/DOPE liposomes was not significantly affected by serum. DC-Chol/DOPE (1:1) liposomes showed the lowest transfection efficiency, whereas there was no significant difference in transfection efficiency between DC-Chol/DOPE (2:3) liposomes and DC-Chol/DOPE (1:2) liposomes. DC-Chol/DOPE (1:2) liposomes/pDNA complexes at an N/P ratio of 2 showed the highest transfection efficiency in the presence of serum, whereas DC-Chol/DOPE (2:3) liposomes/pDNA complexes at an N/P ratio of 3 showed the highest transfection efficiency in the absence of serum (Supplementary Figure 3).
The transfection reagent used should have low toxicity towards the transfected cells. If the cytotoxicity of the transfection reagent is very high, expression of the target gene could be severely affected.18 As showed in Supplementary Figure 3C and D, cell viability was about 80% after transfection. Cytotoxicity increased only mildly with increasing N/P ratio. Of note, the cytotoxicity of DC-Chol/DOPE liposomes containing a relatively high DOPE content was relatively low.
Size and zeta potential of complexes of DC-Chol/DOPE liposomes/pDNA and pH-sensitive liposomes
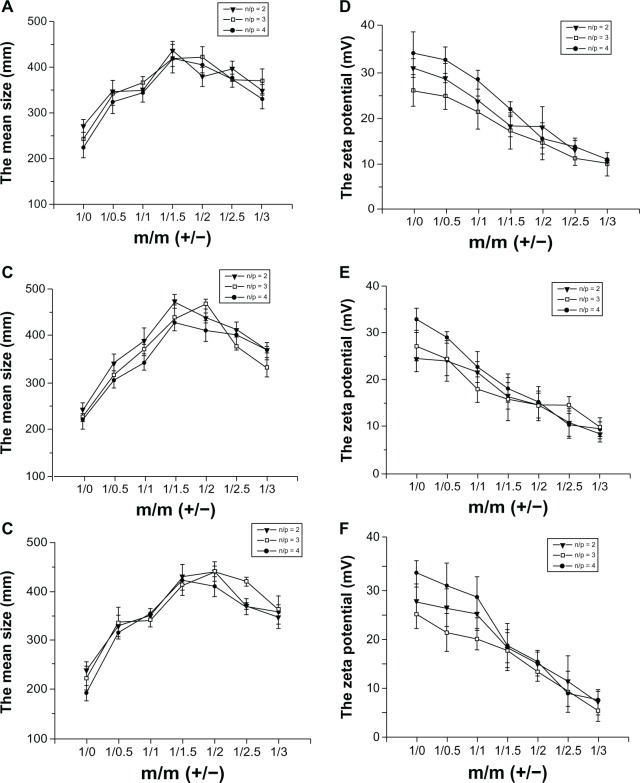
As shown in Figure 2A–C, complexes of DC-Chol/DOPE liposomes/pDNA and pH-sensitive liposomes were large (300–400 nm), and significantly larger than DC-Chol/DOPE liposomes/pDNA complexes. The size of the complexes of DC-Chol/DOPE liposomes/pDNA and pH-sensitive liposomes increased with increasing amounts of pH-sensitive liposomes. Complexes of DC-Chol/DOPE liposomes/pDNA and pH-sensitive liposomes were largest when the ratio of the positive charge to negative charge was 1:1.5–1:2. However, the size decreased when the ratio of the positive charge and negative charge was higher than 1:2. These data suggest that the ratio of DC-Chol/DOPE liposomes/pDNA complexes to pH-sensitive liposomes had both positive and negative effects on the size of the complexes of DC-Chol/DOPE liposomes/pDNA and pH-sensitive liposomes. In addition, the zeta potential of the complexes of DC-Chol/DOPE liposomes/pDNA and pH-sensitive liposomes gradually decreased with increasing amounts of pH-sensitive liposomes (Figure 2D–F).
Figure 2.
(A–C) Size and (D–F) zeta potential of complexes containing DC-Chol/DOPE liposomes/pDNA and pH-sensitive liposomes. (A and D) Complexes containing DC-Chol/DOPE (1/1) liposomes/pDNA and pH-sensitive liposomes, (B and E) complexes containing DC-Chol/DOPE (2/3) liposomes/pDNA and pH-sensitive liposomes, and (C and F) complexes containing DC-Chol/DOPE (1/2) liposomes/pDNA and pH-sensitive liposomes.
Note: Data are presented as the mean ± standard deviation (n = 3).
Abbreviations: DC-Chol, 3β-[N-(N′,N′-dimethylaminoethane) carbamoyl] cholesterol; DOPE, dioleoylphosphatidyl ethanolamine.
Atomic force microscopy and confocal microscopy
The size and morphology of DC-Chol/DOPE liposomes, pH-sensitive liposomes, and complexes of DC-Chol/DOPE liposomes/pDNA were observed by atomic force microscopy. Supplementary Figure 4 shows that all the liposomes were spherical in shape. Further, all the liposomes had a relatively monodispersed size and showed a finely disseminated pattern. The size of the liposomes was observed by atomic force microscopy and found with be consistent with the size measured by the Zeta sizer Nano S. Confocal microscopy was used to observe the colocalization of FITC-labeled DC-Chol/DOPE liposomes and rhodamine-labeled pH-sensitive liposomes (Supplementary Figure 5). On superimposing the images of Supplementary Figure 5A and B, green and red fluorescence colocalized within the liposomal complexes, suggesting that FITC-labeled DC-Chol/DOPE liposomes colocalized with rhodamine-labeled pH-sensitive liposomes in the complexes of DC-Chol/DOPE liposomes/pDNA and pH-sensitive liposomes.
Gel retardation assay of DC-Chol/DOPE liposomes/pDNA and pH-sensitive liposomes
As shown in Supplementary Figure 6, no free pDNA migration occurred with any of the complexes of DC-Chol/DOPE liposomes/pDNA or pH-sensitive liposomes. The results suggest that the pDNA binding affinity for the complexes of DC-Chol/DOPE liposomes/pDNA and pH-sensitive liposomes was not significantly reduced, although the pH-sensitive liposomes decreased the zeta potential of the liposomal complexes to some extent.
pH sensitivity of liposomal complexes
As expected, pH-sensitive liposomes had superior pH sensitivity. The rate of release of calcein was less than 10% at pH 7.0 (Figure 3), but gradually increased with decreasing pH. When the pH was changed from 6.0 to 5.5, the rate of calcein release increased markedly. When the pH was 4.5, the rate of calcein release was nearly 90%. The complexes of DC-Chol/DOPE liposomes/pDNA and pH-sensitive liposomes showed similar but slightly reduced pH sensitivity. At pH 4.5, the calcein release rate was 70%–75% for the complexes of DC-Chol/DOPE liposomes/pDNA and pH-sensitive liposomes, which was slightly lower than that of pH-sensitive liposomes (P < 0.05). On the contrary, for the non-pH-sensitive DC-Chol/DOPE liposomes, the calcein release rate was about 5%–10% across a wide pH range of 4.5–7, as expected (data not shown). Further, complexes of DC-Chol/DOPE liposomes/pDNA and pH-sensitive liposomes containing various molar ratios of DC-Chol/DOPE showed similar pH sensitivity. These data demonstrate that the pH sensitivity of the liposomal complexes depended mainly on pH-sensitive liposomes.
Figure 3.
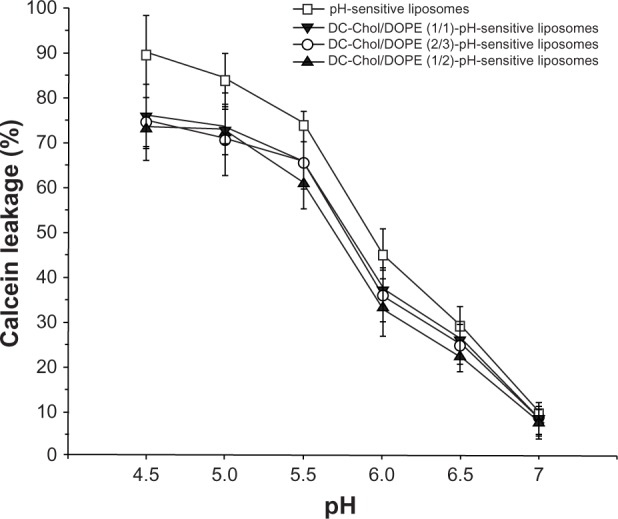
pH sensitivity of complexes containing DC-Chol/DOPE liposomes/pDNA and pH-sensitive liposomes.
Notes: The background fluorescence intensity (F0) was detected at an excitation wavelength of 495 nm and a detection wavelength of 520 nm. In addition, 100 μL of the same samples were placed in 2 mL of HEPES buffer at successive pH levels of 4.5, 5.0, 5.5, 6.0, 6.5, and 7.0. After incubation for 30 minutes, the fluorescence intensity (F1) was detected under the same conditions. After detection, 20 μL of Triton X-100 was mixed and the fluorescence intensity (F2) was determined under the same conditions. The calcein release rate was calculated using the following formula: (F1 − F0)/(F2 − F0) × 100%. Data are presented as the mean ± standard deviation (n = 3).
Abbreviations: DC-Chol, 3β-[N-(N′,N′-dimethylaminoethane) carbamoyl] cholesterol; DOPE, dioleoylphosphatidyl ethanolamine.
pDNA transfection and cell viability of DC-Chol/DOPE liposomes/pDNA complexes and pH-sensitive liposomes
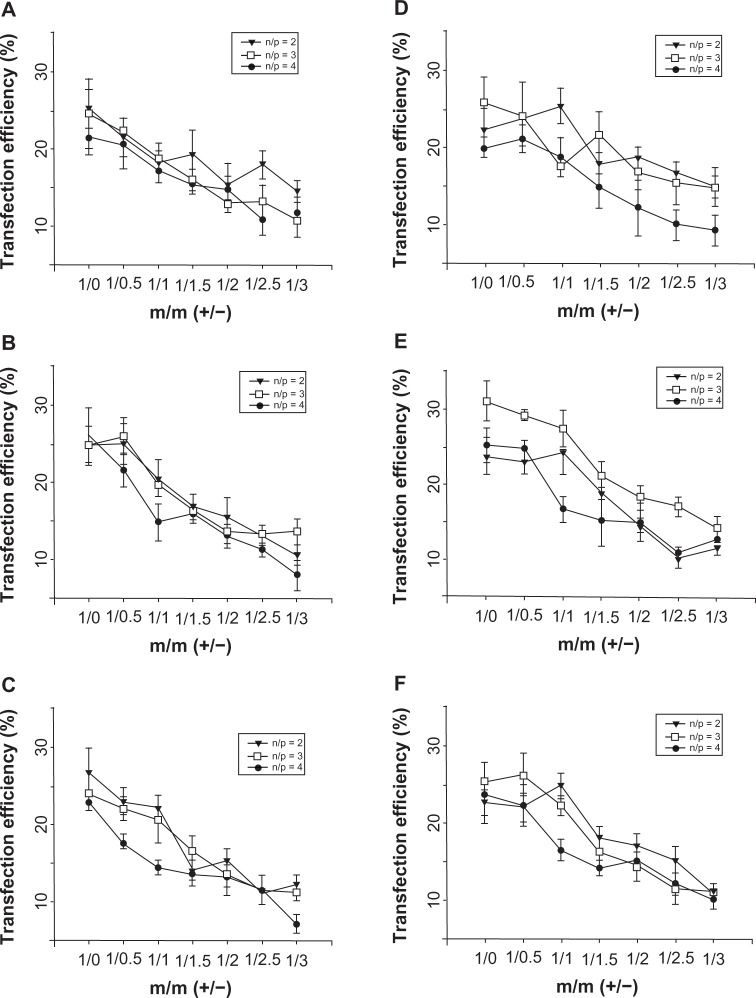
Figure 4 shows that pDNA transfection of the complexes of DC-Chol/DOPE liposomes/pDNA and pH-sensitive liposomes was not significantly affected by serum. In serum-free transfection, the transfection efficiency of all the complexes of DC-Chol/DOPE liposomes/pDNA and pH-sensitive liposomes (m/m [+/−] = 1:0.5, 1:1, 1:1.5, 1:2, 1:2.5, and 1:3) was similar or lower than that of the corresponding DC-Chol/DOPE liposomes/pDNA complexes (m/m [+/−] = 1:0) with the same molar ratio of DC-Chol/DOPE and the same N/P ratio (Figure 4A–C). Similar results were obtained in serum containing transfection medium (Figure 4D–F).
Figure 4.
In vitro pDNA transfection assays for complexes of DC-Chol/DOPE liposomes/pDNA and pH-sensitive liposomes. HepG2 cells were seeded in 24-well plates at a density of 2 × 10⁵ cells per well overnight. Liposomal complexes containing 0.5 μg pDNA were incubated with the cells for 8 hours, at which point the culture medium was refreshed. Forty-eight hours later, the cells were trypsinized, washed, and analyzed by flow cytometry. Transfection efficiency was determined as the percentage of transfected cells against all cells counted in the absence (A–C) and presence (D–F) of serum. (A and D) Complexes of DC-Chol/DOPE (1/1) liposomes/pDNA and pH-sensitive liposomes, (B and E) complexes of DC-Chol/DOPE (2/3) liposomes/pDNA and pH-sensitive liposomes, and (C and F) complexes of DC-Chol/DOPE (1/2) liposomes/pDNA and pH-sensitive liposomes.
Note: Data are presented as the mean ± standard deviation (n = 3).
Abbreviations: DC-Chol, 3β-[N-(N′,N′-dimethylaminoethane) carbamoyl] cholesterol; DOPE, dioleoylphosphatidyl ethanolamine.
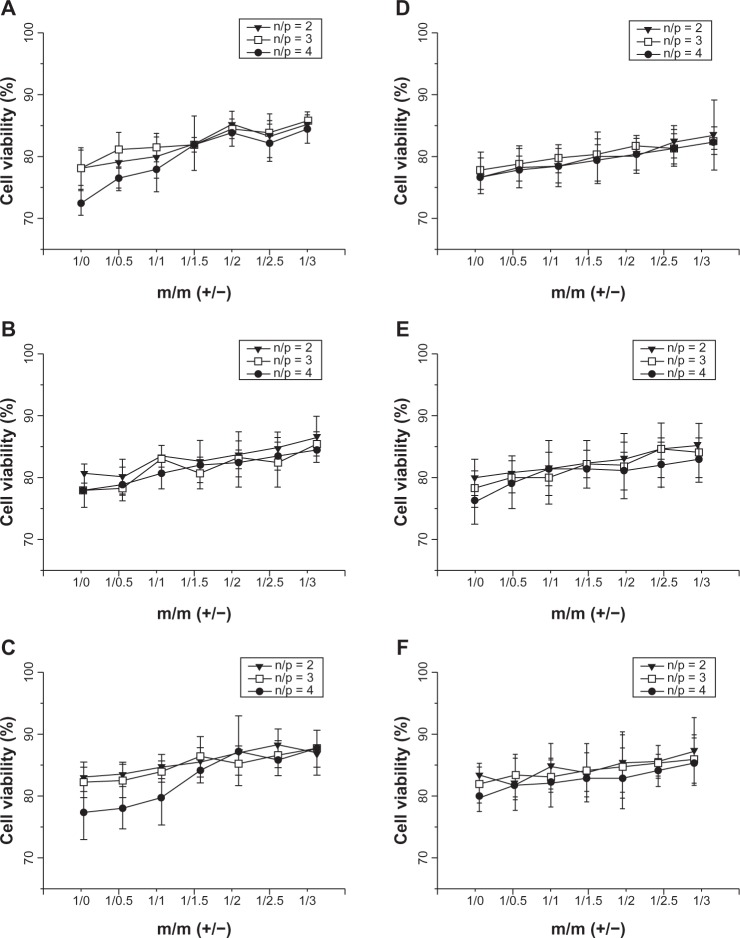
As showed in Figure 5, the cytotoxic effect of the complexes of DC-Chol/DOPE liposomes/pDNA and pH-sensitive liposomes decreased with increasing amounts of pH-sensitive liposomes and this was due to the decreased zeta potential of the pH-sensitive liposomes. It is noteworthy that the cytotoxicity of the complexes of DC-Chol/DOPE liposomes/pDNA and pH-sensitive liposomes increased with increasing N/P ratio.
Figure 5.
Cell viability assay of complexes of DC-Chol/DOPE liposomes/pDNA and pH-sensitive liposomes. HepG2 cells were seeded in 24-well plates at a density of 2 × 10⁵ cells per well overnight. The liposomal complexes containing 0.5 μg pDNA were incubated with the cells for 8 hours, at which point the culture medium was refreshed. Forty-eight hours later, cell proliferation was evaluated by adding 20 μL of MTT (5 mg/mL) solution to each well. Cell viability was calculated using the formula: [(AE − AB)/(AC − AB)]. AE, AC, and AB were defined as the absorbance of experimental samples, untreated samples and blank controls, respectively, in the absence (A–C) and presence (D–F) of serum. (A and D) Complexes of DC-Chol/DOPE (1/1) liposomes/pDNA and pH-sensitive liposomes, (B and E) complexes of DC-Chol/DOPE (2/3) liposomes/pDNA and pH-sensitive liposomes, and (C and F) complexes of DC-Chol/DOPE (1/2) liposomes/pDNA and pH-sensitive liposomes.
Note: Data are presented as the mean + standard deviation (n = 3).
Abbreviations: DC-Chol, 3β-[N-(N′,N′-dimethylaminoethane) carbamoyl] cholesterol; DOPE, dioleoylphosphatidyl ethanolamine.
Uptake of complexes of DC-Chol/DOPE liposomes/pH-sensitive liposomes by cells
A confocal microscopic study was performed to observe binding and internalization of the complexes of DC-Chol/DOPE (2:3) liposomes/pH-sensitive liposomes with a charge ratio of 1:1 (m/m [+/−]) in HepG2 cells. Figure 5 shows that the complexes of DC-Chol/DOPE liposomes/pH-sensitive liposomes were taken up in significant amounts by HepG2 cells at 5 minutes. With the passage of time, uptake of the liposomal complexes was not significantly increased, suggesting that the process is rapidly and easily saturated.
Size and zeta potential of DC-Chol/DOPE liposomes/pDNA and pH-sensitive PEGylated liposomes
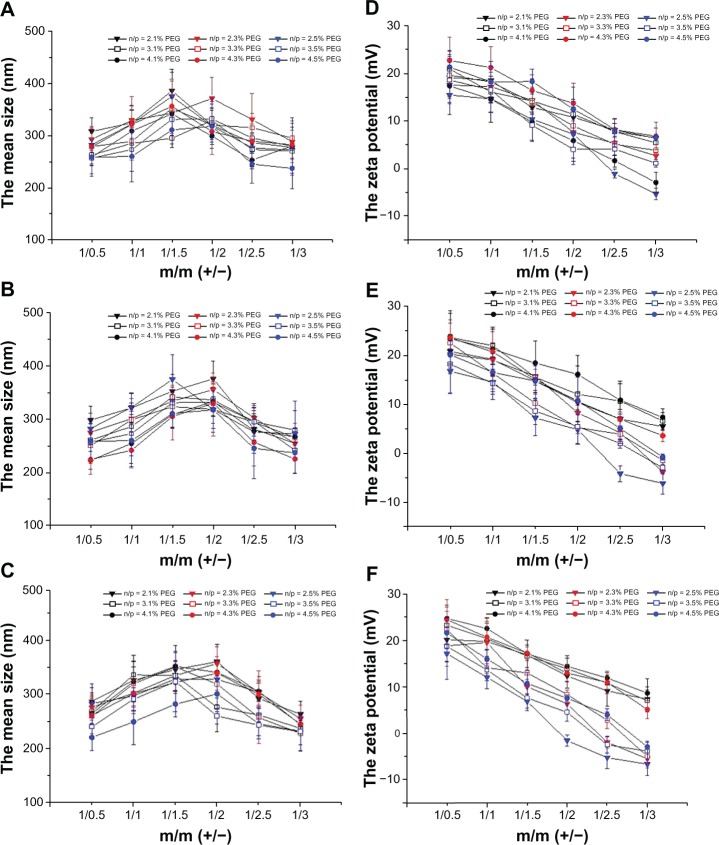
As shown in Figure 7A–C, the complexes of DC-Chol/DOPE liposomes/pDNA and pH-sensitive PEGylated liposomes had a size of 200–400 nm, which was significantly larger than that of the DC-Chol/DOPE liposomes/pDNA complexes. The size of the complexes of DC-Chol/DOPE liposomes/pDNA and pH-sensitive PEGylated liposomes gradually decreased with increasing degrees of PEGylation. There was no significant difference between the complexes of DC-Chol/DOPE liposomes/pDNA and pH-sensitive PEGylated liposomes according to the different molar ratios of DC-Chol/DOPE. The size of the complexes of DC-Chol/DOPE liposomes/pDNA and pH-sensitive PEGylated liposomes increased with increasing amounts of pH-sensitive liposomes. However, the size decreased when the ratio of positive to negative charge was higher than 1:2.
Figure 7.
(A–C) Size and (D–F) zeta potential of complexes of DC-Chol/DOPE liposomes/pDNA and pH-sensitive PEGylated liposomes. (A and D) Complexes of DC-Chol/DOPE (1/1) liposomes/pDNA and pH-sensitive PEGylated liposomes, (B and E) complexes of DC-Chol/DOPE (2/3) liposomes/pDNA and pH-sensitive PEGylated liposomes, and (C and F) complexes of DC-Chol/DOPE (1/2) liposomes/pDNA and pH-sensitive PEGylated liposomes.
Note: Data are presented as the mean ± standard deviation (n = 3).
Abbreviations: DC-Chol, 3β-[N-(N′,N′-dimethylaminoethane) carbamoyl] cholesterol; DOPE, dioleoylphosphatidyl ethanolamine; PEG, poly(ethylene glycol).
As shown in Figure 7D–F, the zeta potential of the complexes of DC-Chol/DOPE liposomes/pDNA and pH-sensitive PEGylated liposomes gradually decreased with increasing increase amounts of pH-sensitive liposomes (Figure 7D–F). When the ratio of the positive to negative charge was higher than 1:2.5, the zeta potential of some complexes of DC-Chol/DOPE liposomes/pDNA and pH-sensitive PEGylated liposomes became negative, suggesting that the negative charge on the pH-sensitive PEGylated liposomes offset the positive charge on the DC-Chol/DOPE liposomes/pDNA complexes.
Colocalization of complexes of DC-Chol/DOPE liposomes/pH-sensitive PEGylated liposomes
Confocal microscopy was also used to observe colocalization of the FITC-labeled DC-Chol/DOPE (2:3) liposomes and the rhodamine-labeled pH-sensitive PEGylated liposomes (Figure 8). On superimposing the images of Figure 8A and B, green and red fluorescence colocalized within the liposomal complexes, suggesting that FITC-labeled DC-Chol/DOPE (2:3) liposomes were colocalized with rhodamine-labeled pH-sensitive PEGylated liposomes in the complexes of DC-Chol/DOPE (2:3) liposomes/pH-sensitive liposomes with a charge ratio of 1/1 (m/m [+/−]).
Figure 8.

Confocal microscopy was performed to observe colocalization of FITC-labeled DC-Chol/DOPE (2/3) liposomes and rhodamine-labeled pH-sensitive PEGylated liposomes in complexes of DC-Chol/DOPE (2/3) liposomes/pH-sensitive PEGylated liposomes with a charge ratio of 1/1 (m/m [+/−]). (A) Rhodamine-labeled pH-sensitive PEGylated liposomes, (B) FITC-labeled DC-Chol/DOPE (2/3) liposomes, and (C) merged images.
Note: Bar represents 5 μm.
Abbreviations: DC-Chol, 3β-[N-(N′,N′-dimethylaminoethane) carbamoyl] cholesterol; DOPE, dioleoylphosphatidyl ethanolamine; FITC, fluorescein isothiocyanate; PEG, poly(ethylene glycol).
Gel retardation assay of complexes of DC-Chol/DOPE liposomes/pDNA and pH-sensitive PEGylated liposomes
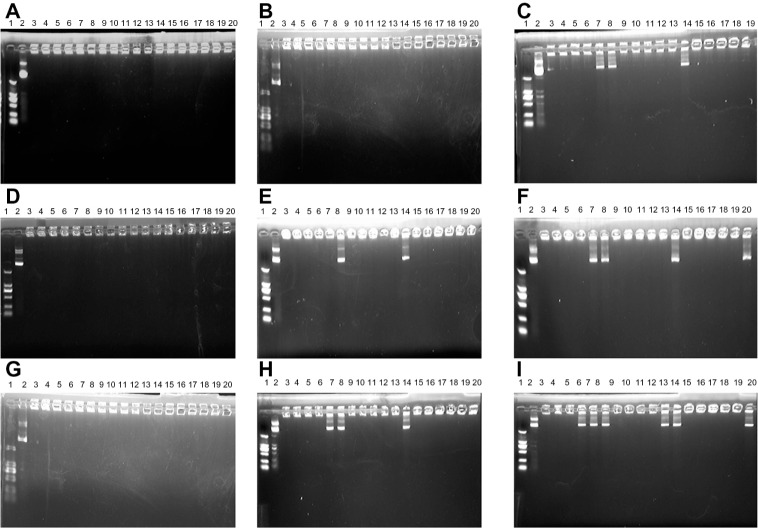
Gel retardation assay of complexes of DC-Chol/DOPE (1:1) liposomes/pDNA and pH-sensitive PEGylated liposomes (Figure 9A–C), showed that liposomal complexes containing 1% or 3% PEG could completely encapsulate pDNA, whereas three of the liposomal complexes with 5% PEG could not do so. Similar results were obtained for the complexes of DC-Chol/DOPE (2:3 or 1:2) liposomes/pDNA and pH-sensitive PEGylated liposomes (Figure 9D–I). These results suggest that PEGylation can significantly reduce the pDNA binding affinity of the complexes of DC-Chol/DOPE liposomes/pDNA and pH-sensitive PEGylated liposomes.
Figure 9.
Gel retardation assay of complexes of DC-Chol/DOPE liposomes/pDNA and pH-sensitive PEGylated liposomes run through 1% agarose gel. The mobility of pDNA was visualized by ethidium bromide staining. (A–C) Complexes of DC-Chol/DOPE (1/1) liposomes/pDNA and pH-sensitive PEGylated liposomes, (D–F) complexes of DC-Chol/DOPE (2/3) liposomes/pDNA and pH-sensitive PEGylated liposomes, and (G–I) complexes of DC-Chol/DOPE (1/2) liposomes/pDNA and pH-sensitive PEGylated liposomes. (A, D and G) Complexes of DC-Chol/DOPE liposomes/pDNA and pH-sensitive PEGylated (1%) liposomes, (B, E and H) complexes of DC-Chol/DOPE liposomes/pDNA and pH-sensitive 3% PEGylated liposomes, and (G–I) complexes of DC-Chol/DOPE liposomes/pDNA and pH-sensitive 5% PEGylated liposomes.
Notes: Lane 1, DNA marker; lane 2, naked pDNA; lanes 3–8, complexes of DC-Chol/DOPE liposomes/pDNA and pH-sensitive PEGylated liposomes with an N/P ratio of 2 and different charge ratios of 1/0.5, 1/1, 1/1.5, 1/2, 1/2.5, and 1/3 (m/m [+/−]); lanes 9–14, complexes of DC-Chol/DOPE liposomes/pDNA and pH-sensitive PEGylated liposomes with an N/P ratio of 3 and charge ratios of 1/0.5, 1/1, 1/1.5, 1/2, 1/2.5, and 1/3 (m/m [+/−]); lanes 15–20, complexes of DC-Chol/DOPE liposomes/pDNA and pH-sensitive PEGylated liposomes with an N/P ratio of 4 and charge ratios of 1/0.5, 1/1, 1/1.5, 1/2, 1/2.5, and 1/3 (m/m [+/−]).
Abbreviations: DC-Chol, 3β-[N-(N′,N′-dimethylaminoethane) carbamoyl] cholesterol; DOPE, dioleoylphosphatidyl ethanolamine; PEG, poly(ethylene glycol).
pH sensitivity of PEGylated liposome complexes
Figure 10 shows that both pH-sensitive PEGylated liposomes and the complexes of DC-Chol/DOPE liposomes/pDNA and pH-sensitive PEGylated liposomes had reduced pH sensitivity compared with their non-PEGylated counterparts (P < 0.05 at pH 4.5, 5.0, 5.5, 6.0 and 6.5). Further, the liposomal complexes with more PEGylation had less pH sensitivity. When PEGylation was 1%, the calcein release rate from PEGylated pH-sensitive liposomes was 45%, whereas the calcein release rate from the complexes of DC-Chol/DOPE liposomes/pDNA and pH-sensitive PEGylated liposomes was about 40%. However, none of the PEGylated liposomes showed obvious pH sensitivity when PEGylation was 5%, suggesting that degree of PEGylation is the critical factor affecting pH sensitivity.
Figure 10.
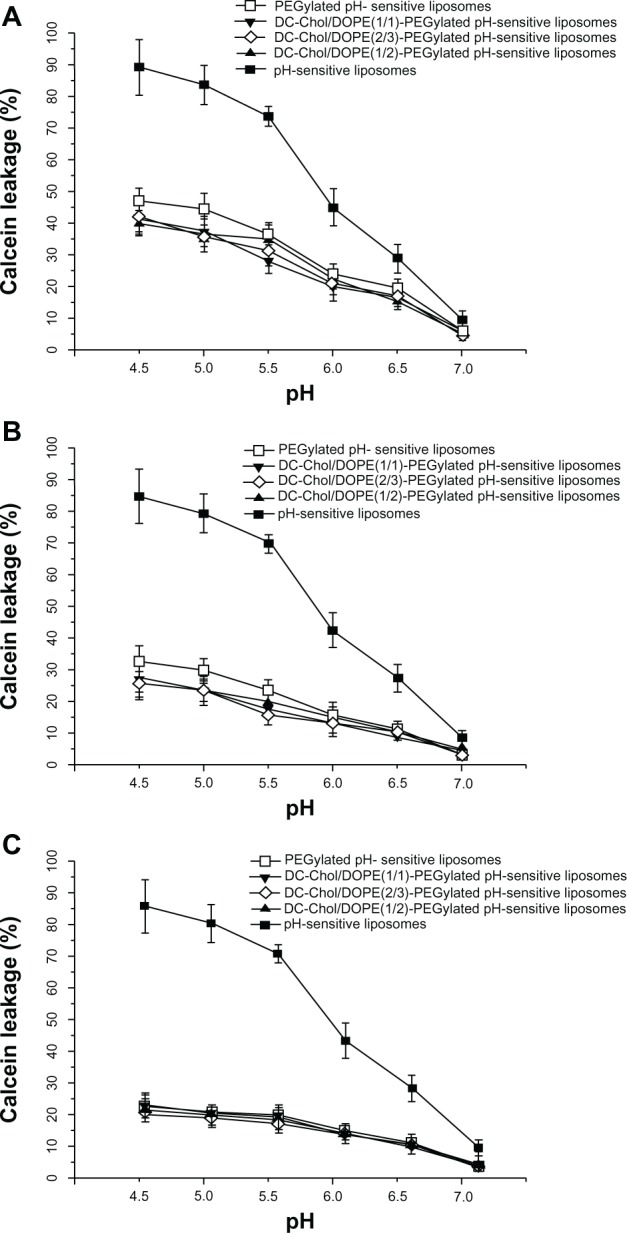
pH sensitivity of complexes of DC-Chol/DOPE liposomes/pDNA and pH-sensitive PEGylated liposomes. The calcein release rate was calculated using the formula: (F1 − F0)/(F2 − F0) × 100%. (A) pH-sensitive 1% PEGylated liposomes and complexes of DC-Chol/DOPE liposomes/pH-sensitive 1% PEGylated liposomes, (B) pH-sensitive 3% PEGylated liposomes and complexes of DC-Chol/DOPE liposomes/pH-sensitive 3% PEGylated liposomes, and (C) pH-sensitive 5% PEGylated liposomes and complexes of DC-Chol/DOPE liposomes/pH-sensitive 5% PEGylated liposomes.
Note: Data are presented as the mean ± standard deviation (n = 3).
Abbreviations: DC-Chol, 3β-[N-(N′,N′-dimethylaminoethane) carbamoyl] cholesterol; DOPE, dioleoylphosphatidyl ethanolamine; PEG, poly(ethylene glycol).
pDNA transfection and cell viability of complexes of DC-Chol/DOPE liposomes/pDNA and pH-sensitive PEGylated liposomes
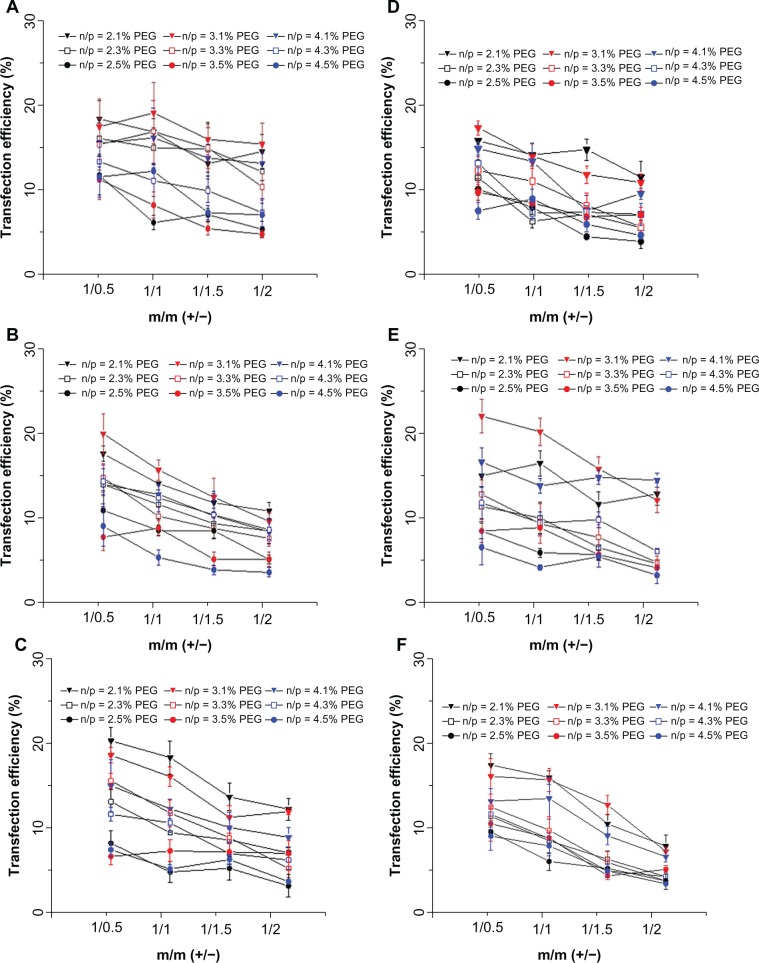
As demonstrated in Figure 4, the transfection efficiency of complexes of DC-Chol/DOPE liposomes/pDNA and pH-sensitive liposomes (m/m [+/−] = 1:2.5 and 1:3) was low, so these were omitted in subsequent experiments. Figure 11 shows that PEGylation could inhibit the transfection efficiency of the complexes of DC-Chol/DOPE liposomes/pDNA and pH-sensitive PEGylated liposomes to a marked extent. The complexes of DC-Chol/DOPE liposomes/pDNA and pH-sensitive PEGylated liposomes showed very low transfection efficiency when PEGylation was 5%. Notably, in serum containing transfection medium, the complexes of DC-Chol/DOPE (2:3) liposomes/pDNA and pH-sensitive PEGylated (1%) liposomes with an N/P ratio of 3 (m/m [+/−] = 1:0.5) showed a high transfection efficiency of 22.94% while complexes of DC-Chol/DOPE (1:2) liposomes/pDNA and pH-sensitive PEGylated (1%) liposomes with an N/P ratio of 2 (m/m [+/−] = 1:1) showed a high transfection efficiency of 20.07%. Therefore, these complexes of DC-Chol/DOPE liposomes/pDNA and pH-sensitive PEGylated liposomes were used in subsequent experiments.
Figure 11.
In vitro pDNA transfection assays of complexes of DC-Chol/DOPE liposomes/pDNA and pH-sensitive PEGylated liposomes. HepG2 cells were seeded in 24-well plates at a density of 2 × 10⁵ cells per well overnight. Liposomal complexes containing 0.5 μg pDNA were incubated with the cells for 8 hours, after which the culture medium was refreshed. Forty-eight hours later, the cells were trypsinized, washed, and analyzed by flow cytometry. Transfection efficiency was determined as the percentage of transfected cells against all cells counted in the absence (A–C) and presence (D–F) of serum. (A and D) Complexes of DC-Chol/DOPE (1/1) liposomes/pDNA and pH-sensitive PEGylated liposomes, (B and E) complexes of DC-Chol/DOPE (2/3) liposomes/pDNA and pH-sensitive PEGylated liposomes, and (C and F) complexes of DC-Chol/DOPE (1/2) liposomes/pDNA and pH-sensitive PEGylated liposomes.
Note: Data are presented as the mean ± standard deviation (n = 3).
Abbreviations: DC-Chol, 3β-[N-(N′,N′-dimethylaminoethane) carbamoyl] cholesterol; DOPE, dioleoylphosphatidyl ethanolamine; PEG, poly(ethylene glycol).
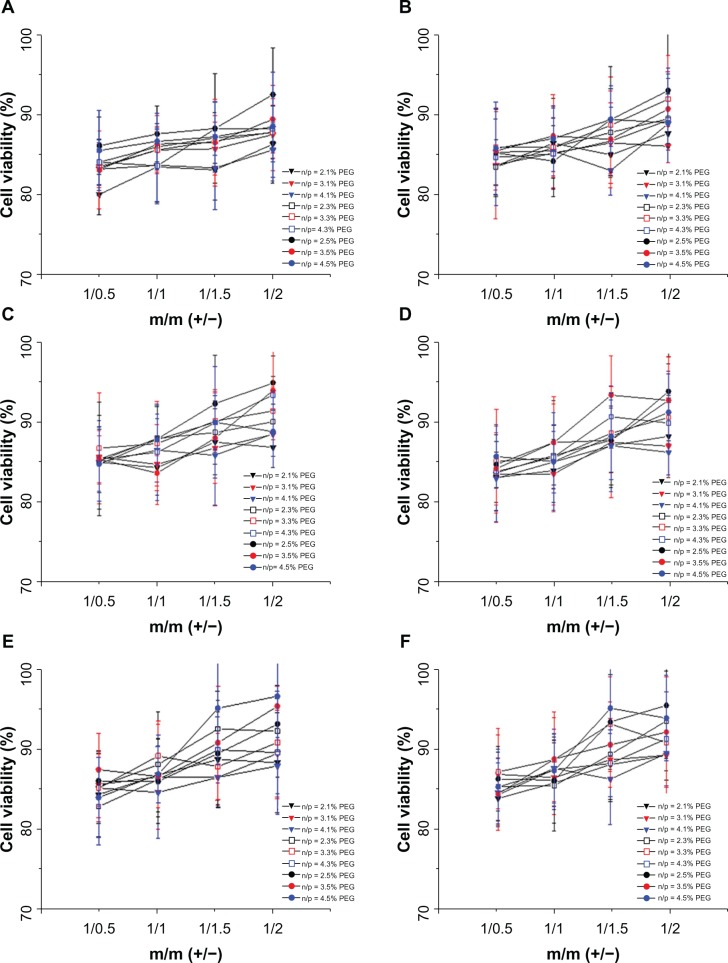
Figure 12 shows that the cytotoxicity of the complexes of DC-Chol/DOPE liposomes/pDNA and pH-sensitive PEGylated liposomes was decreased (cell viability with some liposomes complexes was as high as 90%) compared with their non-PEGylated counterparts or corresponding DC-Chol/DOPE liposomes/pDNA complexes. The cytotoxic effect of the complexes of DC-Chol/DOPE liposomes/pDNA and pH-sensitive PEGylated liposomes decreased with increasing PEGylation, suggesting that the degree of PEGylation reduced the cytotoxic effect of the complexes of DC-Chol/DOPE liposomes/pDNA and pH-sensitive PEGylated liposomes. Also, the cytotoxicity of the complexes of DC-Chol/DOPE liposomes/pDNA and pH-sensitive PEGylated liposomes increased with increasing N/P ratio.
Figure 12.
Cell viability assay of complexes of DC-Chol/DOPE liposomes/pDNA and pH-sensitive PEGylated liposomes. HepG2 cells were seeded in 24-well plates at a density of 2 × 10⁵ cells per well overnight. Liposomal complexes containing 0.5 μg pDNA were incubated with the cells for 8 hours, after which the culture medium was refreshed. Forty-eight hours later, cell proliferation was evaluated by adding 20 μL of MTT (5 mg/mL) solution to each well. Cell viability was calculated using the formula: [(AE − AB)/(AC − AB)]. AE, AC, and AB were defined as the absorbance of experimental samples, untreated samples, and blank controls, respectively, in the absence (A–C) and presence (D–F) of serum. (A and D) Complexes of DC-Chol/DOPE (1/1) liposomes/pDNA and pH-sensitive PEGylated liposomes, (B and E) complexes of DC-Chol/DOPE (2/3) liposomes/pDNA and pH-sensitive PEGylated liposomes, and (C and F) complexes of DC-Chol/DOPE (1/2) liposomes/pDNA and pH-sensitive PEGylated liposomes.
Note: Data are presented as the mean ± standard deviation (n = 3).
Abbreviations: DC-Chol, 3β-[N-(N′,N′-dimethylaminoethane) carbamoyl] cholesterol; DOPE, dioleoylphosphatidyl ethanolamine; PEG, poly(ethylene glycol).
In vivo study
As shown in Figure 13, Dir-labeled DC-Chol/DOPE (2:3) liposomes were detected in the liver, but not in tumor tissue, at all time points. In contrast, Dir-labeled, pH-sensitive, 1% PEGylated liposomes were detected in both the liver and tumor tissue at one hour after administration. After 12 hours, the Dir-labeled, pH-sensitive, 1% PEGylated liposomes could still be detected in the tumor tissue. Complexes of DC-Chol/DOPE (2:3) liposomes/pH-sensitive 1% PEGylated liposomes with a charge ratio of 1:1 (m/m [+/−]) could be detected in both the liver and tumor tissue, although accumulation in the tumor was less than that in the liver.
Figure 13.
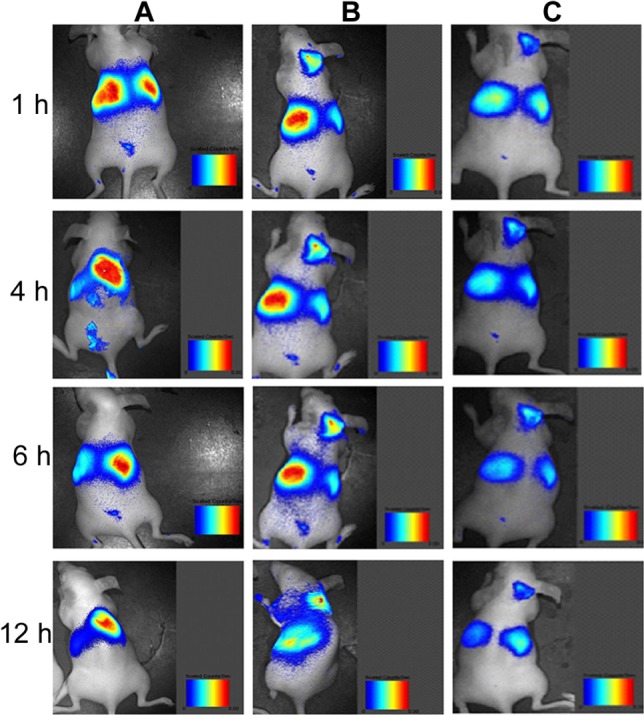
BALB/c nude mice bearing subcutaneous HepG2 tumors were randomly assigned to three different treatment groups (three mice per group). Dir-labeled DC-Chol/DOPE (2/3) liposomes (A), pH-sensitive 1% PEGylated liposomes (B), and complexes of DC-Chol/DOPE (2/3) liposomes/pH-sensitive 1% PEGylated liposomes with a charge ratio of 1/1 (m/m 9+/−) (C) were injected intravenously as a single dose via the tail vein.
Notes: The mice were anaesthetized by 5% (m/v) chloral hydrate. At a series of time points after injection, in vivo images were observed using a Maestro Dynamic™ in vivo imaging system and recorded by a built-in charged-coupled device camera.
Abbreviations: DC-Chol, 3β-[N-(N′,N′-dimethylaminoethane) carbamoyl] cholesterol; DOPE, dioleoylphosphatidyl ethanolamine; PEG, poly(ethylene glycol).
Discussion
Gene therapy is a promising therapeutic tool for genetic diseases, including cancer.19 Nonviral vectors based on the use of cationic lipids or polymers appear to have potential, given the problems of safety encountered with viral vectors.20 Use of nonviral vectors, eg, pH-sensitive liposomes, which take advantage of the acidification of tumor tissue and show significantly enhanced drug release in an acidic environment, is an effective therapeutic strategy in gene therapy. However, the low transfection efficiency of pH-sensitive liposomes needs to be overcome as soon as possible. In this study, we prepared complexes of DC-Chol/DOPE liposomes and pH-sensitive liposomes and evaluated the effects of various factors on the pDNA transfection efficiency of these liposomal complexes. The results show that all complexes of DC-Chol/DOPE liposomes/pDNA and pH-sensitive liposomes (with or without PEGylation) had similarly potent pH sensitivity.
The molar ratio of DC-Chol to DOPE is a critical factor affecting the transfection efficiency of DC-Chol/DOPE liposomes.16 We prepared DC-Chol/DOPE liposomes of different molar ratios (1:1, 2:3, and 1:2). The results indicate that their pDNA binding affinity was similar, but that DC-Chol/DOPE (1:1) liposomes showed lower transfection efficiency than that of DC-Chol/DOPE (2:3) liposomes and DC-Chol/DOPE (1:2) liposomes. Our results are consistent with those in a previous report by Zhang et al.16 Previous studies have demonstrated that DOPE significantly affects the polymorphic features of lipoplexes because it may promote transition from a lamellar to a hexagonal phase, which could facilitate endosomal escape and enhance transfection efficiency.5 Our results confirm that DOPE plays an important role in pDNA transfection.
The complexes of DC-Chol/DOPE liposomes/pDNA and pH-sensitive liposomes had a large size (300–400 nm), and were significantly larger than the DC-Chol/DOPE liposomes/pDNA complexes. Colocalization of DC-Chol/DOPE liposomes and pH-sensitive liposomes was demonstrated by confocal microscopy. The pDNA binding affinity of the complexes of DC-Chol/DOPE liposomes/pDNA and pH-sensitive liposomes was not significantly reduced, although pH-sensitive liposomes decreased the zeta potential of the complexes. It has to be noted that complexes of DC-Chol/DOPE liposomes/pH-sensitive liposomes show similar but slightly reduced pH sensitivity compared with pH-sensitive liposomes. The transfection efficiency of all the complexes of DC-Chol/DOPE liposomes/pDNA and pH-sensitive liposomes showed similar or less transfection efficiency and lower cytotoxicity than did corresponding DC-Chol/DOPE liposomes/pDNA complexes at the same molar ratio of DC-Chol/DOPE and the same N/P ratio. Our results show that the complexes of DC-Chol/DOPE liposomes/pDNA and pH-sensitive liposomes were successfully prepared, as demonstrated by liposomal colocalization and superior pH sensitivity. The reduced transfection efficiency of the complexes of DC-Chol/DOPE liposomes/pDNA and pH-sensitive liposomes might be due to reduction of the positive charge by the anionic pH-sensitive liposomes. In this regard, our results are consistent with previous reports.11,12
PEGylation is a significant modification strategy for improving the stability and extending the lifetime of liposomes in vivo.21 However, our results show that PEGylation, although reducing the size and surface charge density of liposomes, can significantly reduce the pDNA transfection efficiency of complexes of DC-Chol/DOPE liposomes/pDNA and pH-sensitive PEGylated liposomes, which is consistent with a previous report.22 PEGylation also reduces the cytotoxicity and pH sensitivity of complexes of DC-Chol/DOPE liposomes/pDNA and pH-sensitive PEGylated liposomes. Our finding that PEGylation had a negative effect on the pH-sensitivity of pH-sensitive liposomes is again consistent with previous studies.23,24 Thus, although PEGylation may significantly prolong the circulation of liposomes, it can reduce the pH-sensitivity of pH-sensitive PEGylated liposomes. Although showing inferior transfection efficiency compared with DC-Chol/DOPE liposomes, complexes of DC-Chol/DOPE liposomes and pH-sensitive PEGylated liposomes were demonstrated to show enhanced accumulation in tumor tissue in vivo compared with DC-Chol/DOPE liposomes. The complexes of DC-Chol/DOPE liposomes/pDNA and pH-sensitive PEGylated liposomes prepared in this study show promise for application in tumor gene therapy.
Conclusion
Our results identify factors influencing pDNA transfection efficiency in complexes of DC-Chol/DOPE liposomes and pH-sensitive PEGylated liposomes. We developed two optimized complexes of DC-Chol/DOPE liposomes and pH-sensitive PEGylated liposomes. Comprehension of their mechanisms will lead to design of better adapted complexes of DC-Chol/DOPE liposomes and pH-sensitive PEGylated liposomes for application in gene therapy.
Supplemental figures
Size, polydispersity index, and zeta potential of DC-Chol/DOPE liposomes/pDNA complexes. (A) Size (B), polydispersity index, and (C) zeta potential of DC-Chol/DOPE liposomes/pDNA complexes.
Note: Data are presented as the mean ± standard deviation (n = 3).
Abbreviations: DC-Chol, 3β-[N-(N′,N′-dimethylaminoethane) carbamoyl] cholesterol; DOPE, dioleoylphosphatidyl ethanolamine.
Gel retardation assay of DC-Chol/DOPE liposomes/pDNA complexes run through 1% agarose gel. The mobility of pDNA was visualized by ethidium bromide staining. (A) DC-Chol/DOPE (1/1) liposomes/pDNA complexes, (B) DC-Chol/DOPE (2/3) liposomes/pDNA complexes, and (C) DC-Chol/DOPE (1/2) liposomes/pDNA complexes.
Note: Lane 1, DNA marker; lane 2, naked pDNA; lanes 3–5, DC-Chol/DOPE liposomes/pDNA complexes (with N/P ratios of 2, 3 and 4, respectively).
Abbreviations: DC-Chol, 3β-[N-(N′,N′-dimethylaminoethane) carbamoyl] cholesterol; DOPE, dioleoylphosphatidyl ethanolamine.
(A and B) In vitro pDNA transfection assays and (C and D) cell viability assay of DC-Chol/DOPE liposomes/pDNA complexes. HepG2 cells were seeded in 24-well plates at a density of 2 × 10⁵ cells per well overnight. The DC-Chol/DOPE liposomes/pDNA complexes containing 0.5 μg pDNA were incubated with the cells for 8 hours, after which the culture medium was refreshed. Forty-eight hours later, the cells were trypsinized, washed, and analyzed by flow cytometry. Transfection efficiency was determined as the percentage of cells transfected against all cells counted. Cell viability was assayed using the MTT method in the absence (A and C) and presence (B and D) of serum.
Note: Data are presented as the mean ± standard deviation (n = 3).
Abbreviations: DC-Chol, 3β-[N-(N′,N′-dimethylaminoethane) carbamoyl] cholesterol; DOPE, dioleoylphosphatidyl ethanolamine.
Atomic force microscopy in which 10 μL of liposomes was placed in a piece of mica and observed at a scanning frequency of 1 Hz and in a scanning field of 2.5 μm × 2.5 μm. (A and D) DC-Chol/DOPE (2/3) liposomes, (B and E) pH-sensitive liposomes, and (C and F) a complex of DC-Chol/DOPE (2/3) liposomes/pH-sensitive liposomes with a charge ratio of 1/1 (m/m [+/−]).
Abbreviations: DC-Chol, 3β-[N-(N′,N′-dimethylaminoethane) carbamoyl] cholesterol; DOPE, dioleoylphosphatidyl ethanolamine.
Confocal microscopy showing colocalization of FITC-labeled DC-Chol/DOPE (2/3) liposomes and rhodamine-labeled pH-sensitive liposomes in a complex of DC-Chol/DOPE (2/3) liposomes/pH-sensitive liposomes with a charge ratio of 1/1 (m/m [+/−]). (A) Rhodamine-labeled pH-sensitive liposomes, (B) FITC-labeled DC-Chol/DOPE (2/3) liposomes, and (C) merged images.
Note: Bar represents 5 μm.
Abbreviations: DC-Chol, 3β-[N-(N′,N′-dimethylaminoethane) carbamoyl] cholesterol; DOPE, dioleoylphosphatidyl ethanolamine; FITC, fluorescein isothiocyanate.
Gel retardation assays in which complexes of DC-Chol/DOPE liposomes/pDNA and pH-sensitive liposomes were run through 1% agarose gel. The mobility of pDNA was visualized by ethidium bromide staining. (A) Complexes of DC-Chol/DOPE (1/1) liposomes/pDNA and pH-sensitive liposomes, (B) complexes of DC-Chol/DOPE (2/3) liposomes/pDNA and pH-sensitive liposomes, and (C) complexes of DC-Chol/DOPE (1/2) liposomes/pDNA and pH-sensitive liposomes.
Note: Lane 1, DNA marker; lane 2, naked pDNA; lanes 3–8, complexes of DC-Chol/DOPE liposomes/pDNA and pH-sensitive liposomes with an N/P ratio of 2 and charge ratios of 1/0.5, 1/1, 1/1.5, 1/2, 1/2.5, and 1/3 (m/m [+/−]); lanes 9–14, complexes of DC-Chol/DOPE liposomes/pDNA and pH-sensitive liposomes with an N/P ratio of 3 and charge ratios of 1/0.5, 1/1, 1/1.5, 1/2, 1/2.5, and 1/3 (m/m [+/−]); and lanes 15–20, complexes of DC-Chol/DOPE liposomes/pDNA and pH-sensitive liposomes with an N/P ratio of 4 and charge ratios of 1/0.5, 1/1, 1/1.5, 1/2, 1/2.5, and 1/3 (m/m [+/−]).
Abbreviations: DC-Chol, 3β-[N-(N′,N′-dimethylaminoethane) carbamoyl] cholesterol; DOPE, dioleoylphosphatidyl ethanolamine; FITC, fluorescein isothiocyanate.
Figure 6.
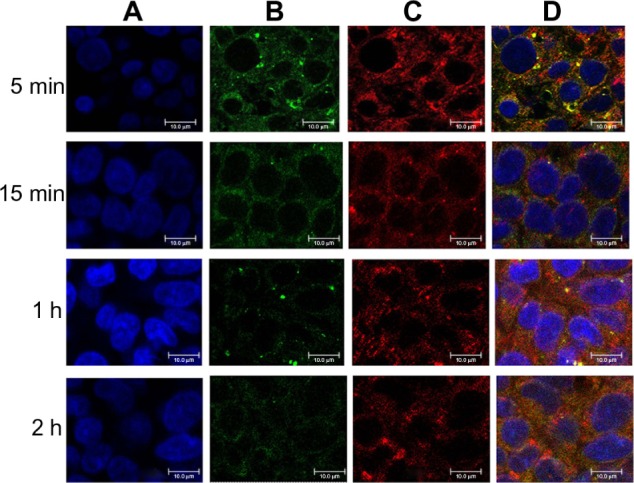
Binding and internalization of complexes of FITC-labeled DC-Chol/DOPE (2/3) liposomes/rhodamine-labeled pH-sensitive liposomes with a charge ratio of 1/1 (m/m [+/−]) in HepG2 cells observed by confocal microscopy. Briefly, HepG2 cells were treated with the liposomes for 5, 10, 30, 60, and 120 minutes. After washing with phosphate-buffered solution, the cells were fixed with 4% paraformaldehyde, counterstained with DAPI, and mounted under glass coverslips. Immunofluorescence was visualized by confocal microscopy. (A) DAPI (blue fluorescence), (B) FITC (green fluorescence), (C) rhodamine (red fluorescence), and (D) merged images.
Note: Bar represents 10 μm.
Abbreviations: DC-Chol, 3β-[N-(N′,N′-dimethylaminoethane) carbamoyl] cholesterol; DOPE, dioleoylphosphatidyl ethanolamine; FITC, fluorescein isothiocyanate; DAPI, 4′,6-diamidino-2-phenylindole dihydrochloride.
Acknowledgment
This work was supported financially by the National Natural Science Foundation of China (81072601) and the Foundation of Shanghai Science and Technology Commission (08431902200).
Footnotes
Disclosure
The authors report no conflicts of interest in this work.
References
- 1.Bexell D, Scheding S, Bengzon J. Toward brain tumor gene therapy using multipotent mesenchymal stromal cell vectors. Mol Ther. 2010;18(6):1067–1075. doi: 10.1038/mt.2010.58. [DOI] [PMC free article] [PubMed] [Google Scholar]
- 2.Morille M, Passirani C, Vonarbourg A, Clavreul A, Benoit JP. Progress in developing cationic vectors for non-viral systemic gene therapy against cancer. Biomaterials. 2008;29(24–25):3477–3496. doi: 10.1016/j.biomaterials.2008.04.036. [DOI] [PubMed] [Google Scholar]
- 3.Agarwal A, Unfer R, Mallapragada SK. Novel cationic pentablock copolymers as non-viral vectors for gene therapy. J Control Release. 2005;103(1):245–258. doi: 10.1016/j.jconrel.2004.11.022. [DOI] [PubMed] [Google Scholar]
- 4.Maitani Y, Igarashi S, Sato M, Hattori Y. Cationic liposome (DC-Chol/DOPE = 1:2) and a modified ethanol injection method to prepare liposomes, increased gene expression. Int J Pharm. 2007;342(1–2):33–39. doi: 10.1016/j.ijpharm.2007.04.035. [DOI] [PubMed] [Google Scholar]
- 5.Wasungu L, Hoekstra D. Cationic lipids, lipoplexes and intracellular delivery of genes. J Control Release. 2006;116(2):255–264. doi: 10.1016/j.jconrel.2006.06.024. [DOI] [PubMed] [Google Scholar]
- 6.Esposito C, Generosi J, Mossa G, Masotti A, Castellano AC. The analysis of serum effects on structure, size and toxicity of DDAB-DOPE and DC-Chol-DOPE lipoplexes contributes to explain their different transfection efficiency. Colloids Surf B Biointerfaces. 2006;53(2):187–192. doi: 10.1016/j.colsurfb.2006.09.011. [DOI] [PubMed] [Google Scholar]
- 7.Salvati A, Ciani L, Ristori S, Martini G, Masi A, Arcangeli A. Physico-chemical characterization and transfection efficacy of cationic liposomes containing the pEGFP plasmid. Biophys Chem. 2006;121(1):21–29. doi: 10.1016/j.bpc.2005.12.009. [DOI] [PubMed] [Google Scholar]
- 8.Kim MJ, Lee HJ, Lee IA, et al. Preparation of pH-sensitive, long-circulating and EGFR-targeted immunoliposomes. Arch Pharm Res. 2008;31(4):539–546. doi: 10.1007/s12272-001-1190-9. [DOI] [PubMed] [Google Scholar]
- 9.Tannock I, Rotin D. Acid pH in tumors and its potential for therapeutic exploitation. Cancer Res. 1989;49(16):4373–4384. [PubMed] [Google Scholar]
- 10.Drummond DC, Zignani M, Leroux J. Current status of pH-sensitive liposomes in drug delivery. Prog Lipid Res. 2000;39(5):409–460. doi: 10.1016/s0163-7827(00)00011-4. [DOI] [PubMed] [Google Scholar]
- 11.Simard P, Leroux JC. pH-sensitive immunoliposomes specific to the CD33 cell surface antigen of leukemic cells. Int J Pharm. 2009;381(2):86–96. doi: 10.1016/j.ijpharm.2009.05.013. [DOI] [PubMed] [Google Scholar]
- 12.Hiraka K, Kanehisa M, Tamai M, et al. Preparation of pH-sensitive liposomes retaining SOD mimic and their anticancer effect. Colloids Surf B Biointerfaces. 2008;67(1):54–58. doi: 10.1016/j.colsurfb.2008.07.014. [DOI] [PubMed] [Google Scholar]
- 13.Legendre JY, Szoka FC., Jr Delivery of pDNA into mammalian cell lines using pH-sensitive liposomes: comparison with cationic liposomes. Pharm Res. 1992;9(10):1235–1242. doi: 10.1023/a:1015836829670. [DOI] [PubMed] [Google Scholar]
- 14.Karanth H, Murthy RS. pH-sensitive liposomes – principle and application in cancer therapy. J Pharm Pharmacol. 2007;59(4):469–483. doi: 10.1211/jpp.59.4.0001. [DOI] [PubMed] [Google Scholar]
- 15.Venugopalan P, Jain S, Sankar S, Singh P, Rawat A, Vyas SP. pH-sensitive liposomes: mechanism of triggered release to drug and gene delivery prospects. Pharmazie. 2002;57(10):659–671. [PubMed] [Google Scholar]
- 16.Zhang Y, Li H, Sun J, et al. DC-Chol/DOPE cationic liposomes: a comparative study of the influence factors on plasmid pDNA and siRNA gene delivery. Int J Pharm. 2010;390(2):198–207. doi: 10.1016/j.ijpharm.2010.01.035. [DOI] [PubMed] [Google Scholar]
- 17.Farhood H, Serbina N, Huang L. The role of dioleoyl phosphatidylethanolamine in cationic liposome mediated gene transfer. Biochim Biophys Acta. 1995;1235(2):289–295. doi: 10.1016/0005-2736(95)80016-9. [DOI] [PubMed] [Google Scholar]
- 18.Charudharshini S, Diane B. Optimization and characterization of anionic lipoplexes for gene delivery. J Control Release. 2009;136(1):62–70. doi: 10.1016/j.jconrel.2009.01.022. [DOI] [PubMed] [Google Scholar]
- 19.Hallaj-Nezhadi S, Lotfipour F, Dass C. Nanoparticle-mediated interleukin-12 cancer gene therapy. J Pharm Pharm Sci. 2010;13(3):472–485. doi: 10.18433/j3630v. [DOI] [PubMed] [Google Scholar]
- 20.Männistö M, Reinisalo M, Ruponen M, Honkakoski P, Tammi M, Urtti A. Polyplex-mediated gene transfer and cell cycle: effect of carrier on cellular uptake and intracellular kinetics and significance of glycosaminoglycans. J Gene Med. 2007;9(6):479–487. doi: 10.1002/jgm.1035. [DOI] [PubMed] [Google Scholar]
- 21.Gao J, Sun J, Li H, et al. Lyophilized HER2-specific PEGylated immunoliposomes for active siRNA gene silencing. Biomaterials. 2010;31(9):2655–2664. doi: 10.1016/j.biomaterials.2009.11.112. [DOI] [PubMed] [Google Scholar]
- 22.Knorr V, Ogris M, Wagner E. An acid sensitive ketal-based polyethylene glycol-oligoethylenimine copolymer mediates improved transfection efficiency at reduced toxicity. Pharm Res. 2008;25(12):2937–2945. doi: 10.1007/s11095-008-9700-6. [DOI] [PubMed] [Google Scholar]
- 23.Simões S, Moreira JN, Fonseca C, Düzgüneş N, de Lima MC. On the formulation of pH-sensitive liposomes with long circulation times. Adv Drug Deliv Rev. 2004;56(7):947–965. doi: 10.1016/j.addr.2003.10.038. [DOI] [PubMed] [Google Scholar]
- 24.Momekova D, Rangelov S, Lambov N. Long-circulating, pH-sensitive liposomes. Methods Mol Biol. 2010;605:527–544. doi: 10.1007/978-1-60327-360-2_35. [DOI] [PubMed] [Google Scholar]
Associated Data
This section collects any data citations, data availability statements, or supplementary materials included in this article.
Supplementary Materials
Size, polydispersity index, and zeta potential of DC-Chol/DOPE liposomes/pDNA complexes. (A) Size (B), polydispersity index, and (C) zeta potential of DC-Chol/DOPE liposomes/pDNA complexes.
Note: Data are presented as the mean ± standard deviation (n = 3).
Abbreviations: DC-Chol, 3β-[N-(N′,N′-dimethylaminoethane) carbamoyl] cholesterol; DOPE, dioleoylphosphatidyl ethanolamine.
Gel retardation assay of DC-Chol/DOPE liposomes/pDNA complexes run through 1% agarose gel. The mobility of pDNA was visualized by ethidium bromide staining. (A) DC-Chol/DOPE (1/1) liposomes/pDNA complexes, (B) DC-Chol/DOPE (2/3) liposomes/pDNA complexes, and (C) DC-Chol/DOPE (1/2) liposomes/pDNA complexes.
Note: Lane 1, DNA marker; lane 2, naked pDNA; lanes 3–5, DC-Chol/DOPE liposomes/pDNA complexes (with N/P ratios of 2, 3 and 4, respectively).
Abbreviations: DC-Chol, 3β-[N-(N′,N′-dimethylaminoethane) carbamoyl] cholesterol; DOPE, dioleoylphosphatidyl ethanolamine.
(A and B) In vitro pDNA transfection assays and (C and D) cell viability assay of DC-Chol/DOPE liposomes/pDNA complexes. HepG2 cells were seeded in 24-well plates at a density of 2 × 10⁵ cells per well overnight. The DC-Chol/DOPE liposomes/pDNA complexes containing 0.5 μg pDNA were incubated with the cells for 8 hours, after which the culture medium was refreshed. Forty-eight hours later, the cells were trypsinized, washed, and analyzed by flow cytometry. Transfection efficiency was determined as the percentage of cells transfected against all cells counted. Cell viability was assayed using the MTT method in the absence (A and C) and presence (B and D) of serum.
Note: Data are presented as the mean ± standard deviation (n = 3).
Abbreviations: DC-Chol, 3β-[N-(N′,N′-dimethylaminoethane) carbamoyl] cholesterol; DOPE, dioleoylphosphatidyl ethanolamine.
Atomic force microscopy in which 10 μL of liposomes was placed in a piece of mica and observed at a scanning frequency of 1 Hz and in a scanning field of 2.5 μm × 2.5 μm. (A and D) DC-Chol/DOPE (2/3) liposomes, (B and E) pH-sensitive liposomes, and (C and F) a complex of DC-Chol/DOPE (2/3) liposomes/pH-sensitive liposomes with a charge ratio of 1/1 (m/m [+/−]).
Abbreviations: DC-Chol, 3β-[N-(N′,N′-dimethylaminoethane) carbamoyl] cholesterol; DOPE, dioleoylphosphatidyl ethanolamine.
Confocal microscopy showing colocalization of FITC-labeled DC-Chol/DOPE (2/3) liposomes and rhodamine-labeled pH-sensitive liposomes in a complex of DC-Chol/DOPE (2/3) liposomes/pH-sensitive liposomes with a charge ratio of 1/1 (m/m [+/−]). (A) Rhodamine-labeled pH-sensitive liposomes, (B) FITC-labeled DC-Chol/DOPE (2/3) liposomes, and (C) merged images.
Note: Bar represents 5 μm.
Abbreviations: DC-Chol, 3β-[N-(N′,N′-dimethylaminoethane) carbamoyl] cholesterol; DOPE, dioleoylphosphatidyl ethanolamine; FITC, fluorescein isothiocyanate.
Gel retardation assays in which complexes of DC-Chol/DOPE liposomes/pDNA and pH-sensitive liposomes were run through 1% agarose gel. The mobility of pDNA was visualized by ethidium bromide staining. (A) Complexes of DC-Chol/DOPE (1/1) liposomes/pDNA and pH-sensitive liposomes, (B) complexes of DC-Chol/DOPE (2/3) liposomes/pDNA and pH-sensitive liposomes, and (C) complexes of DC-Chol/DOPE (1/2) liposomes/pDNA and pH-sensitive liposomes.
Note: Lane 1, DNA marker; lane 2, naked pDNA; lanes 3–8, complexes of DC-Chol/DOPE liposomes/pDNA and pH-sensitive liposomes with an N/P ratio of 2 and charge ratios of 1/0.5, 1/1, 1/1.5, 1/2, 1/2.5, and 1/3 (m/m [+/−]); lanes 9–14, complexes of DC-Chol/DOPE liposomes/pDNA and pH-sensitive liposomes with an N/P ratio of 3 and charge ratios of 1/0.5, 1/1, 1/1.5, 1/2, 1/2.5, and 1/3 (m/m [+/−]); and lanes 15–20, complexes of DC-Chol/DOPE liposomes/pDNA and pH-sensitive liposomes with an N/P ratio of 4 and charge ratios of 1/0.5, 1/1, 1/1.5, 1/2, 1/2.5, and 1/3 (m/m [+/−]).
Abbreviations: DC-Chol, 3β-[N-(N′,N′-dimethylaminoethane) carbamoyl] cholesterol; DOPE, dioleoylphosphatidyl ethanolamine; FITC, fluorescein isothiocyanate.


