Abstract
Magnetomotive optical coherence tomography (MM-OCT) is a functional extension of OCT which utilizes magnetically responsive materials that are modulated by an external magnetic field for contrast enhancement and for elastography to assess the structural and viscoelastic properties of the surrounding tissues. Traditionally, magnetomotive contrast relies on the interaction between the displacement of magnetic particles induced by an external magnetic field and the micro-environmental restoring (elastic) force acting on the particles. When the restoring force from a sample containing magnetic particles is weak or non-existent, the MM-OCT signal-to-noise ratio (SNR) can degrade significantly. We have developed a novel solenoid configuration to enable MM-OCT imaging in samples that do not have an elastic restoring force, such as liquids. This coil configuration may potentially enable real-time MM-OCT imaging.
OCIS codes: (110.4500) Optical coherence tomography, (170.4090) Modulation techniques, (160.4236) Nanomaterials, (230.3810) Magneto-optic systems
1. Introduction
Optical coherence tomography (OCT) is an established imaging technique which can provide high-resolution cross-sectional imaging in clinical and research applications [1–3]. Magnetomotive OCT (MM-OCT) is a functional extension of OCT which utilizes magnetic nanoparticles (MNPs), and other agents such as microspheres (MSs) containing MNPs, that are modulated by an external magnetic field for contrast enhancement and for elastography to assess the structural and viscoelastic properties of the surrounding tissues [4–6]. Magnetic particles can be functionalized to target specific cellular receptors or pathology, and the magnetomotive response can then be utilized to localize the presence of these particles. For instance, tumor detection with MM-OCT in conjunction with HER-2/neu-targeted MNPs was successfully demonstrated in an in vivo rat mammary tumor model [7]. In another study, thrombi consisting of MNP-labeled platelets in ex vivo porcine arteries were successfully detected with MM-OCT [8]. Other studies have investigated the feasibility of MM-OCT imaging with red blood cells, which are intrinsically magnetically responsive [9, 10].
According to MM-OCT theory, magnetomotive contrast relies on the presence of a restoring force (e.g., cell or tissue elasticity, flow velocity) from the surrounding micro-environment after the perturbation of magnetic particles or magnetically-responsive biological cells (e.g., red blood cells) by a relatively weak external magnetic field [4–6]. These resulting displacements induce changes in the local optical scattering properties which alter the amplitude and phase of the OCT interference pattern, and can be optically measured with nano-scale accuracy using phase-sensitive MM-OCT. However, when the restoring force from a sample with MNPs is weak or non-existent, the MM-OCT signal-to-noise ratio (SNR) can degrade significantly [11]. Additionally, the MM-OCT acquisition speed is limited by the mechanical restoring force, which depends on the elastic properties of the sample [12, 13], and can often be prohibitively slow for fast real-time imaging in biological tissues [5].
Intravascular OCT is commercially available and commonly used in the diagnosis of cardiovascular disease [14, 15]. The addition of magnetomotive contrast in these systems can significantly enhance the utility and potentially enable the detection of early-stage disease, or enhance contrast in ambiguous cases. However, it may be difficult to incorporate magnetomotive contrast with current intravascular OCT systems because the imaging environment (human body) is filled with not only a dynamic fluid (at high flow rates), but also more steady state fluid (at lower flow rates), which has a very low restoring force. These factors challenge the practical application of MM-OCT.
In this paper, we describe a novel solenoid configuration and processing approach which enables MM-OCT imaging in liquids and tissues that either lack or provide only a very weak elastic restoring force. Instead of a conventional single-coil MM-OCT system, a dual-coil approach is employed to overcome the inherent limitations of conventional MM-OCT imaging. The performance of dual-coil MM-OCT imaging is demonstrated with a fluid medium (i.e., phosphate buffered saline (PBS) + magnetic microspheres), which has a very low elastic restoring force. Furthermore, flow conditions generated with a syringe pump are employed to investigate the feasibility of magnetomotive contrast enhancement for in vivo applications.
2. Methodology
2.1 MM-OCT system
Figure 1 diagrams the custom-built dual-coil MM-OCT system, which is based on a spectral domain OCT (SD-OCT) system. This system consists of a titanium:sapphire femtosecond laser (KMLabs, Inc.) centered at 800 nm with a bandwidth of ~100 nm providing an axial resolution of 4 μm. A 40 mm achromatic imaging lens was used to focus the sample arm beam, which provided 16 μm transverse resolution, while galvanometer-mounted mirrors (X-Y axes) were used for scanning the beam over the sample. The optical power on the sample was around 10 mW. The imaging depth was ~2 mm and the displacement sensitivity based on the phase noise of the system was 11 nm. To achieve magnetomotive contrast, external AC magnetic field modulation is provided by a dual-coil configuration placed around the sample (Fig. 1). The alternating magnetic field (B) (Fig. 1(C)) in the primary and secondary coils (45 turns of copper wire; Fig. 1(A)) induces the B-field gradient change on the MNPs. The alternating B-field between the two coils induces MNP translation in the direction of the B-field gradient (Fig. 1(B)). In other words, the secondary (lower) coil is OFF when the primary (upper) coil is ON, and vice versa. The resulting MNP oscillation frequency will therefore be identical to the AC magnetic field frequency. Both coils (primary and secondary) were identical in size (I.D. 3 cm, O.D. 20 cm) and magnetic field strength. A ferrite core placed in each coil was used to increase the strength of the AC magnetic field. The peak-to-peak voltage applied to the coils was 4 Vpp. The magnetic field strength (B) was measured using a Hall probe (Three Axis Magnetic Field Transducer 3M12-2-2-0.2T, SENTRON, Baarerstrasses, ZUG, Switzerland). Each coil delivered a magnetic field of B = 0.02 T at the surface of coil, and axial magnetic field gradients of ∇|B| = 1 T/m and ∇|B|2 = 0.04 T2/m at 300 Hz [5]. Furthermore, there was a decrease in B-field with an increase in the modulation frequency due to the impedance mismatch between coil and power amplifier (Fig. 1(C)).
Fig. 1.
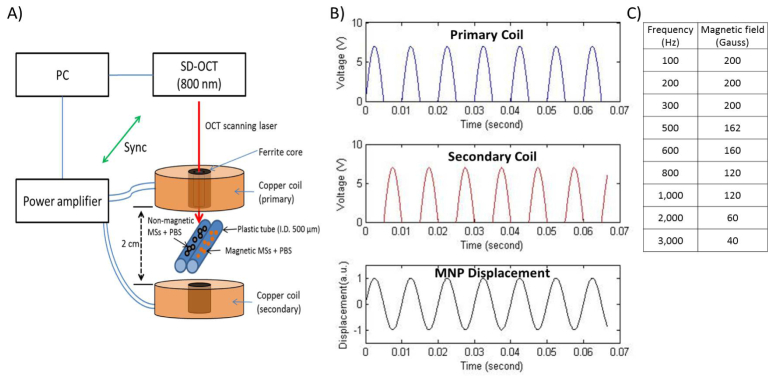
Schematic and output of the dual-coil MM-OCT setup: A) Dual-coil MM-OCT system. The scanning beam for OCT imaging passes through the bore at the center of the coil. B) Visualization of the time-dependent dual-coil activation and the resulting MNP displacement. C) Peak AC magnetic field strength (Gauss) at different modulation frequencies.
The theory of AC magnetic modulation was investigated previously by Oldenburg, et al [4–7]. Briefly, the magnetomotive force (FMNP) on a single MNP can be written as the following:
| (1) |
where V is the volume of the MNP, χMNP is the magnetic susceptibility of MNP, χmedium is the magnetic susceptibility of medium, µ0 is the permeability constant (4π × 10−7) in vacuum, B is the external magnetic field, MMNP is the MNP magnetization, and Msat is the MNP saturation magnetization in the hysteresis curve. When the external magnetic field from our dual-coil is exerted on the MNPs (Fig. 1), the resulting force, F(t), can be written as the following:
| (2) |
where fM is the AC magnetic field modulation frequency of the coil, t is time, and ϕ is the phase lag between the power amplifier and MNP activation or displacement. It is possible that the magnetic moment of a MNP may tend to align with the external magnetic field (B) at low AC modulation frequencies (<kHz), and hence, experience a torsional movement. The term for this torsional movement has been omitted in Eq. (2) because the torsional movement is significantly smaller than the translational movement of the MNPs.
2.2 Microspheres preparation
Figure 2 shows the conceptual structure and transmission electron microscopy (TEM) images of the magnetic protein-shell, oil-core, microspheres used in this study. These particular contrast agents are being developed as blood-pool drug-delivery agents for targeting cardiovascular disease and angiogenesis in cancer [4,6–8]. In general, these magnetic microspheres consist of a hydrophobic core (e.g., vegetable oil or drug) and a hydrophilic shell (i.e., bovine serum albumin). These microspheres were designed to encapsulate iron oxide magnetic nanoparticles (size < 50 nm; 125 mg/mL; Sigma-Aldrich Corp. St. Louis, MO) and a fluorescence dye (Nile Red; Sigma-Aldrich Corp. St. Louis, MO) within the core for multimodal imaging [6,16–18]. The hydrophilic shell can be further functionalized with a specific antibody to target inflammatory biomarkers [17]. The average diameter of the microspheres measured by a Coulter Counter (Multisizer 4, Beckman Coulter, Inc., Brea, CA) was about 3 µm, which is suitable for injection into the circulatory system.
Fig. 2.

Structure of the magnetic protein-shell, oil-core, microspheres: A) Conceptual drawing of a magnetic microsphere with core-shell structure. B and C) Transmission electron microscopy (TEM) images of a single microsphere showing the presence of magnetic nanoparticles and aggregates within the oil-core. The region in the dashed-yellow box in (B) is magnified and shown in (C).
2.3 Phantom preparation
Two plastic tubes (O.D. ~670 µm, I.D. ~500 µm; Fig. 1(A); McMaster-Carr) were prepared as study phantoms. One was filled with magnetic microspheres (~106 MSs/mL) + PBS, and the other was filled with bare (non-magnetic) microspheres (~106 MSs/mL) + PBS. The bare non-magnetic microspheres were fabricated under the same conditions as the magnetic microspheres, but lacked the presence of MNPs in their cores.
For the experiment under flow conditions, a mixture of PBS and magnetic microspheres (~106 MSs/mL) was infused through a plastic tube with a syringe pump (Model# 724496, Harvard Apparatus, Holliston, MA) at a flow rate of 0.01 mL/min.
3. Results
3.1 Magnetomotive signal without flow
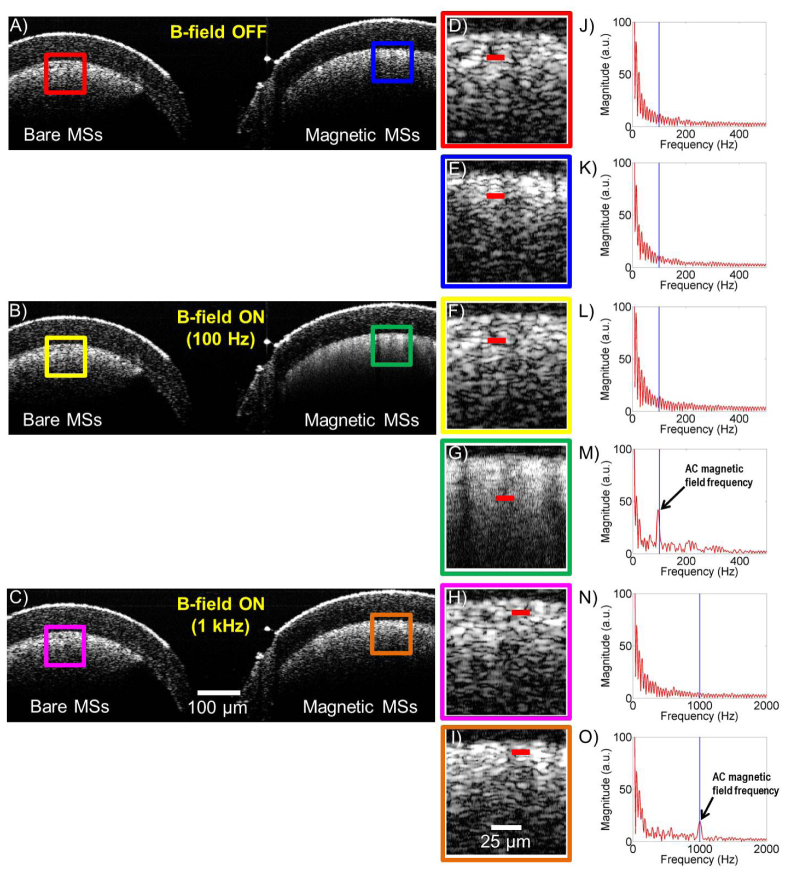
Figure 3 shows the experimental results with plastic tubes filled with bare microspheres (i.e., no MNPs in the core) as a control (Fig. 3(A)-3(C), left), and magnetic microspheres (Fig. 3(A)-3(C), right). The AC magnetic field frequency was set to 100 Hz (200 Gauss) and 1 kHz (120 Gauss), while 1 kHz and 30 kHz OCT scan rates were employed to acquire the cross-sectional OCT images (8000 A-lines/image), respectively. As expected, the plastic tube filled with magnetic microspheres (Fig. 3) responded strongly to the external AC magnetic field (100 Hz and 1 kHz). The MM response was verified by taking the Fourier transform of the structural OCT image at regions of interest. No other advanced processing techniques were used. The spectral analysis results (Fig. 3(M) and 3(O)) revealed that the frequency component corresponding to the external AC magnetic field frequency appeared when the AC magnetic field was ON. Additionally, there were higher-order harmonic signals (Fig. 3(M)) when the AC modulation was strong. Furthermore, the backscattering patterns from the magnetic microspheres when the B-field was ON or OFF were clearly different (Fig. 3(A)-3(C), right). When the magnetic field was OFF, the optical backscattering of the magnetic microspheres had a more uniform cloud-like pattern. However, when the magnetic field was turned ON, the backscattering pattern from the magnetic microspheres changed to a weaving pattern due to the external magnetic field from the two coils (100 Hz and 1 kHz). The current coil configuration has the capability to operate at different frequencies (up to 3 kHz). However, due to the impedance mismatch between the coils and the power supply, we operated at a magnetic field strength of 200 Gauss at 100 Hz and 120 Gauss at 1 kHz (Fig. 1(C)), which were more than sufficient to excite the magnetic microspheres.
Fig. 3.
Magnetomotive OCT images and signal with a dual-coil configuration: A, B, and C) OCT B-mode images of two plastic tubes (bare microspheres (MSs) as a control (left) and magnetic microspheres (right)). D, E, F, G, H, and I) Magnified regions from the corresponding colored boxes in (A, B, and C). Included videos ( Media 1 (778KB, AVI) and Media 2 (748.6KB, AVI) ) are the OCT images corresponding to (G and I). J, K, L, M, N, and O) Spectral analysis extracted from along the corresponding red lines in (D, E, F, G, H, and I). The spectral analysis results (M and O) revealed the frequency component identical to the external AC magnetic field frequency (100 Hz and 1 kHz), which appeared only when the AC magnetic field was ON.
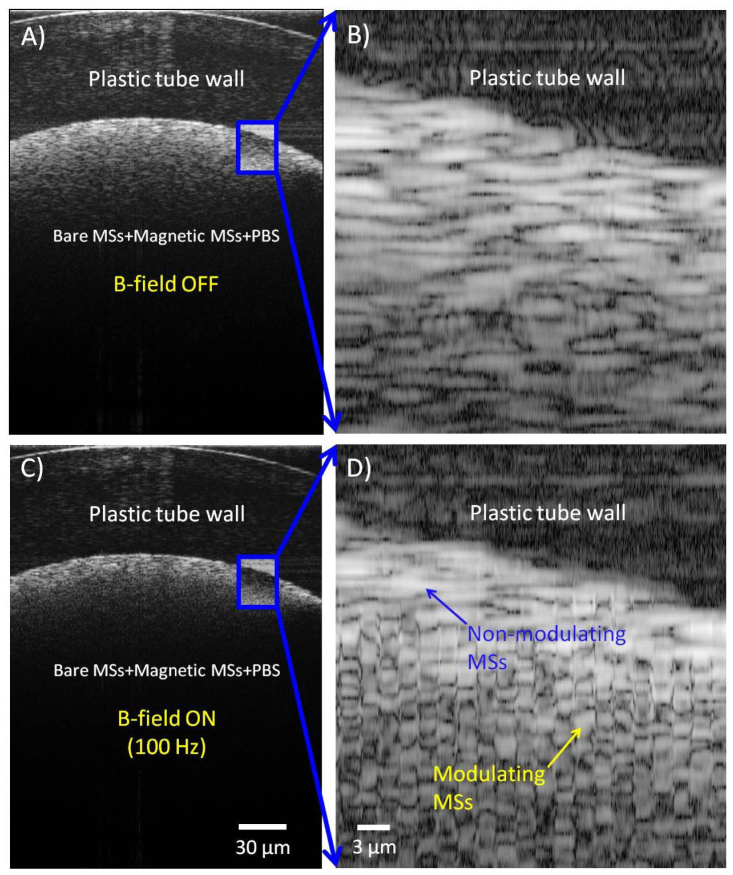
Figure 4 , additionally, shows the ability of this technique to localize magnetic microspheres in a mixed sample medium also containing non-magnetic microspheres (50%, ~106 MSs/mL) + magnetic microspheres (50%, ~106 MSs/mL) + PBS. A magnified region (Fig. 4(B) and 4(D); ~24 µm (W) × 248 µm (D)) shows evidence of both modulating and non-modulating microspheres. The external AC magnetic field frequency was 100 Hz (200 Gauss; 10 kHz OCT scan rate).
Fig. 4.
Detection of localized magnetic microspheres in a mixture ( Media 3 (540.7KB, AVI) ): A and C) B-mode OCT images of a plastic tube filled with a mixture of non-magnetic MSs + magnetic MSs + PBS. B and D) Magnified images from the blue boxes (A and C). Non-modulating microspheres appear as cloud-like scatterers, which modulating microspheres show distinct transients. The external AC magnetic field frequency was 100 Hz.
3.2 Magnetomotive signal with flow
Figure 5 is a representative MM-OCT image captured from a longitudinal section of tubing while a suspension of bare MSs + magnetic MSs + PBS was flowing through at 0.01 mL/min. The AC magnetic field frequencies were set to 200 Hz (200 Gauss) and 1 kHz (120 Gauss). The B-mode OCT image (8000 A-lines) was acquired at a 30 kHz scan rate. The OCT B-mode scan axis was oriented parallel to the longitudinal axis of plastic tube and the scan location was centered at the maximum diameter of the plastic tube. The direction of the OCT scan was from left-to-right, which matched the direction of the flow.
Fig. 5.
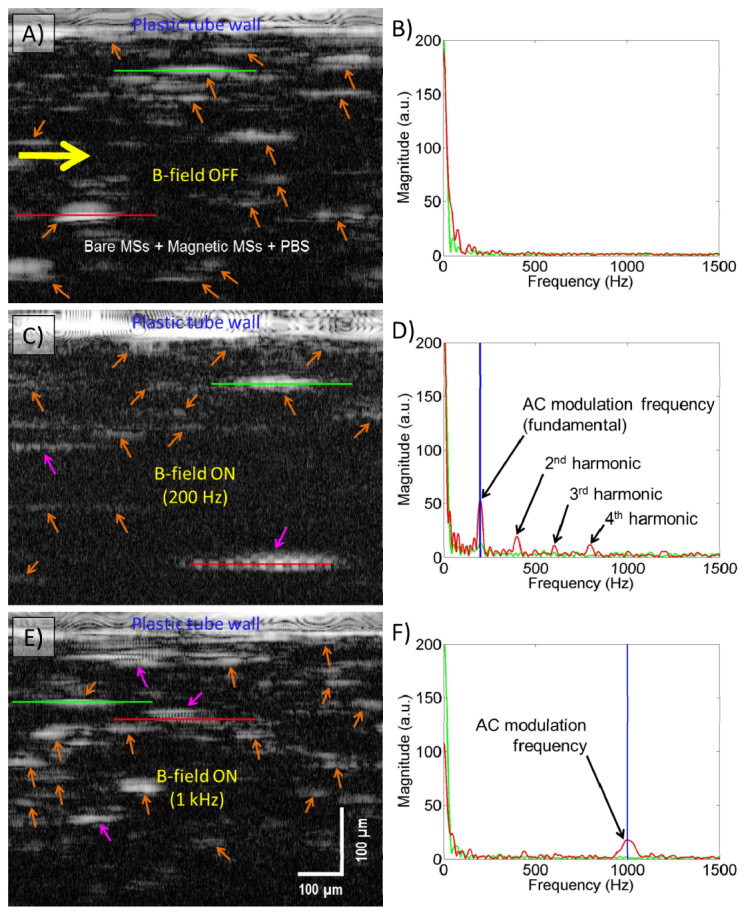
Representative MM-OCT images of flowing MSs captured under flow ( Media 4 (3.1MB, AVI) ): A) When the external magnetic field is OFF. B) Power spectrum of two MSs (red and green lines) in (A). C) When the external magnetic field of 200 Hz is ON. D) Power spectrum of two MSs (red and green lines) in (C). E) When the external magnetic field of 1 kHz is ON. F) Power spectrum of two MSs (red and green lines) in (E). The external AC magnetic field frequency (200 Hz and 1 kHz) is clearly visible in the frequency spectrum analysis (D and F; red line). The yellow and orange arrows in (A and B) indicate flow direction and magnetic MSs, respectively. The pink arrows in (C and E) indicate the modulating magnetic MSs.
When the external AC magnetic field excited the magnetic microspheres, the appearance of the OCT back-scattering from magnetic microspheres changed from a cloud-like appearance to a modulated column-wise pattern (Fig. 5(A), 5(C), and 5(E)), which is similar to the results from Fig. 4, captured without flow. The velocity (V) of the magnetic MSs under the flow rate of 0.01 mL/min was 0.85 mm/s. This volumetric flow velocity was computed by V = Q/A, where Q is the flow rate of our syringe pump, and A is the cross-sectional area of plastic tube (0.785 mm2).
3.3 Comparison between single-coil and dual-coil
The performance of this new dual-coil configuration was qualitatively compared with the conventional single-coil configuration used for MM-OCT imaging (Fig. 6 ). For this test, we prepared a sample consisting of glycerol that was mixed with MSs (106 MSs/mL). MM-OCT M-mode imaging (2 kHz scan rate) was performed in this test. The AC magnetic field frequency was set to 100 Hz (200 Gauss). The M-mode image from a single-coil configuration (Fig. 6(A)) showed a gradual elevation of magnetic microspheres towards the coil compared to the dual-coil configuration, which showed oscillations with zero-offset because the magnetic microspheres were excited alternatively by both the primary and secondary coils.
Fig. 6.
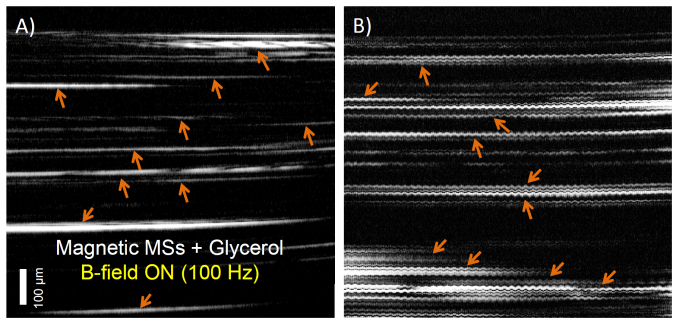
Comparison of M-mode MM-OCT imaging for A) single-coil configuration and B) dual-coil configuration. The orange arrows indicate MSs modulated by the external magnetic field. The MSs are drifting upward over time when using a single-coil (A), and oscillate sinusoidally with zero-offset when using the dual-coil configuration (B).
4. Discussion and conclusion
In this paper, we have developed and described a novel dual-coil MM-OCT configuration, and have demonstrated its potential for MM-OCT imaging in liquids and media that lack a significant viscoelastic restoring force. This dual-coil approach can overcome the inherent limitations (i.e., tissue restoring force dependency and slow acquisition speed) of conventional MM-OCT imaging, which has traditionally been based on a single coil design. This method enables high speed MM-OCT and magnetomotive optical coherence elastography imaging because MSs can be modulated with higher frequencies (i.e., ≥500 Hz) and only be limited by the mechanical response time of the sample (and not the naturally inherent elastic restoring force). This may also improve the SNR of the MM signal because low-frequency modulation (Fig. 3(M)) can be affected by spatial frequency components (e.g., heartbeat, pulsation of blood vessels, muscle twitching, etc.). A number of approaches, such as spatially oversampling the image or comparing the B-field OFF scan with the B-field ON scan, can be used to ensure that the spatial frequencies due to the sample structure do not overlap with the modulation frequency [4–8,18].
In general, an impedance mismatch can limit the maximum modulation frequency and the maximum magnetic field strength (B) at high frequencies (Fig. 1(C)). Our current dual-coil system can only modulate up to ~1 kHz due to the impedance mismatch between the coil and power amplifier. Additionally, the detection of the MM signal at high flow rates (>0.01 mL/min) is limited by the achievable magnetic field strength (B) and gradient (∇|B|). A high magnetic field strength in principle can also result in aggregation of the MSs. However, we did not observe this effect because the small force exerted by the external magnetic field on the MSs was not strong enough to induce aggregation. Ongoing work includes developing coil-amplifier systems with higher modulation frequencies and higher magnetic field strengths. In future designs, impedance mismatch will also be resolved by having a capacitor bank, which can be tuned for specific AC modulation frequencies.
The variation in MM response (i.e., displacement scale) may be useful for estimating the viscoelastic property of the medium such as blood and lymph. In other words, the variation in magnetic particle displacements under a fixed magnetic field strength is highly correlated to the viscoelastic property of the surrounding medium [12,13]. Furthermore, this dual-coil approach is not only applicable in MM-OCT imaging, but also magnetomotive ultrasound imaging [19,20].
In conclusion, this dual-coil MM-OCT approach will be useful in liquids and media with low viscosity that lack an effective elastic restoring force. Efforts are underway to incorporate this method with intravascular OCT imaging systems where these magnetic particles can be targeted to atherosclerotic plaques. The current coil configuration can be modified to enable in vivo intravascular MM-OCT imaging. This can be achieved by increasing the spacing between the primary and secondary coils (up to 8 cm for in vivo animal studies) and mounting these on a stationary stage. Theoretically, there is no limit to extend the distance between the two coils. The magnetomotive response of the targeted magnetic particles with this dual-coil MM-OCT system would be used for contrast enhancement for the early detection of atherosclerotic plaques, and algorithms are being developed to measure and correlate the nanometer- to micrometer-scale displacements (MM signal) induced by the external magnetic field to the viscoelastic properties of the biological samples.
Acknowledgments
This research was supported in part by grants from the National Institutes of Health ( NIBIB R01 EB009073) and a sponsored research agreement with Samsung, Inc. Dr. Jongsik Kim was funded by a Carle Foundation Hospital-Beckman Institute fellowship. Adeel Ahmad was funded at the University of Illinois by the NIH National Cancer Institute Alliance for Nanotechnology in Cancer ( Midwest Cancer Nanotechnology Training Center) Grant R25-CA154015A. Additional information can be found at http://biophotonics.illinois.edu.
References and links
- 1.Huang D., Swanson E. A., Lin C. P., Schuman J. S., Stinson W. G., Chang W., Hee M. R., Flotte T., Gregory K., Puliafito C. A., Fujimoto J. G., “Optical coherence tomography,” Science 254(5035), 1178–1181 (1991). 10.1126/science.1957169 [DOI] [PMC free article] [PubMed] [Google Scholar]
- 2.Swanson E. A., Huang D., Hee M. R., Fujimoto J. G., Lin C. P., Puliafito C. A., “High-speed optical coherence domain reflectometry,” Opt. Lett. 17(2), 151–153 (1992). 10.1364/OL.17.000151 [DOI] [PubMed] [Google Scholar]
- 3.Tearney G. J., Boppart S. A., Bouma B. E., Brezinski M. E., Weissman N. J., Southern J. F., Fujimoto J. G., “Scanning single-mode fiber optic catheter-endoscope for optical coherence tomography,” Opt. Lett. 21(7), 543–545 (1996). 10.1364/OL.21.000543 [DOI] [PubMed] [Google Scholar]
- 4.Oldenburg A. L., Toublan F. J. J., Suslick K. S., Wei A., Boppart S. A., “Magnetomotive contrast for in vivo optical coherence tomography,” Opt. Express 13(17), 6597–6614 (2005). 10.1364/OPEX.13.006597 [DOI] [PubMed] [Google Scholar]
- 5.Oldenburg A. L., Crecea V., Rinne S. A., Boppart S. A., “Phase-resolved magnetomotive OCT for imaging nanomolar concentrations of magnetic nanoparticles in tissues,” Opt. Express 16(15), 11525–11539 (2008). [PMC free article] [PubMed] [Google Scholar]
- 6.Boppart S. A., Oldenburg A. L., Xu C., Marks D. L., “Optical probes and techniques for molecular contrast enhancement in coherence imaging,” J. Biomed. Opt. 10(4), 041208 (2005). 10.1117/1.2008974 [DOI] [PubMed] [Google Scholar]
- 7.John R., Rezaeipoor R., Adie S. G., Chaney E. J., Oldenburg A. L., Marjanovic M., Haldar J. P., Sutton B. P., Boppart S. A., “In vivo magnetomotive optical molecular imaging using targeted magnetic nanoprobes,” Proc. Natl. Acad. Sci. U.S.A. 107(18), 8085–8090 (2010). 10.1073/pnas.0913679107 [DOI] [PMC free article] [PubMed] [Google Scholar]
- 8.Oldenburg A. L., Gunther J. R., Boppart S. A., “Imaging magnetically labeled cells with magnetomotive optical coherence tomography,” Opt. Lett. 30(7), 747–749 (2005). 10.1364/OL.30.000747 [DOI] [PubMed] [Google Scholar]
- 9.Kim J., Oh J., Milner T. E., Nelson J. S., “Hemoglobin contrast in magnetomotive optical Doppler tomography,” Opt. Lett. 31(6), 778–780 (2006). 10.1364/OL.31.000778 [DOI] [PubMed] [Google Scholar]
- 10.Kim J., Oh J., Milner T. E., Nelson J. S., “Imaging nanoparticle flow using magneto-motive optical Doppler tomography,” Nanotechnology 18(3), 035504 (2007). 10.1088/0957-4484/18/3/035504 [DOI] [PubMed] [Google Scholar]
- 11.John R., Chaney E. J., Boppart S. A., “Dynamics of magnetic nanoparticle-based contrast agents in tissues tracked using magnetomotive optical coherence tomography,” IEEE J. Sel. Top. Quantum Electron. 16(3), 691–697 (2010). 10.1109/JSTQE.2009.2029547 [DOI] [PMC free article] [PubMed] [Google Scholar]
- 12.Crecea V., Oldenburg A. L., Liang X., Ralston T. S., Boppart S. A., “Magnetomotive nanoparticle transducers for optical rheology of viscoelastic materials,” Opt. Express 17(25), 23114–23122 (2009). 10.1364/OE.17.023114 [DOI] [PMC free article] [PubMed] [Google Scholar]
- 13.Oldenburg A. L., Boppart S. A., “Resonant acoustic spectroscopy of soft tissues using embedded magnetomotive nanotransducers and optical coherence tomography,” Phys. Med. Biol. 55(4), 1189–1201 (2010). 10.1088/0031-9155/55/4/019 [DOI] [PMC free article] [PubMed] [Google Scholar]
- 14.Tearney G. J., Waxman S., Shishkov M., Vakoc B. J., Suter M. J., Freilich M. I., Desjardins A. E., Oh W. Y., Bartlett L. A., Rosenberg M., Bouma B. E., “Three-dimensional coronary artery microscopy by intracoronary optical frequency domain imaging,” JACC Cardiovasc. Imaging 1(6), 752–761 (2008). 10.1016/j.jcmg.2008.06.007 [DOI] [PMC free article] [PubMed] [Google Scholar]
- 15.Suter M. J., Nadkarni S. K., Weisz G., Tanaka A., Jaffer F. A., Bouma B. E., Tearney G. J., “Intravascular optical imaging technology for investigating the coronary artery,” JACC Cardiovasc. Imaging 4(9), 1022–1039 (2011). 10.1016/j.jcmg.2011.03.020 [DOI] [PMC free article] [PubMed] [Google Scholar]
- 16.Toublan F. J., Boppart S. A., Suslick K. S., “Tumor targeting by surface-modified protein microspheres,” J. Am. Chem. Soc. 128(11), 3472–3473 (2006). 10.1021/ja0544455 [DOI] [PubMed] [Google Scholar]
- 17.John R., Nguyen F. T., Kolbeck K. J., Chaney E. J., Marjanovic M., Suslick K. S., Boppart S. A., “Targeted multifunctional multimodal protein-shell microspheres as cancer imaging contrast agents,” Mol. Imaging Biol. 14(1), 17–24 (2012). 10.1007/s11307-011-0473-7 [DOI] [PMC free article] [PubMed] [Google Scholar]
- 18.Lee T. M., Oldenburg A. L., Sitafalwalla S., Marks D. L., Luo W., Toublan F. J., Suslick K. S., Boppart S. A., “Engineered microsphere contrast agents for optical coherence tomography,” Opt. Lett. 28(17), 1546–1548 (2003). 10.1364/OL.28.001546 [DOI] [PubMed] [Google Scholar]
- 19.Mehrmohammadi M., Qu M., Ma L. L., Romanovicz D. K., Johnston K. P., Sokolov K. V., Emelianov S. Y., “Pulsed magneto-motive ultrasound imaging to detect intracellular accumulation of magnetic nanoparticles,” Nanotechnology 22(41), 415105 (2011). 10.1088/0957-4484/22/41/415105 [DOI] [PMC free article] [PubMed] [Google Scholar]
- 20.Oh J., Feldman M. D., Kim J., Condit C., Emelianov S., Milner T. E., “Detection of magnetic nanoparticles in tissue using magneto-motive ultrasound,” Nanotechnology 17(16), 4183–4190 (2006). 10.1088/0957-4484/17/16/031 [DOI] [PubMed] [Google Scholar]


