Abstract
Three-dimensional optical tomographic imaging plays an important role in biomedical research and clinical applications. We introduce spectral tomographic imaging (STI) via spectral encoding of spatial frequency principle that not only has the capability for visualizing the three-dimensional object at sub-micron resolution but also providing spatially-resolved quantitative characterization of its structure with nanoscale accuracy for any volume of interest within the object. The theoretical basis and the proof-of-concept numerical simulations are presented to demonstrate the feasibility of spectral tomographic imaging.
OCIS codes: (170.6960) Tomography; (110.6955) Tomographic imaging; (110.1758) Computational imaging; (300.6300) Spectroscopy, Fourier transforms
1. Introduction
Following the seminal work by Wolf [1, 2], visualizing the internal structure of scattering objects such as biological samples has been the subject of intense research, especially in the past few decades. Within the ballistic optical regime this has led to the development of optical tomographic approaches for weakly scattering objects based on the Born approximation [3] that establishes a one-to-one correspondence between the far-field scattering amplitude and the three-dimensional (3D) Fourier transform of the scattering potential of the object. The theory has formed the basis of two widely adopted optical tomographic techniques: optical diffraction tomography (ODT) [1–4] (described by a suite of techniques categorized as tomographic diffractive microscopy (TDM) [5]) and optical coherence tomography (OCT) [6–10]. Experimental implementation of ODT has utilized spectral [11–14], illumination and collection angular diversities [15, 16] to reconstruct the 3D scattering potential of biological samples by increasing the frequency support in K-space. It has been shown that the biological samples can be reconstructed with an experimental lateral resolution that is inline with theoretically predicted values [17, 18]. The increase in frequency support in ODT has also been achieved by relaxing the Born approximation for highly diffractive samples, and applying a non-linear inversion algorithm to achieve 3D nanoscale resolution [19]. On the other hand, OCT accesses the axial (one-dimensional (1D)) direction in K-space resulting in optical sectioning along the axial direction [20]. Recently, novel computed-imaging based methods applied to OCT have achieved significantly improved axial resolution beyond the focal point [21–23].
Complementing the visualization of a 3D object is the quantitative characterization of the object structure via various spectroscopy approaches. These techniques focus on quantification of structure of the scattering object through spectroscopic analysis of elastically scattered light. For example, light-scattering spectroscopy (LSS) utilizes spectral or angular elastic scattering dependencies and Mie theory [24–29] to quantify the structure of a scattering object with sub-micron accuracy. LSS has also been combined with confocal imaging to develop confocal light absorption and scattering spectroscopic (CLASS) microscopy [30, 31], which uses confocal imaging to locate individual organelle whose structural characterization at the sub-micron scale is then performed using LSS. The direct analysis of the Fourier spectrum of a scattering object has been reported to achieve nanoscale sensitivity for two-dimensional (2D) periodic structure [32,33]. We have recently developed a novel approach, based on the spectral encoding of spatial frequency (SESF) principle, to characterize the internal structure of an object [34, 35] by constructing the axial spatial period profile of the object over the entire depth for each image point. Most notably, we showed, both numerically and experimentally, that this characterization is achieved with nanoscale sensitivity and accuracy.
Despite these significant advances, tomography-based simultaneous visualization of a 3D object and quantitative characterization of its 3D structure at nanoscale accuracy, for any volume of interest (VOI) within the object, remains a significant challenge. In this paper, we present a simulation-based proof-of-concept of a new tomographic approach, which we refer to as spectral tomographic imaging (STI). STI is an integrated approach that is able to simultaneously reconstruct the 3D tomographic object with sub-micron resolution, and quantify its axial structure with nanoscale accuracy in a spatially-resolved manner for each VOI within the object. This is realized through the application of SESF principle – which encodes spatial frequency through spectral diversity – at the Fourier plane, resulting in both reconstruction and structural characterization of the scattering object. The structural characterization is achieved by quantifying the axial spatial period profile of the VOI. We emphasize that the STI characterization of the internal structure is 3D spatially-resolved, that is, for any VOI within the object, STI can construct the axial spatial period profile with nanoscale accuracy. This is a critical improvement over our earlier work, where the structural characterization was performed for 2D imaging system over the entire imaging depth for a given image point of the object without any depth sectioning capability. This approach is applicable to any technique that has the ability to acquire the complex amplitude of the scattered waves, such as diffraction tomography, digital holographic microscopy and optical coherence tomography.
In the next section, utilizing the mathematical development in [3], the theoretical basis for this K-space construction is laid out in the context of STI for reflection-mode configuration, with the formalism developed for this configuration. Section 3 describes how STI can be used to perform 3D spatially-resolved structural characterization of the object. In section 4, we present numerical simulations to demonstrate the feasibility of STI for 3D object reconstruction, and validate the nanoscale accuracy of its structural characterization at different VOIs within the object. Finally, we present our conclusions in section 5.
2. STI-based object reconstruction: theoretical basis
Consider a scalar time-harmonic plane-wave parameterized by the wavenumber k,
| (1) |
incident on an object of interest that is centered at the origin of a Cartesian coordinate system. (We assume the conditions under which the scalar representation is valid are met [36]. We also ignore polarization effects.) The object is represented through its scattering potential F(r), given by the relation , where n(r) is the refractive index of the object. Assuming the plane-wave is incident at an oblique angle α0, the incident wavevector is given by k0 = k(sin α0 cos ϕ0x̂ + sin α0 sin ϕ0ŷ − cos α0ẑ) = k0xx̂+ k0yŷ − k0zẑ,, where k0x, k0y and k0z are the incident spatial frequencies and ϕ0 is the incident azimuthal angle. The unit vectors x̂, ŷ, and ẑ point in the positive x,y, and z directions. The negative sign of the z-component along with α0 ∈ [0, π/2) indicates that the wave is incident on the object located at the center of the coordinate system.
Reducing Eq. (1) to its phasor representation results in
| (2) |
where x,y and z are the cartesian components of a point r within the object. Under the Born approximation, reference [3] showed that the scattered wave at some point r′ is given by
| (3) |
with G(r′ − r;k) representing the Green’s function chosen to be
| (4) |
When we substitute Eq. (2) and Eq. (4) in Eq. (3) the scattered wave becomes
| (5) |
We realize the reflection-mode geometry that collects the back-scattered waves by imposing the condition z′ − z > 0 on Eq. (5). Under this condition, the Weyl’s representation [37]
| (6) |
of the Green’s function in Eq. (4), allows us to simplify Eq. (5) to
| (7) |
where Z is the axial depth range of the object and is the angular spectrum [36] of the complex wave back-scattered by the x−y cross-section of the object located at depth z. This angular spectrum is explicitly given by the Fourier transform relation,
| (8) |
We see from the above equation that the angular spectrum is centered around the lateral spatial frequency components k0x and k0y, which implies that the angle of incidence defined by the pair (ϕ0, α0) controls the centering of the angular spectrum. Returning to Eq. (7), we are interested in the integral within the inner parenthesis given by,
| (9) |
This integral, which represents the integration of the angular spectrum of the complex backscattered waves centered at (k0x, k0y) from all depths within the object, gives us access to the entire 3D structure of the scattering object. It depends on the spatial frequency vector triad (kx − k0x, ky − k0y, k0z + kz) that represents the spatial frequency vector,
| (10) |
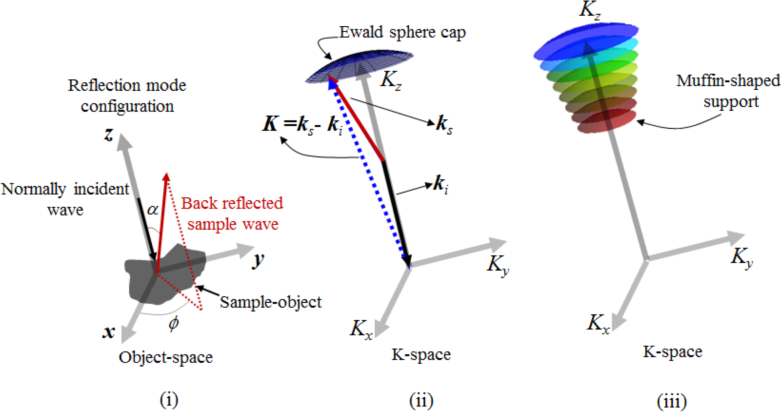
where ki and ks respectively are the incident and scattering wavevectors given by ki = k0 = k0xx̂ + k0yŷ − k0zẑ and ks = kxx̂ + kyŷ + kzẑ. On imposing the normal incidence restriction (see Fig. 1(i)) on the reflection geometry (this work focuses on reflection geometry with normal incidence, with all the following equations developed for this setup), and noting that under this restriction k0z = k, the spatial frequency vector triad reduces to (kx, ky, k + kz), and therefore, the integration of back-scattered waves F̃1(kx, ky, k + kz) ≡ F̃1(K) gives the 3D frequency point K in K-space shown in Fig. 1(ii). Furthermore, for a given wavelength λ (k = 2πn/λ;n is the refractive index of the object, and λ is the wavelength in free space), the expression k + kz, when expanded as
| (11) |
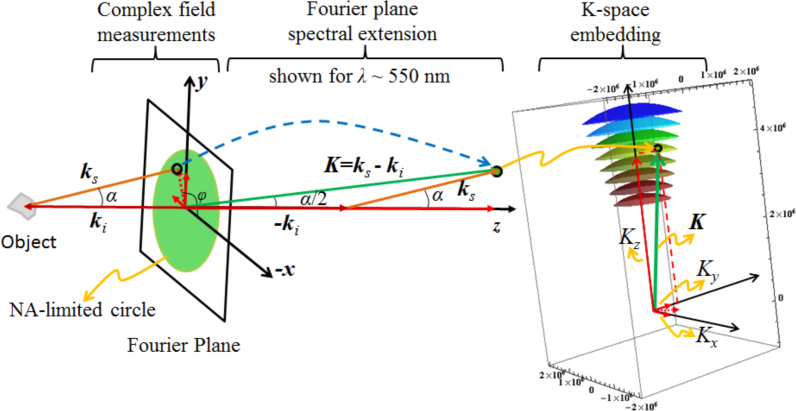
is a function of kx and ky. Since back-scattered waves are collected through an objective, the homogenous wave condition is met because the numerical aperture NA < 1 when the imaging medium is free-space. (Note, NA = sinα, with α being the back-scattering angle.) Therefore, the frequency vector K for wavelength λ, 0 < ϕ ≤ 2π and α ≤ arcsinNA forms the NA-restricted Ewald sphere cap as shown in Fig. 1(ii). By varying the wavelength (spectral diversity) we get a succession of Ewald sphere caps that define a muffin-shaped region of spatial frequency support in K-space for reflection geometry, which is illustrated in Fig. 1(iii). To construct the muffin-shaped support in K-space, for a given wavelength, we collect the integrated complex angular spectrum of the back-scattered waves on the two-dimensional (2D) Fourier plane and then spectrally extend it into 3D K-space as shown in Fig. 2. By repeating the procedure for the entire spectral range, we get F̃1(K), which is then used to obtain the 3D tomographic image of the object via the inverse Fourier transform
| (12) |
For a broadband light source with spectral bandwidth Δλ = λ2 − λ1 and an optical system with an objective with a certain numerical aperture (NA) to collect the back-scattered waves, the 3D volumetric resolution of the reconstructed object is given by
| (13) |
For the complex amplitude of spatial frequencies collected within the muffin-shaped support in K-space, assuming a uniform spectrum, the axial and lateral resolutions of the reconstructed object are inverse functions of the corresponding spatial-frequency ranges in K-space. The axial and lateral spatial frequency ranges respectively are and resulting in average axial and lateral resolutions of
| (14) |
and
| (15) |
respectively. Equation Eq. (13) relates to Eq. (14) and Eq. (15) through
| (16) |
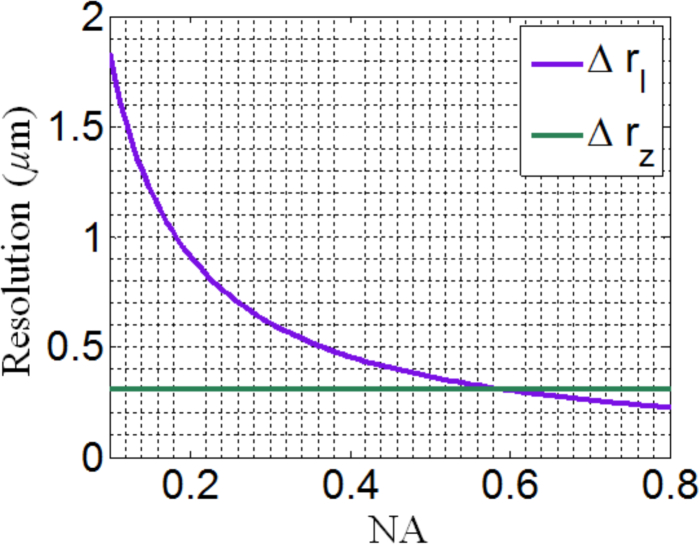
Figure 3 shows the dependence of lateral and axial resolution on the NA of the optical system. As can be seen, the axial resolution does not depend on the NA of the optical system, but only depends on the spectral bandwidth; while the lateral resolution is diffraction-limited, which is the same as conventional microscopy. For example, for a broadband light source with a spectral bandwidth of Δλ = 300nm (400nm–700nm) and NA = 0.5, the axial and lateral resolutions of the recontructed object with refractive index of 1.5 are 311nm and 367nm respectively. In comparison, for conventional microscopy with the same NA and wavelength, the axial resolution is 3.8μm with the same lateral resolution. This indicates that a high axial resolution can be achieved with a wide spectral bandwidth and low-to-moderate NA optics, which is similar to other low-coherence interferometric microscopy.
Fig. 1.
Construction of the muffin-shaped K-space support for STI-based object reconstruction under the reflection-mode configuration.
Fig. 2.
Fourier plane spectral extension.
Fig. 3.
Axial and lateral resolutions as a function of NA for λ = 550nm and n = 1.
The lateral and axial extent of the reconstructed object is impacted by Fourier plane and wavenumber sampling. A uniform sampling of the complex Fourier image, results in a uniform sampling along the lateral spatial frequencies Kx = kx and Ky = ky. To get uniform sampling in Kz we can sample λ as
| (17) |
Therefore, if we sample wavelength λ according to Eq. (17) we get a uniformly sampled 3D K-space. Alternatively, a uniformly-sampled 3D K-space can be achieved numerically by performing a one-dimensional (1D) interpolation along Kz for a given pair of (Kx, Ky) (corresponding to a single point location in the Fourier plane) and re-sampling according to Eq. (17). Assuming this axial re-sampling is done at Nz = Δλ/δλ points, with δλ being the spectral resolution of the spectral device, and noting that complex amplitude is obtained at the Fourier plane, the sampling interval along the axial direction is given by
| (18) |
Due to Fourier relation between K-space and object-space, this axial sampling interval controls the axial extent of the object. Specifically, the axial extent of the reconstructed object is given by π/ΔKz. Assuming the sampling in the lateral direction is N × N (pixels), the lateral sampling step-size is
| (19) |
The above equation implies that given the same lateral spatial frequency range, if N increases then the sampling step-size becomes finer resulting in the reconstruction of an object with a larger lateral extent. It is, however, important to note that the minimum possible sampling step-size is limited by the resolution on the Fourier plane, which is controlled by the point spread function at the back focal plane (Fourier plane) of the lens performing the Fourier transform within the optical system.
As an example, again assuming a broadband source (400 – 700nm), an objective with NA = 0.5, N = 1000, δλ = 1nm, and the object with an average refractive index n = 1.5, the linear axial and lateral sampling step-sizes respectively are 5.36 lp/mm and 3.75 lp/mm, resulting in our ability to reconstruct an object with axial and lateral extents of 93.3μm and 133.3μm respectively.
3. Spatially-resolved structural characterization of the scattering object
We have shown that obtaining the complex amplitude of 3D spatial frequencies at the Fourier plane allows tomographic reconstruction of the 3D object with resolution down to sub-micron level. Morphological and image processing methods can then be applied to obtain quantitative structural characterization of the object. The accuracy of such structural characterization, however, is limited by the resolution of the reconstructed 3D object, which is at best a few hundred nanometers. Consequently, the structure of the object at tens of nanometers is difficult to be accurately quantified. Our STI approach has the capability to quantitatively characterize the internal structure of the object with nanoscale accuracy. Note that the nanoscale accuracy describes the precision to quantify the structural characteristics for a given VOI of the image and should not be confused with nanoscale resolution. Furthermore, this structural characterization is ‘spatially-resolved’, indicating that the structural characterization of the object can be performed at any given VOI within the object. To the best of our knowledge this is the first tomographic imaging approach that couples 3D object reconstruction (with resolution down to sub-micron level) with spatially-resolved structural characterization (with nanoscale accuracy).
According to the Abbe’s theory of image formation [36], any complex, irregular object can be represented by a superposition of diffraction gratings with different orientations, frequencies, and amplitudes. In other words, the structural characteristics of any complex object can be rigorously described by a distribution of its spatial frequencies.
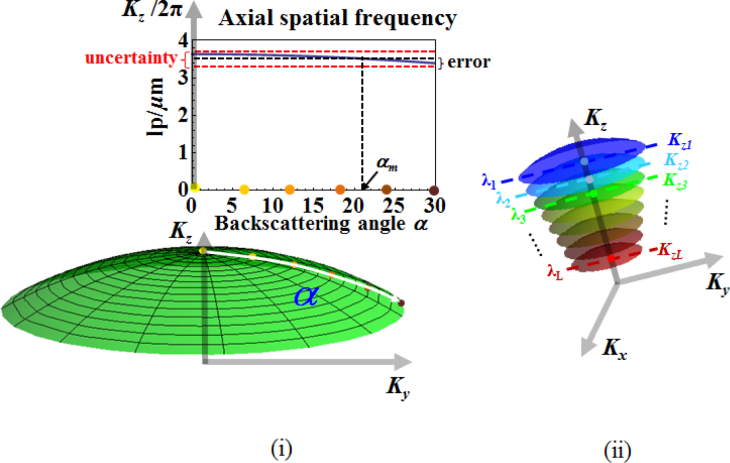
As discussed in Section 2, once the complex amplitude of the back-scattered waves obtained at the Fourier plane is embedded in K-space, the corresponding 3D tomographic reconstruction of the object is obtained by a 3D Fourier transform. With the information about both 3D K-space and reconstructed object space, we can perform structural characterization for a given VOI within the object with nanoscale accuracy using a simple approach utilizing the characteristics of the muffin-shaped spatial frequency support in K-space. As shown in Fig. 4(i), for reflection geometry and low-to-moderate NA, the axial spatial frequency – corresponding to the NA-restricted Ewald sphere cap defined by a single wavelength – is weakly dependent on the back-scattering angle. As a result, each axial spatial frequency Kz (axial spatial period Hz = 2π/Kz) can be encoded by a unique wavelength (corresponding to a single NA-restricted Ewald sphere cap) with a small uncertainty without precisely locating the corresponding backscattering angle, as illustrated in Fig. 4(ii). The maximum uncertainty, expressed here in terms of axial spatial period, is given by
| (20) |
Since the scattering angle is limited by 0 ≤α ≤ arcsinNA, we define the error due to uncertainty ΔHz for a single NA-restricted Ewald sphere cap to be , corresponding to the optimal back-scattering angle given by
| (21) |
as indicated in Fig. 4(i). Equation (20) shows that the accuracy defined by the maximum uncertainty in axial spatial period depends on the NA of the optical system. For example, with NA = 0.5, λ = 550nm, and n = 1, the maximum uncertainty is ΔHz = 20nm. A smaller NA results in a higher accuracy. On the other hand, the lateral spatial frequency (or spatial period) has a strong dependence on the scattering angle and requires the knowledge of all scattering angles for a given VOI. This information is not available in the reconstructed object space. It should be noted that, as shown in Fig. 5, there is an NA-dependent trade-off between the lateral resolution of the reconstructed object, and the accuracy of axial structural characterization, with the optimal choice being application specific.
Fig. 4.
Dependence of axial spatial frequencies on scattering angle, for NA = 0.5, λ = 550nm, and n = 1.
Fig. 5.
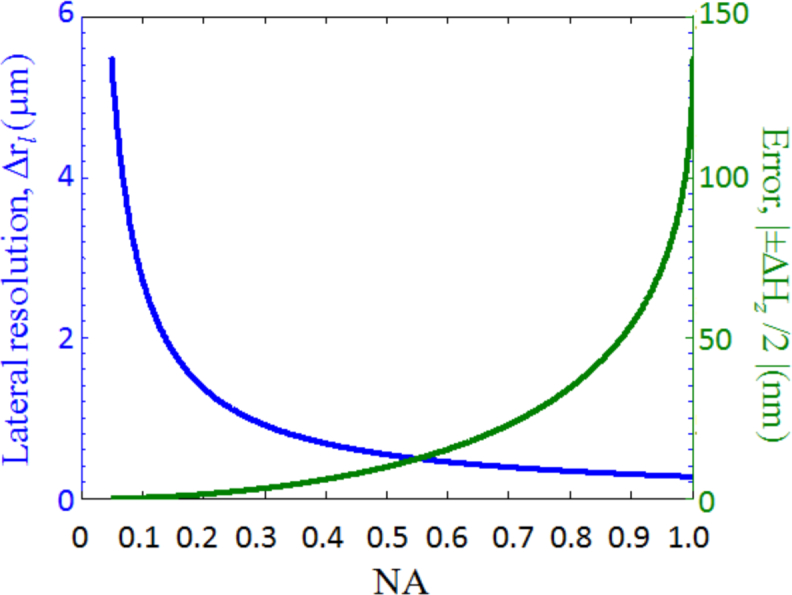
Lateral resolution of the reconstructed object and accuracy of axial spatial period characterization as a function of NA for n = 1.
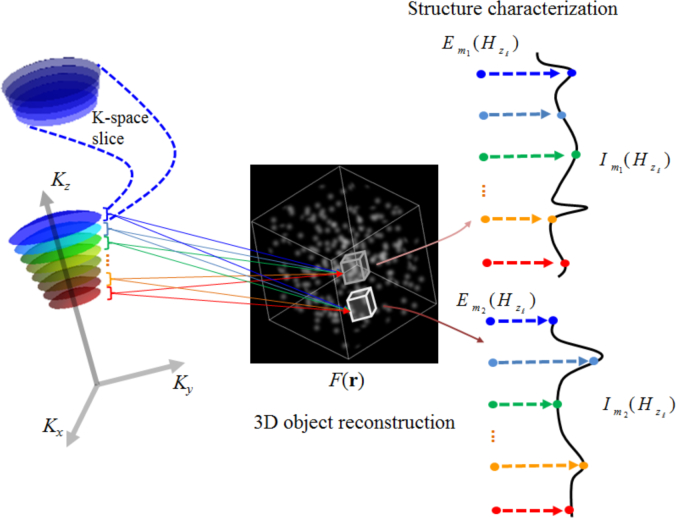
Given that wavelength is spatially invariant, by encoding each axial spatial frequency (or period) with one unique wavelength, the spectrally encoded axial spatial period can be carried from the K-space to the reconstructed object space without compromising accuracy. By mapping the energy contribution of the spectrally encoded axial spatial period to each VOI within the object, we are able to perform structural characterization of every VOI with nanoscale accuracy. Specifically, as shown in Fig. 6, we first decompose the muffin-shaped K-space support into slices along the z-axis of symmetry. This is achieved by decomposing the source spectrum into multiple spectral sub-bands. Noting that each wavelength defines a unique Ewald sphere cap, each K-space slice (shown in Fig. 6) is defined by the set of Ewald-sphere caps corresponding to wavelengths in those spectral sub-bands. Supposing that we have L spectral sub-bands, with each sub-band labelled by its mean wavelength λℓ, ℓ = 0,...,L − 1, the spatial period corresponding to λℓ for reflection configuration is expressed as
| (22) |
where αm is the optimal back-scattering angle defined in Eq. (21). We can now label the volume of the K-space slice corresponding to the ℓth spectral sub-band by the spatial period Hzℓ. We also divide the object space into multiple VOIs that are indexed by m with m = 0,...,M −1. To construct the axial spatial period profile for the mth VOI, we calculate the energy contribution of the ℓth spectral sub-band to the spatial period profile of the mth VOI at Hzℓ through
| (23) |
where Vm represents the integration volume of the mth VOI, and Fm,ℓ(r) is the inverse Fourier relation given by
| (24) |
with rm in the integrand indicating that the contribution of the ℓth spectral sub-band is considered only for the mth VOI. By computing the energy contribution Em(Hzℓ) for all the spatial periods Hzℓ, ℓ = 0,...,L − 1 (calculated using Eq. (22)), we obtain axial spatial period profile for the mth VOI to be
| (25) |
The denominator is the normalization term that ensures that the axial spatial period profiles from different VOIs can be compared.
Fig. 6.
Flow diagram showing the steps for reconstructing the 3D object, and structural characterization via the axial spatial period profile for a given VOI within the object.
It is important to note that the spectral sub-band range also impacts the accuracy of axial spatial period. If the spectral sub-band range is ΔΛ, the error in quantifying axial spatial period due to the presence of spectral sub-band is modified to , as indicated in Fig. 7. For example, if ΔΛ = 20nm, and λℓ = 550nm, then for n = 1.5 and NA = 0.5, the error ΔEz is ±(6.5 + 3.3)nm = ±9.8nm.
Fig. 7.

Error in quantifying axial spatial period for a spectral sub-band, for NA = 0.5 and n = 1.
The axial length of a VOI within the object is LΔrz, where Δrz is defined by Eq. (14). Continuing the above structural-characterization example, the axial length of VOI is 5μm. Note, in the extreme case of the smallest axial length of VOI (Δrz = 311nm), the corresponding error in determining axial spatial period is ±56.5nm. Therefore, there is a trade-off between the axial length of VOI and the accuracy of the axial spatial period, with the optimal choice again being application specific. On the other hand, the smallest lateral size of the VOI is intrinsically defined by the diffraction-limited lateral resolution of the reconstructed 3D object as shown in Eq. (15).
4. Results
To demonstrate the feasibility of STI for 3D tomographic imaging and spatially-resolved structural characterization, we present results from two numerical simulations. For these simulations we consider collimated light from a broadband light source normally incident on the object, with the resulting back-scattered waves collected by an objective (NA = 0.5), and their complex amplitude obtained at the Fourier plane with N = 200.
4.1. Simulation 1: Reconstruction of 3D object with random scatterers, and its spatially-resolved structural characterization
We begin by considering a scattering object, 625μm3 in volume, with average refractive index of 1.59 shown in Fig. 8(i), which is illuminated by a broadband light source with spectral bandwidth of 300nm (400–700nm) and spectral resolution of 1 nm. It consists of random scatterers with one octant having higher scatterer density than the rest of the object. The choice of this model is motivated by the fact that nanosphere aggregates are one of the most commonly used cell and tissue models to mimic scattering in both simulation and experiment. Furthermore, changes in scatterer density are one of the most common structural changes in biological cells and tissue, such as cell proliferation and carcinogenesis.
Fig. 8.
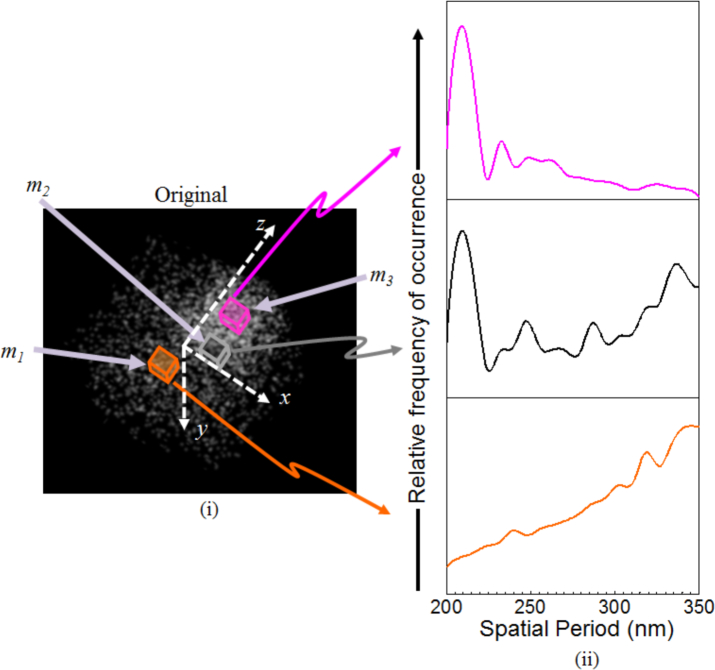
The simulated 3D object consisting of a mixture of high and low scatterer density. Three VOIs have been indicated along with their corresponding spatial period profiles.
We characterize the structure of this object by its axial spatial period profile that is directly dependent on the inter-scatterer distance. Specifically, any scatterer within the object is surrounded by other scatterers at different distance from it. For any chosen direction from the chosen scatterer, we define the inter-scatterer distance in that direction as the distance between the scatterer under consideration and the first scatterer in that direction. This is done for all directions within the 3D object for the chosen scatterer, and then repeated for all scatterers. The set of inter-scatterer distances thus generated is used to construct a histogram to show the distribution of the inter-scatterer distance as the spatial period profile. Figure 8(ii) shows spatial period profiles of three VOIs highlighted within the object. The VOI m1, shaded orange, is located in the less-dense region. As expected, its spatial period profile skews towards larger values. The VOI m2 shown in pink is located within the more-dense region. The corresponding spatial period profile is concentrated near smaller values. Finally, VOI m3, shown in black, straddles the two regions and its corresponding profile shows that both more-dense and less-dense regions contribute to it.
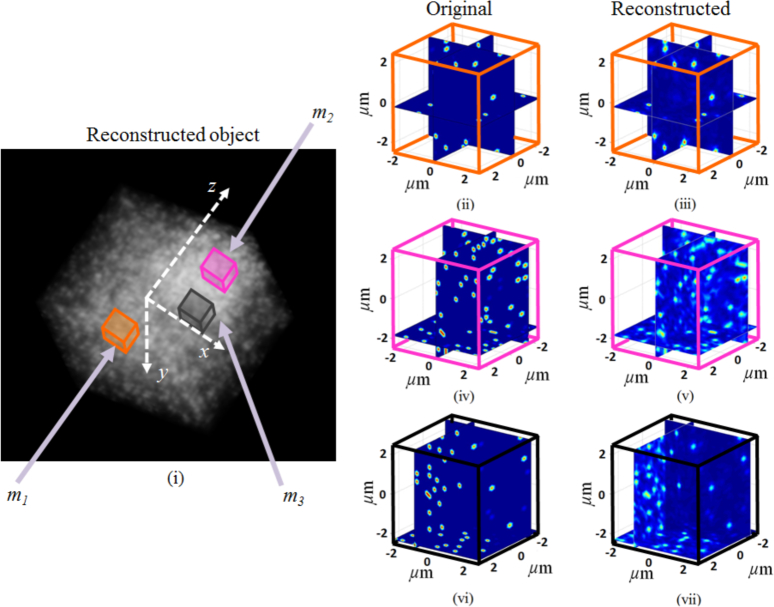
STI-based 3D tomographic reconstruction is performed by spectrally extending the NA-restricted back-scattered angular spectrum collected at the Fourier plane to the K-space, and re-sampling along the Kz direction (Nz = 300). The Fourier-transform relation in Eq. (12) then gives us the reconstructed object shown in Fig. 9. The volumetric visualization of the reconstructed object is shown in Fig. 9(i). To better visualize the details of the reconstruction we also show the cross-sectional view of the three VOIs described above. Figure 9(ii) shows the m1 VOI from the less-dense region of the object and Fig. 9(iii) shows its STI-based reconstruction. They have been color-coded to be consistent with their location-label within the volumetric visualization. Figure 9(iv) shows the m2 VOI within the more-dense region of the object with its corresponding reconstruction shown in Fig. 9(v). Finally, the cross-sectional visualization of the m3 VOI and its reconstruction are shown in Fig. 9(vi) and Fig. 9(vii) respectively. The theoretical axial and lateral resolutions of this reconstruction are 294nm and 346nm respectively. Figure 10 shows an example 1D cross-section profile, along with its reconstruction, within the 3D object for the scatterer size of approximately 240nm. This example demonstrates the ability of STI to perform high-fidelity reconstruction of 3D objects with sub-micron axial and lateral resolutions. We note, however, that the absolute value of each reconstructed voxel does not correspond to the exact scattering potential due to the practical limitation of accessing lower spatial-frequencies, which requires a different configuration for collecting the scattered waves.
Fig. 9.
(i) Volumetric visualization of the STI-based reconstruction of the object. (ii)–(vii) The cross-sectional view of the reconstructions of the three VOIs identified in (i) and in Fig. 8.
Fig. 10.
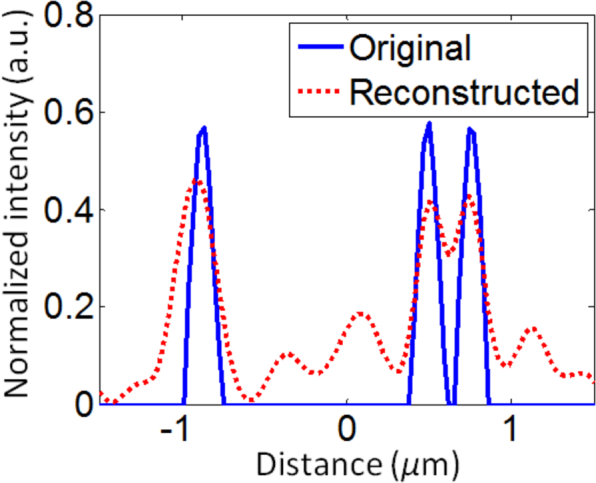
Original and reconstructed 1D cross-section profile from within the 3D object.
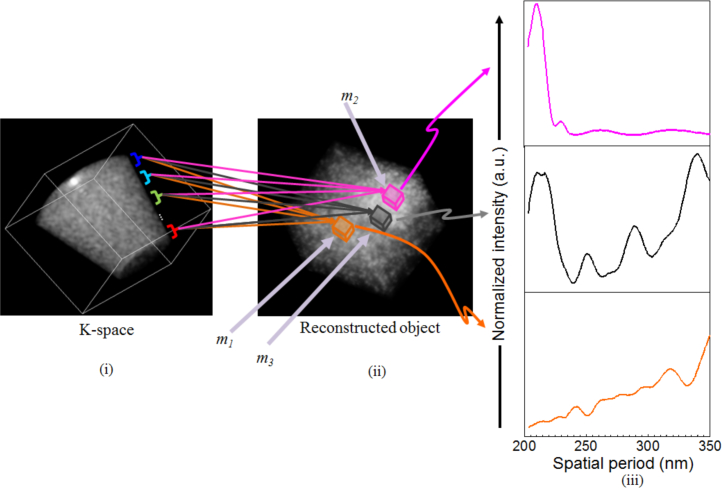
Having demonstrated the capability of STI to perform 3D object reconstruction, we now use STI to characterize the axial structure within the three VOIs: m1, m2, and m3. Following spatially-resolved structural characterization outlined in section 3, we divide the muffin-shaped K-space support along the z-axis into L = 15 spectral sub-bands. (The K-space z-axis is the axis of symmetry for the reflection-mode configuration.) For each of the three VOIs mi, i = 1, 2, 3 we compute the contributions Fmi,ℓ(r), ℓ = 0,...,L−1 and their corresponding energy Emi(λℓ). Emi (λℓ) allows us to compute the contribution of spatial period Hz(λℓ) to the axial spatial period profile of VOI mi of the object given by Eq. (25). The result for structural characterization is presented in Fig. 11. Comparing Figs. 8(ii) and 11(iii) we see that the reconstructed axial spatial period profiles closely resemble the actual spatial period profiles of the three VOIs of the 3D object. To better quantify the accuracy of structural characterization, Table 1 lists the peak locations of the actual spatial period profiles (as these peak locations are distinct and dominant features of the spatial period profiles) of the three VOIs within the object and the corresponding reconstructed axial spatial period profiles. The result shows that the largest discrepancy between the original and reconstructed spatial period peak is within 7nm. In fact, for most peak locations, the discrepancy is ≤ 5nm, well within the maximum theoretical error of ΔEz = ±11nm for NA = 0.5, n = 1.59, and λ = 700nm.
Fig. 11.
Reconstructed axial spatial period profiles of the three VOIs.
Table 1.
Comparison of peak locations from the actual and reconstructed spatial period profiles of the three VOIs.
| Sub-region | Actual spatial period of the object (in nm) | Reconstructed axial spatial period (in nm) |
|---|---|---|
| m 1 | 240, 319, 345 | 247, 318, 350 |
| m 2 | 209, 232 | 212, 230 |
| m 3 | 209, 247, 288, 337 | 214, 252, 288, 339 |
4.2. Simulation 2: Reconstruction of 3D object with periodic structure, and its spatially-resolved structural characterization
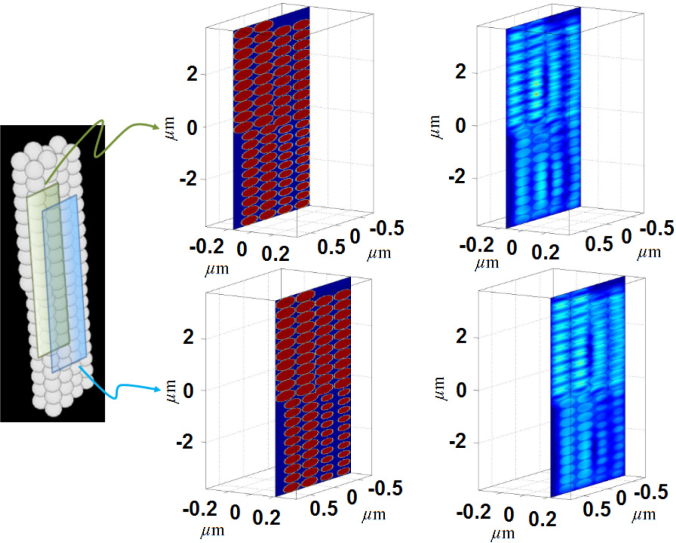
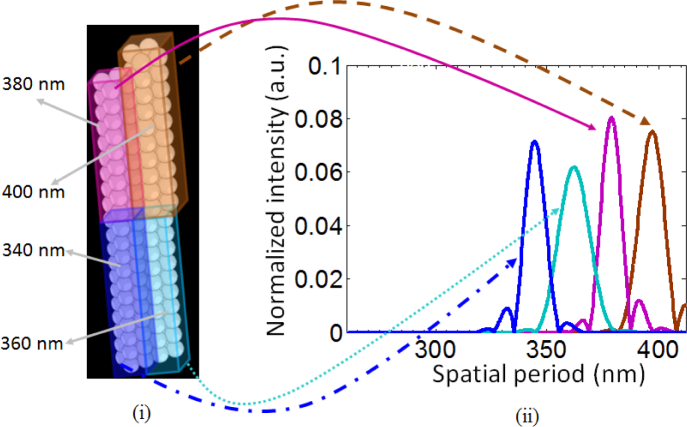
In the previous example we considered a 3D object with random scatterers, and demonstrated the ability of STI to capture the distinct and dominant structural features of VOIs within this object. When the scattering object has a periodic or quasi-periodic structure, STI can estimate the size of the features generating the periodicity. To illustrate this idea, we consider a 3D object shown in Fig. 12 that consists of nanospheres (n = 1.59) of four different sizes: 340nm, 360nm, 380nm, and 400nm. This object is illuminated by a light source with spectral bandwidth of 350nm (450nm − 800nm) and spectral resolution of 1 nm. The specifications for collecting the back-scattered light are the same as the above example. Figure 12 shows two cross-sections of the reconstructed 3D object. The average theoretical axial and lateral resolutions of reconstruction are 323nm and 393nm respectively. Although the given lateral resolution results in slight blurring along the lateral direction, the STI approach shows good reconstruction fidelity. It should be noted that the nanoscale difference in the sizes of the nanospheres is hard to discern visually, but the STI-based spatially-resolved structural characterization distinctly characterizes the nanosphere sizes due to the periodicity in the nanosphere arrangement, as demonstrated in Fig. 13. Figure 13(i) shows the stacking of the nanospheres and the color-coded cuboidal VOIs overlaid on the object. The VOI dimensions (lateral×lateral×axial) are approximately 1μm × 1.5μm × 9μm. Figure 13(ii) shows the reconstructed axial spatial period profiles of these four VOIs. The profiles have distinct peaks at spatial periods corresponding to the size of the objects. Specifically, the peak locations are at 345nm, 363nm, 378nm, and 397nm, resulting in a maximum discrepancy of 5nm, which is well within the maximum theoretical error of ΔEz = ±12nm for NA = 0.5, n = 1.59, L = 20, and λ = 800nm.
Fig. 12.
Cross-section view of two sections of the reconstructed 3D object consisting of nanospheres of four different sizes.
Fig. 13.
(i) 3D object consisting of nanospheres of four different sizes. The color-coded VOIs indicate the four nanosphere stacks. (ii) The corresponding STI-based axial spatial period profiles shown with the same color code.
4.3. Effect of phase noise
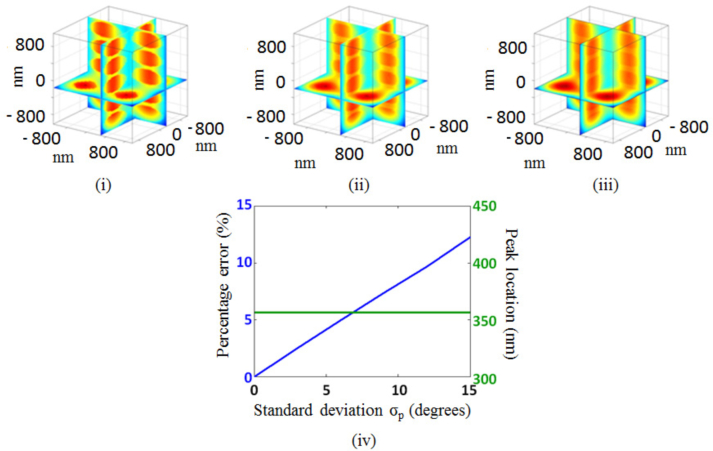
Having laid out the physical basis of the STI approach and demonstrated its feasibility through simulations, we now consider the effect of errors in phase measurements, which is important when considering experimental implementation. As noted in the introduction, the STI approach can be implemented using any technique with the ability to collect the complex amplitude of the back-scattered waves at the Fourier plane. Such an ability requires careful and precise measurement of the phase of the back-scattered waves. In this context, we evaluate the performance of the STI approach by numerically simulating the effect of phase noise on the resolution of the reconstructed 3D object and the accuracy of its structural characterization. Random phase noise is generated by assuming a uniform distribution with a mean of zero degree and a standard deviation of σp degrees around the mean. This random phase error is then numerically added to the simulated complex amplitude of the back-scattered waves obtained at the Fourier plane. Utilizing basic Fourier theory, we expect that random phase shifts (due to phase errors) in 3D K-space will cause random 3D spatial-shifts in the reconstructed object space, resulting in smearing (or resolution loss) of the reconstructed object. As shown in Fig. 14, this is what we observe. The figure shows cross-sectional visualizations of the reconstruction of a VOI (within the object presented in Section 4.2) consisting of nanospheres of size 360nm whose complex measurements at the Fourier plane have been affected by phase noise. As visualized in Figs. 14(i) through 14(iii), the resolution loss increases with increasing σp. To quantify this loss, Fig. 14(iv) shows the image reconstruction error due to the presence of phase noise relative to the ideal case when the reconstruction is performed with the absence of phase noise. We see that the error increases proportionally to the increasing standard deviation of the uniformly distributed phase noise, indicating that the resolution of the image reconstruction of the 3D object is affected by phase noise and an accurate phase measurement at the Fourier plane is required. Most interestingly though the high accuracy (or precision) of the spatially-resolved structural characterization is robust to phase noise. This robustness, we think, follows from Eq. (23), which shows that the spatially-resolved structural characterization results from the mapping of the energy (and not the complex amplitude) from each K-space slice to the VOI under investigation. Despite the presence of the phase noise, the bulk of this energy – especially the energy corresponding to dominant structural features within the VOI – is retained, suggesting that the structural characterization has robustness to phase noise. This is illustrated in Fig. 14(iv), where the accuracy of structural characterization of the VOI (quantified by the peak position of the dominant structure) is retained despite the large increase in phase error.
Fig. 14.
VOI: nanospheres of size 360nm. (i) Reconstructed VOI with σp = 0.5°. (ii) Reconstructed VOI with σp = 1.5°. (iii) Reconstructed VOI with σp = 3°. (iv) Reconstruction error (relative to the no noise case) and peak position of the dominant structure as function of σp.
5. Conclusion
We have presented the theoretical basis of STI, and demonstrated via numerical simulation that given the complex amplitude of 3D spatial frequencies of the back-scattered waves collected at the Fourier plane, we can obtain 3D tomographic reconstruction of the object with resolution down to sub-micron level and simultaneously perform 3D spatially-resolved structural characterization with nanoscale accuracy for any given VOI within the object. Our numerical simulations confirm the technical performance of STI, especially the nanoscale accuracy of structural characterization of 3D complex objects, suggesting its potential application in biological systems. Furthermore, preliminary analysis of the effect of phase noise via numerical simulation suggests that STI-based structural characterization is robust to phase noise. STI requires the collection of complex amplitude of multi-wavelength backscattering waves at the Fourier plane, which can be obtained using techniques such as the phase-shifting method in the settings of wavelength-scanning digital holography and frequency-domain interferometry. The STI approach can also benefit many other imaging techniques, such as optical coherence tomography, digital holographic microscopy and diffraction tomography.
Acknowledgments
This project was supported by grant from the National Cancer Institute ( R21CA164433) from the National Institutes of Health. The content is solely the responsibility of the authors and does not necessarily represent the official views of the National Institutes of Health.
References and links
- 1.Wolf E., “Three-dimensional structure determination of semi-transparent objects from holographic data,” Opt. Comm. 1, 153–156 (1969). 10.1016/0030-4018(69)90052-2 [DOI] [Google Scholar]
- 2.Wolf E., “Determination of the amplitude and the phase of scattered fields of holography,” J. Opt. Soc. Am. 60, 18–20 (1970). 10.1364/JOSA.60.000018 [DOI] [Google Scholar]
- 3.Born M., Wolf E., Principles of Optics (Cambridge University Press, Cambridge, 1999). [Google Scholar]
- 4.Sung Y., Choi W., Fang-Yen C., Badizadegan K., Dasari R. R., Feld M. S., “Optical diffraction tomography for high resolution live cell imaging,” Opt. Express 17, 266–277 (2009). 10.1364/OE.17.000266 [DOI] [PMC free article] [PubMed] [Google Scholar]
- 5.Haeberlé O., Belkebir K., Giovaninni H., Sentenac A., “Tomographic diffractive microscopy: basics, techniques and perspectives,” J. Mod. Opt. 57, 686–699 (2010). 10.1080/09500340.2010.493622 [DOI] [Google Scholar]
- 6.Fercher A. F., “Ophthalmic interferometry,” in Optics in medicine, biology and environment, von Bally G., Khanna S, eds. (Elsevier, Amsterdam, 1999), 221–235 [Google Scholar]
- 7.Hitzenberger C. K., “Optical measurement of the axial eye length by laser Doppler interferometry,” Invest. Ophthalmol. Vis. Sci. 32, 616–624 (1991). [PubMed] [Google Scholar]
- 8.Huang D., Swanson E. A., Lin C. P., Schuman J. S., Stinson W. G., Chang W., Hee M. R., Flotire T., Gregory K., Puliafito C. A., Fujimoto J. G., “Optical coherence tomography,” Science 254, 1178–1181 (1991). 10.1126/science.1957169 [DOI] [PMC free article] [PubMed] [Google Scholar]
- 9.Bouma B. E., Tearney G. J., The handbook of optical coherence tomography (Marcel Dekker, New York, 2002). [Google Scholar]
- 10.Izatt J. A., Hee M. R., Owen G. M., Swanson E. A., Fujimoto J. G., “Optical coherence microscopy in scattering media,” Opt. Lett. 19, 590–592 (1994). 10.1364/OL.19.000590 [DOI] [PubMed] [Google Scholar]
- 11.Montfort F., Colomb T., Charrière F., Kühn J., Marquet P., Cuche E., Herminjard S., Depeursinge C., “Submicrometer optical tomography by multiple-back-scattered digital holographic microscopy,” Appl. Opt. 45, 8209–8217 (2006). 10.1364/AO.45.008209 [DOI] [PubMed] [Google Scholar]
- 12.Kim M., “Tomographic three-dimensional imaging of a biological specimen using wavelength-scanning digital interference holography,” Opt. Express 7, 305–310 (2000). 10.1364/OE.7.000305 [DOI] [PubMed] [Google Scholar]
- 13.Yu L., Kim M., “Wavelength-scanning digital interference holography for tomographic three-dimensional imaging by use of the angular spectrum method,” Opt. Lett. 30, 2092–2094 (2005). 10.1364/OL.30.002092 [DOI] [PubMed] [Google Scholar]
- 14.Kühn J., Montfort F., Colomb T., Rappaz B., Moratal C., Pavillon N., Marquet P., Depeursinge C., “Submicrometer tomography of cells by multiple-wavelength digital holographic microscopy in reflection,” Opt. Lett. 34, 653–655 (2009). 10.1364/OL.34.000653 [DOI] [PubMed] [Google Scholar]
- 15.Dändliker R., Weiss K., “Reconstruction of the three-dimensional refractive index from scattered waves,” Opt. Comm. 1, 323–328 (1970). 10.1016/0030-4018(70)90032-5 [DOI] [Google Scholar]
- 16.Lauer V., “New approach to optical diffraction tomography yielding a vector equation of diffraction tomography and a novel tomographic microscope,” J. Microsc. 205, 165–176 (2002). 10.1046/j.0022-2720.2001.00980.x [DOI] [PubMed] [Google Scholar]
- 17.Debailleul M., Georges V., Simon B., Morin R., Haeberlé O., “High-resolution three-dimensional tomographic diffractive microscopy of transparent inorganic and biological samples,” Opt. Lett. 34, 79–81 (2009). 10.1364/OL.34.000079 [DOI] [PubMed] [Google Scholar]
- 18.Simon B., Debailleul M., Beghin A., Tourneur Y., Haeberlé O., “High-resolution tomographic diffractive microscopy of biological samples,” J. Biophoton. 3, 462–467 (2010). 10.1002/jbio.200900094 [DOI] [PubMed] [Google Scholar]
- 19.Girard J., Maire G., Giovannini H., Talneau A., Belkebir K., Chaumet P. C., Sentenac A., “Nanometric resolution using far-field optical tomographic microscopy in the multiple scattering regime,” Phys. Rev. A 82, 061801(R) (2010). 10.1103/PhysRevA.82.061801 [DOI] [Google Scholar]
- 20.Fercher A. F., Hitzenberger C. K., Kamp G., El-Zaiat S. Y., “Measurement of intraocular distances by backscattering spectral interferometry” Opt. Comm. 117, 43–48 (1995). 10.1016/0030-4018(95)00119-S [DOI] [Google Scholar]
- 21.Ralston T. S., Marks D. L., Carney P. S., Boppart S. A., “Interferometric synthetic aperture microscopy,” Nat. Phys. 3, 129–134 (2007). 10.1038/nphys514 [DOI] [PMC free article] [PubMed] [Google Scholar]
- 22.Ralston T., Marks D., Carney P., Boppart S., “Inverse scattering for optical coherence tomography,” J. Opt. Soc. Am. A 23, 1027–1037 (2006). 10.1364/JOSAA.23.001027 [DOI] [PubMed] [Google Scholar]
- 23.Marks D., Ralston T., Boppart S., Carney P., “Inverse scattering for frequency-scanned full-field optical coherence tomography,” J. Opt. Soc. Am. A 24, 1034–1041 (2007). 10.1364/JOSAA.24.001034 [DOI] [PubMed] [Google Scholar]
- 24.Backman V., Wallace M. B., Perelman L. T., Arendt J. T., Gurjar R., Mller M. G., Zhang Q., Zonios G., Kline E., McGilligan J. A., Shapshay S., Valdez T., Badizadegan K., Crawford J. M., Fitzmaurice M., Kabani S., Levin H. S., Seiler M., Dasari R. R., Itzkan I., Van Dam J., Feld M. S., “Detection of preinvasive cancer cells,” Nature 406, 35–36 (2000). 10.1038/35017638 [DOI] [PubMed] [Google Scholar]
- 25.Liu Y., Li X., Kim Y. L., Backman V., “Elastic backscattering spectroscopic microscopy,” Opt. Lett. 30, 2445–2447 (2005). 10.1364/OL.30.002445 [DOI] [PubMed] [Google Scholar]
- 26.Perelman L. T., Backman V., Wallace M., Zonios G., Manoharan R., Nusrat A., Shields S., Seiler M., Lima C., Hamano T., Itzkan I., Van Dam J., Crawford J. M., Feld M. S., “Observation of periodic fine struct ure in reflectance from biological tissue: A new technique for measuring nuclear size distribution,” Phys. Rev. Lett. 80, 627–630 (1998). 10.1103/PhysRevLett.80.627 [DOI] [Google Scholar]
- 27.Chalut K. J., Ostrander J. H., Giacomelli M. G., Wax A., “Light scattering measurements of subcellular structure provide noninvasive early detection of chemotherapy-induced apoptosis,” Cancer Res. 69, 1199–1204 (2009). 10.1158/0008-5472.CAN-08-3079 [DOI] [PMC free article] [PubMed] [Google Scholar]
- 28.Wax A., Yang C. H., Izatt J. A., “Fourier-domain low-coherence interferometry for light-scattering spectroscopy,” Opt. Lett. 28, 1230–1232 (2003). 10.1364/OL.28.001230 [DOI] [PubMed] [Google Scholar]
- 29.Gutzler T., Hillman T. R., Alexandrov S. A., Sampson D. D., “Three-dimensional depth-resolved and extended-resolution micro-particle characterization by holographic light scattering spectroscopy,” Opt. Express 18, 25116–25126 (2010). 10.1364/OE.18.025116 [DOI] [PubMed] [Google Scholar]
- 30.Fang H., Qiu L., Vitkin E., Zaman M., Andersson C., Salahuddin S., Kimerer L., Cipolloni P., Modell M., Turner B., Keates S., Bigio I., Itzkan I., Freedman S., Bansil R., Hanlon E., Perelman L., “Confocal light absorption and scattering spectroscopic microscopy,” Appl. Opt. 46, 1760–1769 (2007). 10.1364/AO.46.001760 [DOI] [PubMed] [Google Scholar]
- 31.Itzkan I., Qiu L., Fang H., Zaman M. M., Vitkin E., Ghiran I. C., Salahuddin S., Modell M., Andersson C., Kimerer L. M., Cipolloni P. B., Lim K. H., Freedman S. D., Bigio I., Sachs B. P., Hanlon E. B., Perelman L. T., “Confocal light absorption and scattering spectroscopic microscopy monitors organelles in live cells with no exogenous labels,” Proc. Natl. Acad. Sci. 10417255–17260 (2007). 10.1073/pnas.0708669104 [DOI] [PMC free article] [PubMed] [Google Scholar]
- 32.Boustany N. N., Kuo S. C., Thakor N. V., “Optical scatter imaging: subcellular morphometry in situ with Fourier filtering,” Opt. Lett. 26, 1063–1065 (2001). 10.1364/OL.26.001063 [DOI] [PubMed] [Google Scholar]
- 33.Pasternack R. M., Qian Z., Zheng J. Y., Metaxas D. N., Boustany N. N., “Highly sensitive size discrimination of sub-micron objects using optical Fourier processing based on two-dimensional Gabor filters,” Opt. Express 17, 12001–12012 (2009). 10.1364/OE.17.012001 [DOI] [PubMed] [Google Scholar]
- 34.Alexandrov S. A., Uttam S., Bista R. K., Liu Y., “Spectral encoding of spatial frequency approach for characterization of nanoscale structures,” Appl. Phys. Lett. 101033702 (2012). 10.1063/1.4737209 [DOI] [PMC free article] [PubMed] [Google Scholar]
- 35.Alexandrov S. A., Uttam S., Bista R. K., Zhao C., Liu Y., “Real-time quantitative visualization of 3D structural information,” Opt. Express 20, 9203–9214 (2012). 10.1364/OE.20.009203 [DOI] [PMC free article] [PubMed] [Google Scholar]
- 36.Goodman J., Introduction to Fourier Optics (Roberts & Company, Colorado, 1999). [Google Scholar]
- 37.Mandel L., Wolf E., Optical Coherence and Quantum Optics (Cambridge University Press, New York, 1995). [Google Scholar]


