

Abstract
Objectives:
This study compares the effective dose for different fields of view (FOVs), resolutions and X-ray parameters from two cone beam CT units: the KaVo 3D (three-dimensional) eXam and the KaVo Pan eXam Plus 3D (KaVo Dental, Biberach, Germany).
Methods:
Measurements were made using thermoluminescent dosemeter chips in a radiation analog dosimetry head and neck phantom. The calculations of effective doses are based on the ICRP 60 and ICRP 103 recommendations of the International Commission on Radiological Protection.
Results:
Effective doses from the 3D eXam ranged between 32.8 µSv and 169.8 µSv, and for the Pan eXam Plus effective doses ranged between 40.2 µSv and 183.7 µSv; these were measured using ICRP 103 weighting factors in each case. The increase in effective dose between ICRP 60 and ICRP 103 recommendations averaged 157% for all measurements.
Conclusions:
Effective doses can be reduced significantly with the choice of lower resolutions and mAs settings as well as smaller FOVs to avoid tissues sensitive to radiation being inside the direct beam. Larger FOVs do not necessarily lead to higher effective doses.
Keywords: cone beam computed tomography, radiation dosimetry, phantom, radiation protection
Introduction
The use of X-rays in dentistry is not without risks. A recent study by Claus et al, for example, found that bitewing and panorex dental X-rays may be associated with a higher risk of intracranial meningioma.1 This study draws criticism because the results are only based on patients’ telephone survey of dental X-ray examinations made over their lifetimes as stated by the American Dental Association and the American Academy of Oral and Maxillofacial Radiology.2,3 The benefit and the radiobiological risk of this technology should be balanced for every indication. This holds true especially for cone beam computed tomography (CBCT), which may cause an increase in patient radiation exposure owing to effective doses being 3 to 44 times higher than regular panoramic images.4 Although it is currently an additional technique of diagnostic radiology, in certain cases, it may be a substitution for some of today’s two-dimensional techniques in the future.5 It can be used for various indications, including traumatology in the head region, evaluation of bone pathologies, detection of nerve positions or apical lesions to name a few.6 Therefore, the user should be aware of the requirements for the particular diagnostic reason of the scan as well as the potential in dose reduction when lower adjustments are sufficient to avoid overexposure. With a variety of different fields of view (FOVs), resolutions and X-ray parameters to match the diverse tasks for CBCT units, this study provides an overview of their impacts on the effective dose.
Materials and methods
To measure the absorbed radiation, the upper nine levels of an Alderson Rando ART-210 (radiation analog dosimetry) phantom (Radiology Support Devices Inc., Long Beach, CA) were used. It consists of a human skull embedded in tissue-equivalent synthetic material and corresponds to a 175 cm tall and 73.5 kg male person. Every level has a height of 2.5 cm. The pre-drilled holes with a diameter of 5 mm and a distance of 3 cm in between were used to place 24 thermoluminescent dosemeters (TLD) at 24 phantom sites. The distribution of these sites is based on the accredited publication by Ludlow and Ivanovic “to reflect critical organs known to be sensitive to radiation”.4 This includes the technique by Underhill et al7 to determine the calvarial dose from the average of three locations in the calvarium. Because of the individuality of the used phantom some sites had to be changed for this publication: the corpus mandibulae was measured anterior and on the left side in Level 7, the submandibular glands were measured in Level 7 and the parotid glands were measured in Level 5. Ti- and Mg-doped TLD 100 lithium fluoride chips by RadPro International (Wermelskirchen, Germany) with a size of 3 × 3 × 1 mm were used to record radiation doses. The chips were pre-calibrated and analysed by the radiation protection laboratories of the Karlsruhe Institute of Technology (KIT, Karlsruhe, Germany). A CS-137 source with a known radiation of 10 mSV was used for calibration. Correction factors were applied to satisfy the different sensitivity for exposure of each individual TLD chip as well as energy calibration factors to normalize for energy because of the high-energy calibration source used and the relatively low energy X-rays (90–120 kV). The TLD reader used was a Harshaw Nuclear Systems 2000a (Harshaw Nuclear Electronics, Inc., Cleveland, OH). The TLD and TLD reader measuring range given by the KIT is routinely set between 100 µGy and 100 mGy. After each measurement all TLD chips were mailed to the KIT where they were shielded in a steel vault. This reduced the background radiation until further analysis. Two experimentally established standard doses of 0.0022 mSV and 0.0005 mSv per day were included by the KIT in the calculations. They represent the background radiation recorded on the TLD chips during transport and the time spent in the steel vault, respectively. The doses had been previously determined by KIT radiation physicists. Four additional TLD chips, which were not irradiated for the measurements, were used to ensure no additional radiation dose was recorded during transport and storage.
The selected CBCT units for this study were the three-dimensional (3D) eXam and the Pan eXam Plus 3D by KaVo (Biberach, Germany). While the 3D eXam provides an FOV up to 23 × 17 cm, the Pan eXam Plus 3D combines an FOV up to 6.1 × 7.8 cm with the possibility of making panoramic radiographs. The phantom was placed on a tripod using each CBCT unit’s light localizer to orientate the phantoms midsagittal plane in the center of the image field (Figure 1). Multiple marks on the phantom and floor were made to ensure a reproducible placement. To reflect the different indications for CBCT imaging, different FOVs and resolutions were chosen for each unit, which are listed in Table 1. The FOVs range from 4.1 × 6.1 cm to 23 × 17 cm with resolutions from 0.125 mm to 0.4 mm voxel size. Standard exposure settings were used for the Pan eXam Plus 3D. The 3D eXam has fixed exposure settings for the different FOV and resolution options. Because of the low amounts of radiation from CBCT examinations compared with the typical measurement range of TLDs, the phantom was irradiated three times for each measurement without changing its position.4 For examinations of the pre scans, 50 irradiations were made. To compare the deviations between two measurements with the same X-ray parameters, two runs were made for Measurements 4 and 17, respectively. For each run, the phantom was irradiated once.
Figure 1.
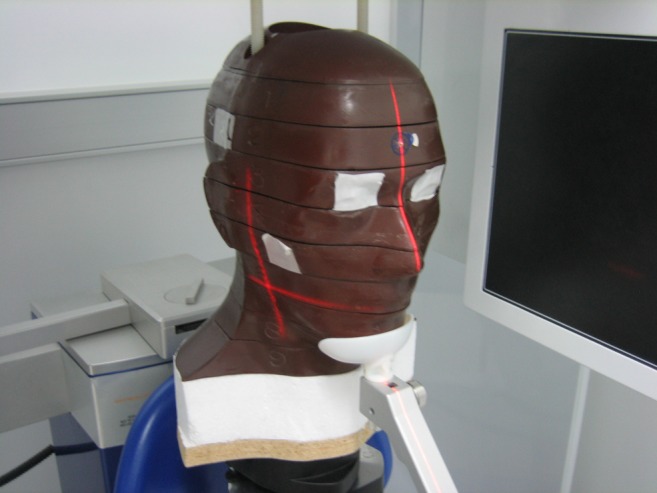
Phantom positioning using the KaVo 3D eXam´s light localizer (KaVo Dental, Biberach, Germany)
Table 1.
| Device | Measurement number | FOV (cm) | Voxel size (mm) | Scan time/exposure time (s) | kV | mA | mAs |
| KaVo 3D eXam | 1 | 23 × 17 pre scan | — | –/0.12 | 120 | 5 | 0.6 |
| 2 | 23 × 17 | 0.4 | 8.9/3.7 | 120 | 5 | 18.54 | |
| 3 | 16 × 13 | 0.3 | 8.9/3.7 | 120 | 5 | 18.54 | |
| 4 | 16 × 8 | 0.25 | 26.9/7.4 | 120 | 5 | 37.07 | |
| 5 | 16 × 8 | 0.3 | 4.8/2.0 | 120 | 5 | 10 | |
| 6 | 16 × 4 maxilla | 0.125 | 26.9/7.4 | 120 | 5 | 37.07 | |
| 7 | 16 × 4 maxilla | 0.3 | 8.9/3.7 | 120 | 5 | 18.54 | |
| 8 | 16 × 4 mandible | 0.125 | 26.9/7.4 | 120 | 5 | 37.07 | |
| 9 | 16 × 4 mandible | 0.3 | 8.9/3.7 | 120 | 5 | 18.54 | |
| 10 | 8 × 8 | 0.125 | 26.9/7.4 | 120 | 5 | 37.07 | |
| 11 | 8 × 8 | 0.3 | 8.9/3.7 | 120 | 5 | 18.54 | |
| KaVo Pan eXam Plus 3D | 12 | 6.4 × 7.8 pre scan | — | –/0.12 | 90 | 13 | 0.52 |
| 13 | 6.1 × 4.1 maxilla | 0.2 | 10.1/2.3 | 90 | 10 | 23 | |
| 14 | 6.1 × 4.1 maxilla | 0.133 | 10.1/6.1 | 90 | 8 | 48.8 | |
| 15 | 6.1 × 4.1 mandible | 0.2 | 10.1/2.3 | 90 | 10 | 23 | |
| 16 | 6.1 × 4.1 mandible | 0.133 | 10.1/6.1 | 90 | 8 | 48.8 | |
| 17 | 6.4 × 7.8 maxilla | 0.3 | 20.1/4.7 | 90 | 10 | 47 | |
| 18 | 6.4 × 7.8 maxilla | 0.2 | 20.1/12.5 | 90 | 6.3 | 79.38 | |
| 19 | 6.4 × 7.8 mandible | 0.3 | 20.1/4.7 | 90 | 10 | 47 | |
| 20 | 6.4 × 7.8 mandible | 0.2 | 20.1/12.5 | 90 | 6.3 | 79.38 |
Manufactured by KaVo Dental, Biberach, Germany.
The radiation weighted dose HT for each organ and tissue in microsieverts (µSv) was obtained using averaged recorded doses on the TLDs from the multiple radiation runs and calculated arithmetic means corresponding to an organ or a tissue with multiple measuring sites. The irradiated percentage of each organ and tissue was taken account of by using data described by Ludlow and Ivanovic.4 Therefore, the distribution of active bone marrow in the adult body was also assumed as published by White and Rose,8 with 1.3% for the mandible, 11.8% for the calvarium and 3.4% for the cervical spine. Following the procedure of Ludlow et al4,9 the proportion of skin surface area irradiated in the head and neck area in this study is estimated to be 5% of the total body, as is the proportion of muscle and lymphatic node tissue of the total body complement. The irradiated proportion of the oesophageal tract was set at 10% as well. To calculate the absorbed dose for bone, the following equation was also adopted: bone/muscle attenuation ratio = −0.0618 × kV peak × 2/3 + 6.9406.
Different tissue weighting factors as published by the International Commission on Radiological Protection (ICRP) in the ICRP 60 recommendations from 1990 and the ICRP 103 recommendations from 2007 were used to calculate the effective dose.10,11 The effective dose allows the comparison of detriment caused by a partial to a whole-body irradiation and is defined as follows: E = ∑WT × HT, where WT is the tissue weighting factor and HT the equivalent dose for the tissue (T). The tissue weighting factors are age averaged and gender averaged, and they reflect the contribution of individual tissues to the total radiation injury. They are divided into independently weighted tissues and the group of remainder tissues with a common weighting factor. With the ICRP 103 recommendation, the tissue weighting factors from ICRP 60 were revised and the salivary glands were added to the independently weighted tissues. In addition, several tissues were added to the group of remainder tissues and the brain was changed to an independently weighted tissue. Of the independently weighted tissues only bone marrow, oesophagus, thyroid, bone surface, brain (ICRP 103), salivary glands (ICRP 103) and skin were used for the calculations, and of the remainder group only muscle, brain (ICRP 60), extrathoracic region (ICRP 103), lymphatic nodes (ICRP 103) and oral mucosa (ICRP 103). This is owing to the fact that the impact on the total effective dose from the other organs and tissues is considered to be negligible for these measurements.4,12
Results
The calculated effective doses for the 3D eXam range from 32.8 µSv to 169.8 µSv, the Pan eXam Plus 3D shows values between 40 µSv and 183.7 µSv. The pre-scan produced an effective dose of 3.1 µSv for the 3D eXam and 1.1 µSv for the Pan eXam Plus 3D. For all examinations, an increase in the effective dose calculations is seen comparing the ICRP 60 recommendations with the ICRP 103 recommendations. Table 2 provides the calculated effective doses of the examinations for the 3D eXam and the Pan eXam Plus 3D as well as the deviations between ICRP 60 and ICRP 103 calculations. Measurements 4 and 17, which were made twice to calculate the deviations between each run, show a variation in the effective dose of 4.2% (ICRP 60)/3.3% (ICRP 103) for the 3D eXam and 0.4% (ICRP 60)/0.9% (ICRP 103) for the Pan eXam Plus 3D, as shown in Table 3.
Table 2.
Calculated effective doses from the three-dimensional (3D) eXama and Pan eXam Plus 3Da for ICRP 60 and ICRP 103 recommendations of the International Commission on Radiological Protection (ICRP)
| Device | Measurement ID | FOV (cm) | Voxel size (mm) | Effective dose ICRP 60 (µSv) | Effective dose ICRP 103 (µSv) | Deviation (%) |
| KaVo 3D eXam | 1 | 23 × 17 pre scan | — | 1.7 | 3.1 | 82.4 |
| 2 | 23 × 17 | 0.400 | 56.4 | 72.0 | 27.7 | |
| 3 | 16 × 13 | 0.300 | 62.7 | 106.7 | 70.2 | |
| 4 | 16 × 8 | 0.250 | 67.6 | 169.8 | 151.2 | |
| 5 | 16 × 8 | 0.300 | 18.4 | 44.5 | 141.8 | |
| 6 | 16 × 4 maxilla | 0.125 | 25.6 | 67.6 | 164.1 | |
| 7 | 16 × 4 maxilla | 0.300 | 12.3 | 32.8 | 166.7 | |
| 8 | 16 × 4 mandible | 0.125 | 29.2 | 76.3 | 161.3 | |
| 9 | 16 × 4 mandible | 0.300 | 14.3 | 37.7 | 163.6 | |
| 10 | 8 × 8 | 0.125 | 48.4 | 122.1 | 152.3 | |
| 11 | 8 × 8 | 0.300 | 22.8 | 61.6 | 170.2 | |
| KaVo Pan eXam Plus 3D | 12 | 6.4 × 7.8 pre scan | — | 0.4 | 1.1 | 175.0 |
| 13 | 6.1 × 4.1 maxilla | 0.200 | 11.7 | 40.2 | 243.6 | |
| 14 | 6.1 × 4.1 maxilla | 0.133 | 23.8 | 79.2 | 232.8 | |
| 15 | 6.1 × 4.1 mandible | 0.200 | 20.9 | 49.3 | 135.9 | |
| 16 | 6.1 × 4.1 mandible | 0.133 | 48.8 | 114.8 | 135.2 | |
| 17 | 6.4 × 7.8 maxilla | 0.300 | 27.4 | 79.3 | 189.4 | |
| 18 | 6.4 × 7.8 maxilla | 0.200 | 38.0 | 124.9 | 228.7 | |
| 19 | 6.4 × 7.8 mandible | 0.300 | 39.3 | 109.6 | 178.9 | |
| 20 | 6.4 × 7.8 mandible | 0.200 | 68.4 | 183.7 | 168.6 |
Manufactured by KaVo Dental, Biberach, Germany.
Table 3.
Deviation in the effective dose for each run of Measurement 4 (M4) and 17 (M17) for ICRP 60 and ICRP 103 recommendations of the International Commission on Radiological Protection (ICRP)
| M4 |
M4 |
M17 |
M17 |
|
| Measurement/calculation | ICRP 60 | ICRP 103 | ICRP 60 | ICRP 103 |
| Effective dose run 1 (µSv) | 66.2 | 167.0 | 27.3 | 79.6 |
| Effective dose run 2 (µSv) | 69.0 | 172.5 | 27.4 | 78.9 |
| Deviation (%) | 4.2 | 3.3 | 0.4 | 0.9 |
| Effective dose averaged (µSv) | 67.6 | 169.8 | 27.4 | 79.3 |
Organ doses varied depending on the FOV’s position and settings of resolution and exposure time. Typical organ doses in the middle range are shown in Table 4.
Table 4.
Typical organ doses in the middle range from the three-dimensional (3D) eXama (Measurement 6) and Pan eXam Plus 3Da (Measurement 12)
| Organ/tissue | Measurement 6 (µSv) | Measurement 17 (µSv) |
| Bone marrow | 51 | 49 |
| Thyroid | 199 | 201 |
| Brain | 273 | 300 |
| Salivary glands | 1607 | 2019 |
| Extrathoracic airway | 1523 | 1770 |
| Oral mucosa | 1828 | 2215 |
Manufactured by KaVo Dental, Biberach, Germany.
Discussion
The results of the examinations show the large range of variation for the effective dose, depending on the selected FOV, resolution and X-ray parameters. The often mentioned simple rule of 4 single-tooth radiographs = 1 panoramic radiograph and 4 panoramic radiographs = 1 CBCT13 is therefore only approximately true for the examinations with the lowest effective doses measured assuming the effective dose of a panoramic radiograph to be 10 µSv. For the 3D eXam, a multiplication of factor 5.2 is seen between the lowest (Measurement 7: 16 cm × 4 cm, 0.3 mm voxel size) and highest (Measurement 4: 16 × 8 cm, 0.25 mm voxel size) calculated effective dose. The Pan eXam Plus 3D shows a multiplication of factor 4.6 between the lowest (Measurement 13: 6.1 × 4.1 cm, 0.2 mm voxel size) and the highest (Measurement 20: 6.1 × 7.8 cm, 0.2 mm voxel size) effective dose. Therefore, the applied FOV, resolution and X-ray parameter settings should be considered precisely for the particular indication. For example, utilizing a reduced resolution of 0.3 mm voxel size instead of 0.125 mm voxel size can cause a bisection of effective dose, as shown with Measurement 6 (16 × 4 cm, 0.125 mm voxel size) and 7 (16 × 4 cm, 0.3 mm voxel size). Lower resolutions need fewer basic images, and therefore a lower exposure time and lower mAs settings are needed. This is also the case for scans with a rotation of only 180° instead of the usual 360°. For Measurement 5 (16 × 8 cm, 0.3 mm voxel size) such a scan was performed with an exposure time of only 2 s. Lower mAs settings can also be achieved if the CBCT unit allows adjustment by the user as the Pan eXam Plus 3D does. These settings should be considered in particular for younger people or children, as they are more sensitive to radiation.14 Larger FOVs resulted in higher effective doses, provided that resolution and exposure settings were held identical. In this respect, it was most important to note whether sensitive organs were inside or outside the direct beam. This is true especially for the thyroid and the salivary glands, which are both weighted independently and received high equivalent doses. As a result, different locations of the same FOV-size can have a crucial influence on the effective dose. An example is the comparison of Measurements 17 (6.1 × 7.8 cm, 0.3 mm voxel size, upper jaw) and 19 (6.1 × 7.8 cm, 0.3 mm voxel size, lower jaw), where just the different FOV position led to a 30.1% increase in the effective dose, mainly because of the higher equivalent dose for the thyroid from the lower jaw scan. This is also the case for the other measurements made from the upper and lower jaw with identical resolution and X-ray parameters. Beyond that the influence of patient positioning on effective dose is shown. This is illustrated in a study by Ludlow, where a 10° rotation of the Frankfurt plane resulted in a 92% difference in dose for a thyroid surface dosemeter location.15 If a large FOV is needed, this can be achieved on the 3D eXam with a low effective dose compared with the other results: the 23 × 17 cm FOV of Measurement 2 with a voxel size of 0.4 mm was calculated from two 180° rotation scans and resulted in an effective dose of only 72 µSv. Such large FOVs do not necessarily cause exceptionally high effective doses. This finding can be explained by the multiplicity of factors determining the effective dose, such as exposition time, exposition area, exposition time per area etc. The examinations of the pre scans resulted in very low effective doses from both units and should prompt the use of such a pre scan before every examination to avoid unusable images and allow a more precise patient positioning to adopt the previously mentioned possibilities for dose reduction.
The revision of the tissue weighting factors for the ICRP 103 recommendations resulted in higher effective doses for all measurements of approximately 157%. This is mainly owing to the addition of the salivary glands to the independently weighted tissues as well as the addition of the lymphatic nodes, the extrathoracic airway and the oral mucosa to the group of remainder tissues with the new weighting factor of 0.12. Considering these large deviations, it is important to note which weights have been used for calculation when comparing doses of different studies with each other.
For all calculated doses in this study, it has to be mentioned that they are related to the used head and neck phantom and cannot be adapted to individual patients. The calculations are based on averaged doses for each tissue and these tissues may have a significant variation in position and dimension for each individual. Therefore, the simplified and punctual arranged measuring sites cannot reflect the actual equivalent doses real tissues might receive. For a large tissue with only one or few measuring locations, and the fact that these locations could be inside or outside the direct beam, over- or underestimation of the dose may result. This could be compensated for with a large number of measuring locations. However, dosemeter placement would be very difficult owing to the limited available space in the head and neck phantom. In addition, it should be noted that the tissue weighting factors are not age specific or gender specific, are based on risk data from exposed populations and are calculated for a reference person, not for an individual. According to Martin there is an uncertainty in effective dose of about 40%.16 The effective dose is especially problematic for heterogeneous exposure and only partially exposed tissues, which is the case in dental radiography. Such an effective dose should be used only as intended: as a protection quantity for optimization in dose reduction, radiation protection and comparison of standard values and different diagnostic procedures.11 To evaluate the medical radiation exposure and estimate the patient’s individual risk, the ICRP recommends using organ doses of the irradiated tissues. This allows a more specific view on the actual exposure and the possibility of cancer induction for individual organs and tissues the effective dose cannot reflect.11
With an effective dose of 74 µSv calculated by Ludlow and Ivanovic from the identical Next Generation i-CAT (Imaging Sciences International, Hatfield, PA) and for the same settings of FOV, resolution and X-ray parameters as used in Measurement 2, the result in this study is nearly identical with an effective dose of 72 µSv. On the contrary, a comparison with other studies is often difficult because of the use of different dosemeters, measuring locations, phantoms or methodologies.17 For example, a study by Palomo et al is based on ten TLDs for each measurement,18 whereas measurements by Pauwels et al are based on 147 and 152 TLDs (for two different phantoms).19
In conclusion, a more standardized approach would produce relief, especially for the user responsible for finding a radiation exposure as low as reasonably achievable. Further improvements could be made by adding more dosemeter sites in a whole-body phantom to produce more detailed information on radiation exposure in the upper part of the body.
Acknowledgment
Special thanks go to Dr John Ludlow (DDS, School of Dentistry, UNC Chapel Hill, NC) for his support during the analysis of the results for this study.
References
- 1.Claus EB, Calvocoressi L, Bondy ML, Schildkraut JM, Wiemels JL, Wrensch M. Dental X-rays and risk of meningioma. Cancer 2012; 118: 4530–4537 [DOI] [PMC free article] [PubMed] [Google Scholar]
- 2.American Dental Association Press Release; American Dental Association. Recent study questions safety of dental X-rays. 10 April 2012 [cited 14 October 2012]. Available from: http://www.ada.org/6972.aspx. [Google Scholar]
- 3.American Academy of Oral and Maxillofacial Radiology. AAOMR response to recent study on dental X-ray risks. 17 April 2012 [cited 14 October 2012]. Available from: http://www.aaomr.org/resource/resmgr/docs/aaomr_response_to_study2.pdf. [Google Scholar]
- 4.Ludlow JB, Ivanovic M. Comparative dosimetry of dental CBCT devices and 64-slice CT for oral and maxillofacial radiology. Oral Surg Oral Med Oral Pathol Oral Radiol Endod 2008; 106: 106–114 [DOI] [PubMed] [Google Scholar]
- 5.S1 Empfehlung: Dentale Volumentomographie (DVT) Dusseldorf, Germany: Deutsche Gesellschaft für Zahn-, Mund- und Kieferheilkunde—Leitlinien der DGZMK; 2009 [Google Scholar]
- 6.Geibel MA. DVT Kompendium. 2nd edn Kempten, Germany: Allgäuer Zeitungsvlg; 2011 [Google Scholar]
- 7.Underhill TE, Chilvarquer I, Kimura K, Langlais RP, McDavid WD, Preece JW, et al. Radiobiologic risk estimation from dental radiology. Part I. Absorbed doses to critical organs. Oral Surg Oral Med Oral Pathol 1988; 66: 111–120 [DOI] [PubMed] [Google Scholar]
- 8.White SC, Rose TC. Absorbed bone marrow dose in certain dental radiographic techniques. J Am Dent Assoc 1979; 98: 552–558 [DOI] [PubMed] [Google Scholar]
- 9.Ludlow JB, Davies-Ludlow LE, Brooks SL, Howerton WB. Dosimetry of 3 CBCT devices for oral and maxillofacial radiology: CB Mercuray, NewTom 3G and i-CAT. Dentomaxillofac Radiol 2006; 35: 219–226 [DOI] [PubMed] [Google Scholar]
- 10.Bundesamt für Strahlenschutz. Empfehlungen der Internationalen Strahlenschutzkommission 1990. ICRP Veröffentlichung 60. New York, NY: Gustav Fischer Verlag; 1993 [Google Scholar]
- 11.Bundesamt für Strahlenschutz. Die Empfehlungen der Internationalen Strahlenschutzkommission (ICRP) von 2007; ICRP-Veröffentlichung 103 verabschiedet im März 2007. [cited 9 August 2011]. Available from: http://nbn-resolving.de/urn:nbn:de:0221-200908215. [Google Scholar]
- 12.Daly MJ, Siewerdsen JH, Moseley DJ, Jaffray DA, Irish JC. Intraoperative cone-beam CT for guidance of head and neck surgery: assessment of dose and image quality using a C-arm prototype. Med Phys 2006; 33: 3767–3780 [DOI] [PubMed] [Google Scholar]
- 13.Düker J. Praxisleitfaden Zahnärztliche Radiologie. 1st edn München, Germany: Elsevier Urban und Fischer; 2006 [Google Scholar]
- 14.Horner K, Rushton V, Walker A, Tsiklakis K, Hirschmann P, van der Stelt P, et al. European guidelines on radiation protection in dental radiology. The safe use of radiographs in dental practice. Radiation Protection 136. Luxembourg: Office for Official Publications of the European Communities; 2004 [Google Scholar]
- 15.Ludlow JB. Dose and risk in dental diagnostic imaging: with emphasis on dosimetry of CBCT. Korean J Oral Maxillofacial Radiol 2009; 39: 175–184 [Google Scholar]
- 16.Martin CJ. Effective dose: how should it be applied to medical exposures? Br J Radiol 2007; 80: 639–647 [DOI] [PubMed] [Google Scholar]
- 17.Thilander-Klang A, Helmrot E. Methods of determining the effective dose in dental radiology. Radiat Prot Dosimetry 2010; 139: 306–309 [DOI] [PubMed] [Google Scholar]
- 18.Palomo JM, Rao PS, Hans M. Influence of CBCT exposure conditions on radiation dose. Oral Surg Oral Med Oral Pathol Oral Endod 2008; 105: 773–782 [DOI] [PubMed] [Google Scholar]
- 19.Pauwels R, Beinsberger J, Collaert B, Theodorakou C, Rogers J, Walker A, et al. Effective dose range for dental cone beam computed tomography scanners. Eur J Radiol 2012; 81: 267–271 [DOI] [PubMed] [Google Scholar]