Abstract
Objective:
To establish whether T2 relaxation and apparent diffusion coefficient (ADC) in normal prostate and tumour are related and to investigate the effects of glandular compression from an enlarged transition zone (TZ) on peripheral zone (PZ) T2 and ADC by correlating them with the peripheral zone fractional volume (PZFV).
Methods:
48 consecutive patients prospectively underwent multiecho T2 weighted (T2W) (echo times 20, 40, 60, 80, 100 ms) and diffusion-weighted (b=0, 100, 300, 500, 800 s mm−2) endorectal MRI. In 43 evaluable patients, single slice whole PZ, TZ and tumour (focal hypointense signal on T2W images in a biopsy-positive octant) regions of interest were transferred to T2 and ADC maps by slice matching. T2 and ADC values were correlated, and PZ values were correlated with PZFV.
Results:
T2 and ADC values were significantly different among groups [T2 mean±standard deviation (SD) PZ, 149±49 ms; TZ, 125±26 ms; tumour, 97±23 ms; PZ vs TZ, p=0.002; PZ vs tumour, p<0.0001; TZ vs tumour, p<0.0001; ADC×10−6 mm2 s−1 mean±SD PZ, 1680±215; TZ, 1478±139; tumour, 1030±205; p<0.0001]. Significant positive correlations existed between T2 and ADC for PZ, TZ, PZ and TZ together, but not for tumour (r=0.515, p<0.0001; r=0.300, p=0.03; r=0.526, p<0.0001; and r=0.239, p=0.32, respectively). No significant correlation existed between PZFV and PZ T2 (r=0.10, p=0.5) or ADC (r=0.03, p=0.8).
Conclusion:
The correlation between T2 and ADC that exists in normal prostate is absent in tumour. PZ compression by an enlarged TZ does not alter PZ T2 or ADC to affect tumour–PZ contrast.
Advances in Knowledge:
Microstructural features of tumours alter diffusivity independently of their effects on T2 relaxation.
T2 weighted (T2W) MRI is routinely used for diagnosis and staging of prostate cancer, because the soft-tissue contrast is able to identify hypointense tumours within the high signal intensity of the normal glandular peripheral zone [PZ [1,2]; where the majority (∼70%) of prostate cancers occur [3]]. It is less useful at distinguishing hypointense tumours in the transition zone (TZ) because of the low signal intensity of stromal and glandular hyperplasia on T2W images. Even in the best hands, therefore, sensitivity and specificity of T2W imaging alone varies from 50% and 80%, respectively [4], to 54% and 91%, respectively [5], so that other contrast mechanisms, such as diffusion-weighted (DW) MRI (where contrast generated relies on water movement within tissues of the order of 20–30 μm), are increasingly employed to improve the accuracy of prostate cancer detection [5–9]. A combination of T2W and DW MRI has been shown to improve the sensitivity and specificity of small (4 mm) tumours to 81% and 84%, respectively [5].
Tissues that show restricted diffusion (fibrous tissue, muscle) are often relatively hypointense on T2W images. The association between T2 relaxation and diffusivity has mainly been studied in the normal brain [10,11], in experimental rat brain tumour [12] and in skeletal muscle, following exercise, where increases in T2 were mirrored by increases in the apparent diffusion coefficient (ADC) derived from DW MRI [13]. However, if DW MRI contrast merely reflected T2W contrast, the improvement in detecting tumours by the addition of DW MRI data to T2W data, particularly in the TZ of the prostate, would be marginal. There are no in vivo data sets comparing the association between T2 relaxation and diffusivity in normal vs tumour tissue. In addition, there may be confounding effects on both T2 and diffusivity, for example, when the normal acinar and ductal structure of the PZ is compressed by enlargement of the TZ, with age potentially reducing the fluid content within the ductal microstructure. The purpose of this study, therefore, was to establish whether T2 relaxation and ADC in normal prostate and tumour are related and to investigate the effects of glandular compression owing to an enlarged TZ on PZ T2 and ADC by correlating them with the fractional volume of the PZ (PZFV).
METHODS AND MATERIALS
Patient population
48 consecutive patients aged 48–83 years (mean age 67±8 years) with untreated biopsy-confirmed prostate cancer, either on active surveillance or on watchful waiting, were studied prospectively over a 7-month period. All biopsies were obtained before MRI. The median time interval between biopsy and MRI was 14 weeks, with an interquartile range of 8.9–25.5 weeks. The study was approved by the institutional ethics committee, and patients underwent MRI with their written informed consent. Patients with previous radiation therapy to the pelvis, those who had previous treatment for prostate cancer or those with ferromagnetic implants or claustrophobia were excluded. Tumour was confirmed in 47 cases by octant biopsy and in 1 case by prostatectomy; histology was obtained between 1 month and 26 months of MRI (mean 4.3 months, median 3.0 months). The number of positive cores ranged from 0 to 8, and the Gleason grade was 3+3 (n=41), 3+4 (n=3), 4+3 (n=3) and 4+4 (n=1); prostate-specific antigen range was 3.6–88 ng ml−1 (median 8.0, lower quartile 5.9, upper quartile 13.1 ng ml−1).
MRI technique
Patients were scanned on a 3.0-T Achieva (Philips Medical Systems, Best, Netherlands). In all cases, an endorectal receiver coil (MedRad, Warrendale, PA), inflated with 60 ml of air in combination with an external six-channel phased array coil was used. An antispasmodic agent, 1 ml hyoscine butylbromide (20 mg ml−1), was administered intramuscularly to all patients prior to scanning. T2W fast spin echo images were acquired in three orthogonal planes to the prostate: sagittal, axial and coronal. Following this, a multiecho sequence with five echo times (TEs; 20, 40, 60, 80, 100 ms) and a DW sequence with five b values (0, 100, 300, 500, 800 s mm−2) were acquired in the axial plane. Image parameters are given in Table 1. Slice thickness was 2.2 mm for all axial images, so that slice matching could be undertaken. No contrast studies were performed. On completion of the endorectal imaging, axial T1 weighted (T1W) and T2W images of the whole pelvis were acquired to determine the nodal status. The T1W images were examined to assess the existence of any haemorrhage. Overall scan time was 30–40 min.
Table 1.
Parameters for T2 weighted (T2W), multiecho T2 and diffusion-weighted sequences
| Parameter | T2W TSE | GraSE multiecho | EP DWI |
| TR (ms) | 3643 | 3000 | 5129 |
| TE (ms) | 110 | 20, 40, 60, 80, 100 | 65 |
| Number of slices | 20–24 | 20–24 | 20–24 |
| FA (°) | 90 | 90 | 90 |
| Slice thickness (mm) | 2.2 | 2.2 | 2.2 |
| Field of view (mm) | 120 | 120 | 180 |
| Matrix | Acquired 220×184, recon 256 | Acquired 132×105, recon 192 | Acquired 80×70, recon 128 |
| NSA | 4 | 2 | 2 |
| Voxel size (mm/mm/mm) | 0.55/0.76/2.2 (acquired), 0.55/0.55/2.2 (recon) | 0.91/1.14/2.2 (acquired), 0.63/0.63/2.2 (recon) | 2.25/2.54/2.2 (acquired), 1.14/1.41/2.2 (recon) |
| SENSE factor | 1.5 | 2 | 2 |
| Scan time (min:s) | 4:48×3 | 2:24 | 3:20 |
| Other | TSE factor 13 | TSE factor 5 | b=0, 100, 300, 500, 800 s mm−2 |
EP DWI, echo planar diffusion tensor imaging; FA, flip angle; GraSE, gradient spin echo; NSA, number of signal averages; recon, reconstructed; SENSE, sensitivity encoding; TE, echo time; TR, repetition time; TSE, turbo spin echo.
Data analysis
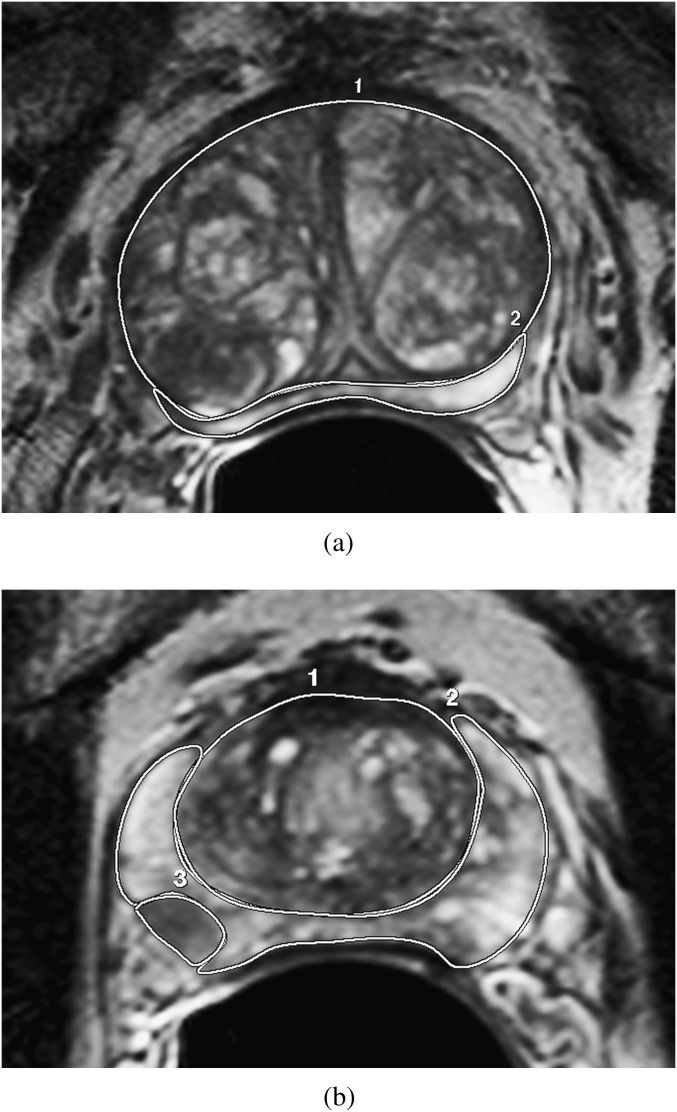
T2 maps and ADC maps were generated from the multi-echo sequence and DW sequence, respectively, using the scanner software. Both techniques applied a monoexponential fit of the data on a pixel-by-pixel basis. In both cases, fitting was optimised by a least squares approach. A radiologist with 15 years of experience in endorectal prostate MRI drew free-hand regions of interest (ROIs) around the PZ and TZ on a single slice of the axial T2W images at the level of the verumontanum (Figure 1). Previous data have shown that ADCs measured in normal prostate regions from parameter maps generated in this way show minimal variation with time [14]. In addition, a free-hand ROI was placed on a single slice around a dominant tumour nodule (identified as an area of hypointense signal on the T2W images in a biopsy-positive octant on the slice where it appeared the largest) with simultaneous visual reference to the ADC maps.
Figure 1.
Transverse T2 weighted slices through the prostate in two separate patients with enlarged transition zone (TZ) but without (a) and with (b) tumour present. The region of interest delineation around the TZ (1) and peripheral zone (2), as well as around tumour (3) in (b), is illustrated.
The ROIs of PZ, TZ and tumour subregions were copied onto registered T2 and ADC maps by matching the slice position. T2 and ADC values were obtained for PZ, TZ and tumour. In addition, the PZ fractional volume, which reflected the compression of the PZ by the TZ, on the single measured slice was calculated as the area of the PZ ROI divided by the total prostate area (the sum of PZ and TZ ROIs). In cases where the tumour ROI was on the same slice as the PZ/TZ ROIs (two in the PZ and two in the TZ), it was excluded from the number of pixels in the PZ but included in the number of total slice pixels, as it would contribute to the compressive effect on the PZ. Single slice volumes for the PZ and TZ were derived from area×slice thickness.
Statistical analysis
Data were analysed using SPSS® v. 19 for Windows (IBM Corporation, Portsmouth, UK). A Kolmogorov–Smirnov test for normality indicated that data were normally distributed. T2 and ADC values from prostate regions (PZ, TZ and tumour) were compared using an independent samples t-test. T2 values from the PZ, TZ, PZ+TZ and tumour were correlated with ADC values using a Pearson’s correlation coefficient. In addition, T2 and ADC values from the PZ were correlated with the PZFV using a Pearson’s correlation coefficient. The differences between the PZ and tumour T2 values and the PZ and tumour ADCs were compared with those with a high and low PZFV (defined as the 25th centile of the PZFV) using an independent samples t-test. The PZFV was also compared in those with and without identifiable tumour on MRI using an independent samples t-test. Significance was determined at the 5% level after correction for multiple comparisons.
RESULTS
Of 48 patients, T1 shortening on the T1W scans indicated haemorrhage in 4 patients. In one patient, a large transurethral resection of the prostate had removed virtually all of the TZ. These five patients were therefore excluded from the analysis. Of the 43 patients analysed, tumour was identified in a biopsy-positive octant in 36 cases and on prostatectomy in 1 case (36 PZ tumours, 5 TZ tumours, 2 both PZ and TZ); 6 patients had no identified tumour on MRI, although biopsies were positive in all cases.
The volume of the PZ on the single measured slice ranged from 0.3 cm3 to 1.6 cm3 [mean ± standard deviation (SD) 1.1±0.3 cm3], single slice TZ volume ranged from 0.7 cm3 to 4.8 cm3 (mean±SD 2.3±1.9 cm3) and single slice tumour volume ranged from 0.04 to 1.8 cm3 (mean ± SD 0.2±0.3 cm3). The PZFV from a single slice ranged from 7.4% to 66.2% (mean±SD 34.4±12.9%). The 25th centile value of the PZFV was 25% and was used to distinguish high and low PZFV.
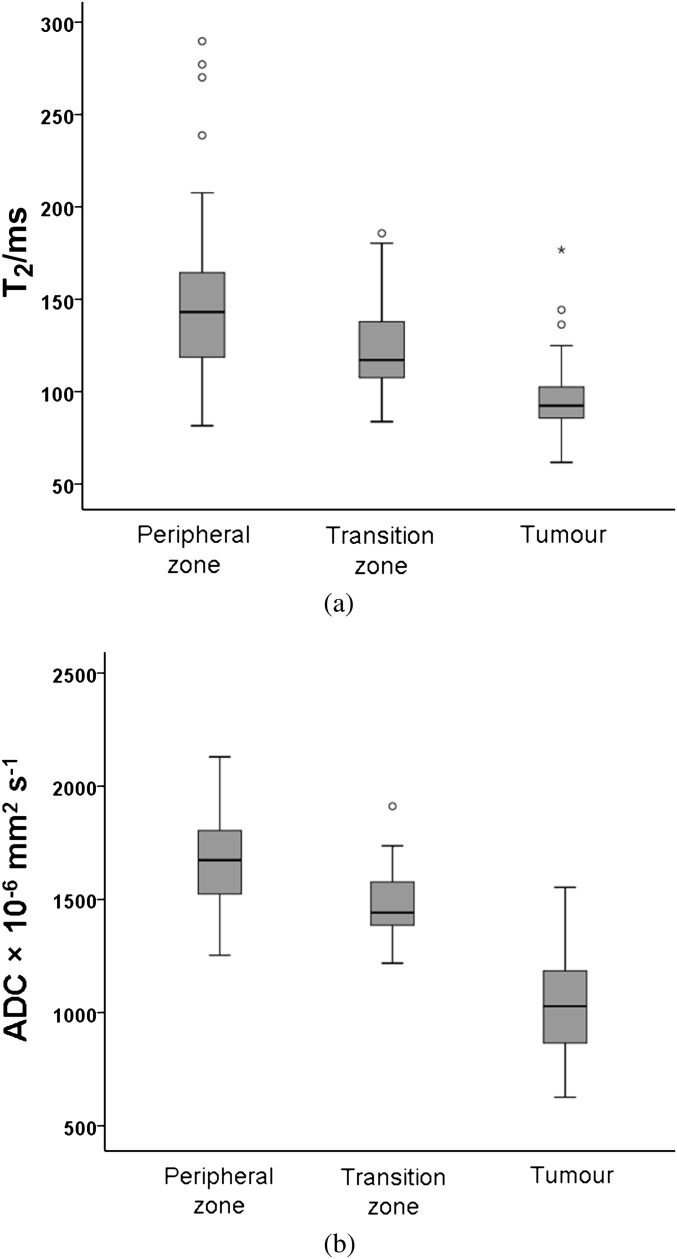
The T2 of the PZ ranged from 82 to 290 ms (mean ± SD 149±49 ms), that of the TZ ranged from 84 to 186 ms (mean ± SD 125±26 ms) and that of tumour ranged from 62 to 177 ms (mean ± SD 97±23 ms). Differences among groups were significant (PZ vs TZ, p=0.002; PZ vs tumour, p<0.0001; and TZ vs tumour, p<0.0001; Figure 2a). The ADC of the PZ ranged from 1254×10−6mm2 s–1 to 2130×10−6 mm2 s–1 (mean±SD 1680±215×10−6 mm2 s–1), that of the TZ ranged from 1219×10−6 mm2 s–1 to 1912 ×10−6 mm2 s–1 (mean±SD 1478+139×10−6 mm2 s–1) and that of tumour ranged from 627×10−6 mm2 s–1 to 1553×10−6 mm2 s–1 (mean±SD 1030±205×10−6 mm2 s–1). Differences among groups were significant (p<0.0001 for all comparisons; Figure 2b).
Figure 2.
Boxplot showing T2 values (a) and apparent diffusion coefficient (ADC) values (b) in the peripheral zone (PZ), transition zone and tumour. Central line of the box indicates median values, and the upper and lower lines, the upper and lower quartiles, respectively. Whiskers indicate maximum and minimum values. Both T2 and ADC are significantly different between groups with values highest in the PZ and lowest in tumour.
Correlation of T2 value with the apparent diffusion coefficient
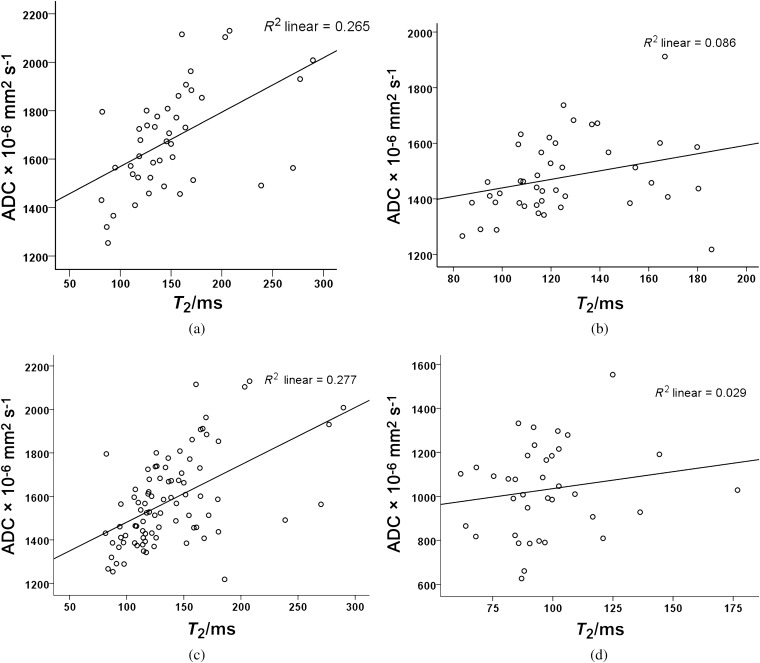
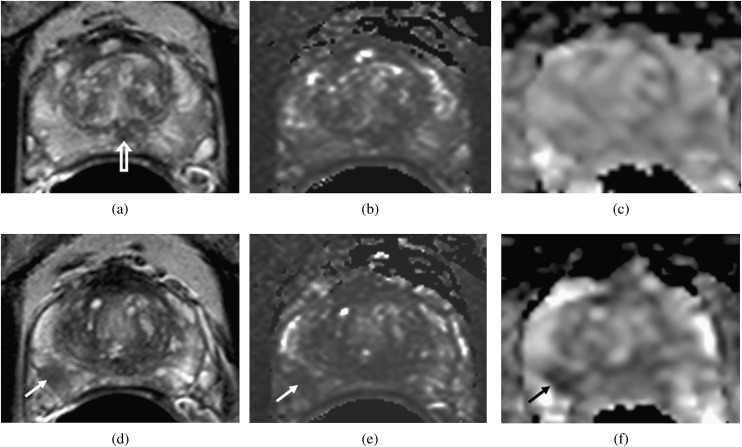
There was a significant positive correlation between T2 and the ADC for PZ, TZ, PZ and TZ together but not for tumour (Pearson’s correlation coefficient r=0.515, p<0.0001, r=0.3, p=0.03; r=0.526, p<0.0001 and r=0.239, p= 0.32, respectively; Figure 3a–d). In order to reduce the partial volume effects from small tumours affecting this correlation for tumour ROIs, the relationship between T2 relaxation and diffusivity was repeated in tumour ROIs of >20 pixels on the ADC maps (n=18), as spatial resolution was lower on ADC than on T2 maps. In these 18 tumours of volume 0.1–1.8 cm3 (mean±SD 0.3±0.4 cm3), the relationship between T2 and ADC was also non-significant (r=0.05, p=0.85; Figures 4 and 5).
Figure 3.
Scatter plots with line of best fit between T2 and apparent diffusion coefficient (ADC) for (a) peripheral zone (PZ), (b) transition zone (TZ), (c) PZ and TZ together and (d) tumour. Correlations in (a), (b) and (c) are significant, but the correlation in (d) is not.
Figure 4.
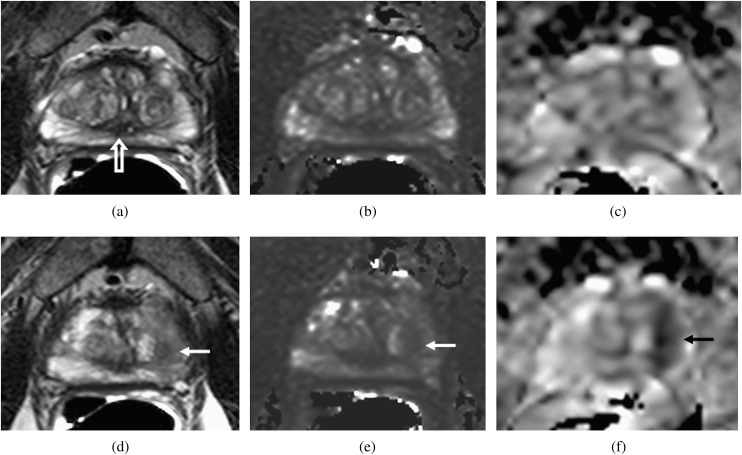
Transverse slices through the prostate at the level of the verumontanum (open arrow, a) and through the tumour (d–f) in a patient with a peripheral zone fractional volume of 32%. T2 Weighted images (a, d), T2 maps (b, e) and apparent diffusion coefficient (ADC) maps (c, f) show that the peripheral zone has a relatively long T2 (148 ms) and a relatively high ADC (1707×10−6 mm2 s−1). The tumour (arrows, d–f) has a short T2 (88 ms) and shows restricted diffusion (ADC=1008×10−6 mm2 s−1).
Figure 5.
Transverse slices through the prostate at the level of the verumontanum (open arrow, a) and through the tumour (d–f) in a patient with a peripheral zone fractional volume of 32%. T2W images (a, d), T2 maps (b, e) and apparent diffusion coefficient (ADC) maps (c, f) show that, as in Figure 4, the peripheral zone has a relatively long T2 (150 ms) and a relatively high ADC (1663×10−6 mm2 s−1). The tumour (arrows, d–f), although larger than in Figure 4, has a slightly longer T2 (97 ms) but shows much more diffusion restriction (ADC=790×10−6 mm2 s−1).
Correlation of T2 value and apparent diffusion coefficient with peripheral zone fractional volume
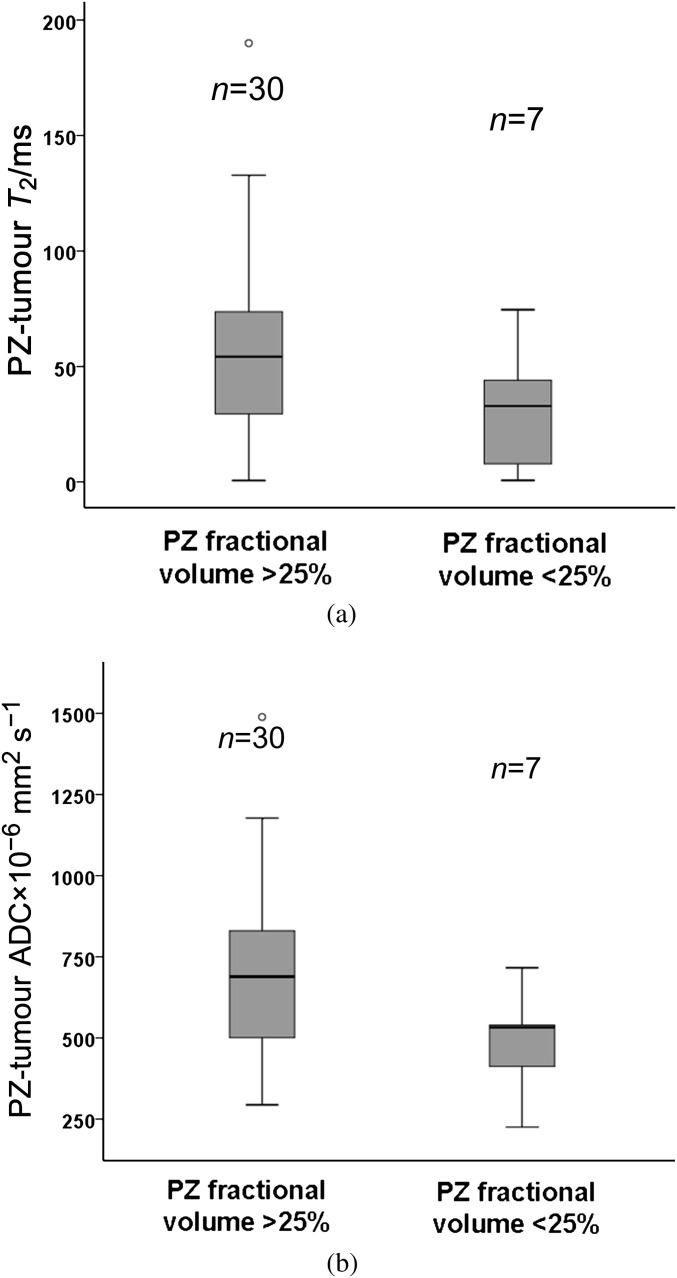
There was no significant correlation between PZ T2 relaxation and PZFV (r=0.1, p=0.5) or between PZ ADC and PZFV (r=0.03, p=0.8). For the 37 cases with identifiable tumour, differences between PZ and tumour T2 were 0.6–190 ms (mean±SD 50 ± 37 ms). These differences were not significant between those with a PZFV of >25% (n=30, mean±SD 55±37 ms) and those with a PZFV of <25% (n=7, mean±SD 30±28 ms; p=0.1; Figure 6a). In these patients, differences between PZ and tumour ADCs were 225×10−6 mm2 s−1 to 1489×10−6 mm2 s–1 (mean±SD 650±261×10−6 mm2 s–1). These differences were not significant between those with a PZFV of >25% (n=30, mean±SD 689±267×10−6 mm2 s–1) and those with a PZFV of <25% (n=7, mean±SD 483±153×10−6 mm2 s–1, p=0.06; Figure 6b). There was no difference in PZFV between those with (n=36) and those without (n=6) visible tumour on MRI (35.7±12.1% vs 26.3±16.0%, p=0.1).
Figure 6.
Boxplot comparing the difference between peripheral zone (PZ) and tumour T2 values (a) and apparent diffusion coefficient (ADC) values (b) in patients with a PZ fractional volume (PZFV) of >25% and <25%. Central line of the box indicates median values, and the upper and lower lines, the upper and lower quartiles, respectively. Whiskers indicate maximum and minimum values. Although the trend is for lower T2 and ADC values at lower PZFV, the differences are not significant.
DISCUSSION
This study demonstrates a significant association between T2 relaxation and ADC for non-tumour prostate regions (including the benign prostatic hyperplasia in the TZ), but not for tumour, and indicates that biological and microstructural features exist in tumours that reduce diffusivity, independent of their effects on T2. The lower ADC in tumours therefore potentially offers discrimination between malignant and non-malignant short T2 lesions. T2W imaging is extensively used in disease detection and staging of prostate cancer where tumour is recognised as a hypointense focal abnormality within the PZ [15], although staging accuracies with T2W imaging alone even with high-resolution three-dimensional techniques remain low (sensitivity 67.4%, specificity 71.1%) [16]. The use of T2 mapping techniques has provided quantification of tumour T2 values [17,18] and has the further advantage of removing signal effects from the sensitivity profile of the coil. Techniques incorporating T2 values into a computer-aided diagnostic system in a small study of 29 patients with 39 malignant, 19 benign and 29 normal regions achieved a diagnostic accuracy of 0.85 [19]. In a clinical diagnostic setting, the use of DW MRI has improved disease detection and staging in prostate cancer when used together with the anatomical definition of T2W imaging [20]. Multiple studies have correlated ADC with tumour cell density and, in prostate cancer, shown an association with tumour Gleason grade [21]. The uncoupling of the correlation between T2 and ADC in tumours supports this finding of added value when DW MRI is used together with T2W imaging for tumour detection. Ultrastructural features of tumours that may contribute to reduced diffusivity but not to T2 include macromolecules such as proteoglycans [22] or glycosaminoglycans [23] in the extracellular matrix.
Reports describing the zonal anatomy of the prostate at 1.5 T [24] distinguished the PZ as a high signal intensity region in the posterior and lateral aspects of the gland surrounding a more heterogeneous short T2 TZ. T2 relaxation of the PZ region is determined by its inherent tissue structure and immediate molecular environment. As in tissues with high water content, such as in cystic or necrotic areas, tissues rich in glands and ducts have a prolonged transverse relaxation compared with cellular areas. T2 values for normal PZ have previously been established where quoted values of 149 ms for normal prostate tissues and 100 ms for tumour at 3.0 T [18] have been reported, which are in keeping with our data. T2 values within the prostate have been shown to correlate with the percentage area of luminal space (which is likely to be responsible for the high values in our cohort) and to correlate negatively with the percentage area of nuclei and the percentage area of cytoplasm on histology [25]. The range of T2 values in the PZ was thus greater than in the TZ. ADC values from non-tumour and tumour ROIs in this study are in keeping with other published literature [9,16]. We included all b-values in our ADC calculation, which will have included a perfusion component. However, in the prostate, the perfusion effect is small and exclusion of b=0 s mm−2 reduces the ADC values in tumour and non-tumour tissue equivalently [26], so that it is unlikely to have affected the result.
The independence of the T2 relaxation from PZFV emphasises the fact that a reduction in PZFV by an enlarging TZ in benign prostatic hyperplasia does not affect T2 relaxation and should not compromise tumour to normal PZ contrast. Although it might be expected that compression of the glandular structure of the normal PZ with its acini and fluid-filled ducts by an enlarged TZ might reduce the overall water content within acinar and ductal spaces and thus the T2, this was not the case in our study. Also, as the TZ enlarges and compresses the PZ, a significant reduction in diffusivity does not occur. The effect of the endorectal coil on compression of the PZ glandular tissue and hence on T2 has not formally been investigated, although, given the data in this study, the use of an endorectal coil is unlikely to cause significant reduction in PZ T2 and compromise tumour to PZ contrast. In a study of 46 patients done with and without an endorectal coil at 3.0 T, the diagnostic performance of T2W imaging was improved in the former because of increased spatial resolution [27].
There are several limitations to this study. In transferring ROIs from T2W images to ADC maps of echo-planar DW sequences, which inevitably showed some geometric distortion, no formal distortion correction process was implemented. Visual matching and manual shifting of pasted ROIs was used to achieve the best possible ROI placement. Secondly, we did not attempt to analyse data from the whole gland but focused instead on a single slice at the level of the verumontanum. This had the advantage of reducing error by excluding anatomically heterogeneous areas at the base of the seminal vesicles and the urethra at the gland apex. More sophisticated segmentation of PZ and TZ ROIs would be necessary to achieve whole-gland quantification. Thirdly, we were unable to include tumours iso- or hyperintense on T2W imaging in our tumour ROIs, but these were a small number of patients in our cohort (12.5% with positive biopsies and no MR visible lesion on T2W images) and are unlikely to have influenced our results. Furthermore, prostatitis, which was identified on histology in 17 of 43 cases and can produce ill-defined, diffuse T2 reduction, would only have been included in a tumour ROI if tumour was also present on histology; if anything, its presence in non-tumour regions would have reduced tumour–PZ contrast and reduced the significance of our findings. Although exclusion of patients with histology of prostatitis from our analysis may well have improved the significance of our findings, it would not have addressed the issue of random histological sampling, so this was not considered as an exclusion criterion. Preliminary data suggest that techniques such as diffusion tensor imaging can aid in distinguishing prostatitis from tumour [28], so inclusion of ADC directionality in future studies could improve the accuracy of tumour delineation. Finally, we did not control the timing of biopsy. In the presence of iron in deoxyhaemoglobin, local magnetic field inhomogeneities cause rapid decay of spins. In our patient population, biopsies were done at least 4 weeks before to reduce this effect. It is our policy to allow at least 4 weeks from any previous prostate biopsy to MR scan to reduce the effects of haemorrhage, which can significantly alter T2. The median time to biopsy in our patient cohort (3 months) exceeded this. However, because the effects of haemorrhage within the prostate sometimes persist for several months [29], we first viewed the T1W scans and excluded cases where haemorrhage was evident.
In summary, the correlation between T2 relaxation and diffusivity that exists in non-tumour prostate regions is absent in tumours supporting the use of DW contrast as an independent contrast mechanism to T2W imaging in prostate cancer detection in the clinic. This raises several important biological questions on the microstructural features of tumours that give rise to DW contrast. In the prostate, where disease can be clinically indolent to aggressive, understanding these microstructural features may be key to developing predictive biomarkers of aggressive disease that are derived from modelling of DW data. In addition, as enlargement of the TZ does not reduce the T2 of the normal PZ, thus compromising contrast between tumour and PZ, detection of tumour in the PZ should not be affected in glands with an enlarged TZ.
Funding
Supported by Cancer Research UK and the Engineering and Physical Sciences Research Council Cancer Imaging Centre in association with the Medical Research Council and Department of Health (CUK C1060/A10334) and National Health Service funding to the National Institute for Health Research Biomedical Research Centre.
References
- 1.Bonekamp D, Jacobs MA, El Khouli R, Stoianovici D, Macura KJ. Advancements in MR imaging of the prostate: from diagnosis to interventions. Radiographics 2011;31:677–703 doi: 10.1148/rg.313105139 [DOI] [PMC free article] [PubMed] [Google Scholar]
- 2.De Visschere P, Oosterlinck W, De Meerleer G, Villeirs G. Clinical and imaging tools in the early diagnosis of prostate cancer, a review. JBR-BTR 2010;93:62–70 [DOI] [PubMed] [Google Scholar]
- 3.Stamey TA, Sozen TS, Yemoto CM, McNeal JE. Classification of localized untreated prostate cancer based on 791 men treated only with radical prostatectomy: common ground for therapeutic trials and TNM subgroups. J Urol 1998;159:2009–12 [DOI] [PubMed] [Google Scholar]
- 4.Morgan VA, Kyriazi S, Ashley SE, DeSouza NM. Evaluation of the potential of diffusion-weighted imaging in prostate cancer detection. Acta Radiol 2007;48:695–703 doi: 10.1080/02841850701349257 [DOI] [PubMed] [Google Scholar]
- 5.Haider MA, van der Kwast TH, Tanguay J, Evans AJ, Hashmi AT, Lockwood G, et al. Combined T2-weighted and diffusion-weighted MRI for localization of prostate cancer. AJR Am J Roentgenol 2007;189:323–8 doi: 10.2214/AJR.07.2211 [DOI] [PubMed] [Google Scholar]
- 6.Kitajima K, Kaji Y, Fukabori Y, Yoshida K, Suganuma N, Sugimura K. Prostate cancer detection with 3 T MRI: comparison of diffusion-weighted imaging and dynamic contrast-enhanced MRI in combination with T2-weighted imaging. J Magn Reson Imaging 2010;31:625–31 doi: 10.1002/jmri.22075 [DOI] [PubMed] [Google Scholar]
- 7.Mazaheri Y, Shukla-Dave A, Hricak H, Fine SW, Zhang J, Inurrigarro G, et al. Prostate cancer: identification with combined diffusion-weighted MR imaging and 3D 1H MR spectroscopic imaging—correlation with pathologic findings. Radiology 2008;246:480–8 doi: 10.1148/radiol.2462070368 [DOI] [PubMed] [Google Scholar]
- 8.Miao H, Fukatsu H, Ishigaki T. Prostate cancer detection with 3-T MRI: comparison of diffusion-weighted and T2-weighted imaging. Eur J Radiol 2007;61:297–302 doi: 10.1016/j.ejrad.2006.10.002 [DOI] [PubMed] [Google Scholar]
- 9.Vargas HA, Akin O, Franiel T, Mazaheri Y, Zheng J, Moskowitz C, et al. Diffusion-weighted endorectal MR imaging at 3 T for prostate cancer: tumour detection and assessment of aggressiveness. Radiology 2011;259:775–84 doi: 10.1148/radiol.11102066 [DOI] [PMC free article] [PubMed] [Google Scholar]
- 10.Underhill HR, Yuan C, Yarnykh VL. Direct quantitative comparison between cross-relaxation imaging and diffusion tensor imaging of the human brain at 3.0 T. Neuroimage 2009;47:1568–78 doi: 10.1016/j.neuroimage.2009.05.075 [DOI] [PubMed] [Google Scholar]
- 11.Walimuni IS, Hasan KM. Atlas-based investigation of human brain tissue microstructural spatial heterogeneity and interplay between transverse relaxation time and radial diffusivity. Neuroimage 2011;57:1402–10 [DOI] [PMC free article] [PubMed] [Google Scholar]
- 12.Lemaire L, Franconi F, Saint-Andre JP, Roullin VG, Jallet P, Le Jeune JJ. High-field quantitative transverse relaxation time, magnetization transfer and apparent water diffusion in experimental rat brain tumour. NMR Biomed 2000;13:116–23 [DOI] [PubMed] [Google Scholar]
- 13.Ababneh ZQ, Ababneh R, Maier SE, Winalski CS, Oshio K, Ababneh AM, et al. On the correlation between T(2) and tissue diffusion coefficients in exercised muscle: quantitative measurements at 3T within the tibialis anterior. MAGMA 2008;21:273–8 doi: 10.1007/s10334-008-0120-8 [DOI] [PubMed] [Google Scholar]
- 14.Morgan VA, Riches SF, Thomas K, Vanas N, Parker C, Giles S, et al. Diffusion-weighted magnetic resonance imaging for monitoring prostate cancer progression in patients managed by active surveillance. Br J Radiol 2011;84:31–7 doi: 10.1259/bjr/14556365 [DOI] [PMC free article] [PubMed] [Google Scholar]
- 15.Sciarra A, Barentsz J, Bjartell A, Eastham J, Hricak H, Panebianco V, et al. Advances in magnetic resonance imaging: how they are changing the management of prostate cancer. Eur Urol 2011;59:962–77 doi: 10.1016/j.eururo.2011.02.034 [DOI] [PubMed] [Google Scholar]
- 16.Rosenkrantz AB, Neil J, Kong X, Melamed J, Babb JS, Taneja SS, et al. Prostate cancer: comparison of 3D T2-weighted with conventional 2D T2-weighted imaging for image quality and tumour detection. AJR Am J Roentgenol 2010;194:446–52 doi: 10.2214/AJR.09.3217 [DOI] [PubMed] [Google Scholar]
- 17.Foltz WD, Chopra S, Chung P, Bayley A, Catton C, Jaffray D, et al. Clinical prostate T2 quantification using magnetization-prepared spiral imaging. Magn Reson Med 2010;64:1155–61 doi: 10.1002/mrm.22492 [DOI] [PubMed] [Google Scholar]
- 18.Liu W, Turkbey B, Senegas J, Remmele S, Xu S, Kruecker J, et al. Accelerated T2 mapping for characterization of prostate cancer. Magn Reson Med 2011;65:1400–6 doi: 10.1002/mrm.22874 [DOI] [PMC free article] [PubMed] [Google Scholar]
- 19.Vos PC, Hambrock T, Barenstz JO, Huisman HJ. Computer-assisted analysis of peripheral zone prostate lesions using T2-weighted and dynamic contrast enhanced T1-weighted MRI. Phys Med Biol 2010;55:1719–34 doi: 10.1088/0031-9155/55/6/012 [DOI] [PubMed] [Google Scholar]
- 20.Chen M, Dang HD, Wang JY, Zhou C, Li SY, Wang WC, et al. Prostate cancer detection: comparison of T2-weighted imaging, diffusion-weighted imaging, proton magnetic resonance spectroscopic imaging, and the three techniques combined. Acta Radiol 2008;49:602–10 [DOI] [PubMed] [Google Scholar]
- 21.Wang L, Mazaheri Y, Zhang J, Ishill NM, Kuroiwa K, Hricak H. Assessment of biologic aggressiveness of prostate cancer: correlation of MR signal intensity with Gleason grade after radical prostatectomy. Radiology 2008;246:168–76 doi: 10.1148/radiol.2461070057 [DOI] [PubMed] [Google Scholar]
- 22.Theocharis AD, Skandalis SS, Tzanakakis GN, Karamanos NK. Proteoglycans in health and disease: novel roles for proteoglycans in malignancy and their pharmacological targeting. FEBS J 2010;277:3904–23 doi: 10.1111/j.1742-4658.2010.07800.x [DOI] [PubMed] [Google Scholar]
- 23.Antoniou J, Demers CN, Beaudoin G, Goswami T, Mwale F, Aebi M, et al. Apparent diffusion coefficient of intervertebral discs related to matrix composition and integrity. Magn Reson Imaging 2004;22:963–72 doi: 10.1016/j.mri.2004.02.011 [DOI] [PubMed] [Google Scholar]
- 24.Sommer FG, McNeal JE, Carrol CL. MR depiction of zonal anatomy of the prostate at 1.5 T. J Comput Assist Tomogr 1986;10:983–9 [DOI] [PubMed] [Google Scholar]
- 25.Langer DL, van der Kwast TH, Evans AJ, Plotkin A, Trachtenberg J, Wilson BC, et al. Prostate tissue composition and MR measurements: investigating the relationships between ADC, T2, K(trans), v(e), and corresponding histologic features. Radiology 2010; 255:485–94 [DOI] [PubMed] [Google Scholar]
- 26.deSouza NM, Riches SF, Vanas NJ, Morgan VA, Ashley SA, Fisher C, et al. Diffusion-weighted magnetic resonance imaging: a potential non-invasive marker of tumour aggressiveness in localized prostate cancer. Clin Radiol 2008;63:774–82 doi: 10.1016/j.crad.2008.02.001 [DOI] [PubMed] [Google Scholar]
- 27.Heijmink SW, Futterer JJ, Hambrock T, Takahashi S, Scheenen TW, Huisman HJ, et al. Prostate cancer: body-array versus endorectal coil MR imaging at 3 T—comparison of image quality, localization, and staging performance. Radiology 2007;244:184–95 doi: 10.1148/radiol.2441060425 [DOI] [PubMed] [Google Scholar]
- 28.Gürses B, Tasdelen N, Yencilek F, Kılıckesmez NO, Alp T, Fırat Z, et al. Diagnostic utility of DTI in prostate cancer. Eur J Radiol 2011;79:172–6 doi: 10.1016/j.ejrad.2010.01.009 [DOI] [PubMed] [Google Scholar]
- 29.Tamada T, Sone T, Jo Y, Yamamoto A, Yamashita T, Egashira N, et al. Prostate cancer: relationships between post biopsy hemorrhage and tumour detectability at MR diagnosis. Radiology 2008;248:531–9 doi: 10.1148/radiol.2482070157 [DOI] [PubMed] [Google Scholar]


