Abstract
Objective:
To evaluate interobserver agreement and determine whether a new MRI grading system agrees with symptoms and neurological signs.
Methods:
We examined 160 patients (72 males and 88 females; mean age 57 years) who underwent MRI of the lumbar spine at our institution and were evaluated by two musculoskeletal radiologists. The presence and grade of central lumbar spinal stenosis (CLSS) at L3–4, L4–5 and L5–S1 were assessed according to a new grading system, the Lee system. The results were correlated with clinical manifestations and neurological examinations [positive neurological manifestation (PNM) and negative neurological manifestation (NNM)]. Statistical analyses were performed using kappa statistics and non-parametric correlation analysis (Spearman’s correlation).
Results:
Interobserver agreement in the grading of CLSS between the two readers was substantial (κ=0.780). Interobserver agreement of the L4–5 level and older age group was high (0.789, 0.814). The correlation coefficient (R) of Reader 1 between MRI Grades 0, 1, 2 or 3 and neurological manifestations (negative or positive) was 0.654; the R of Reader 2 was 0.591. In the younger age group (<57 years), the R of Reader 1 was 0.634 and the R of Reader 2 was 0.500. In the older age group (≥57 years), the R of Reader 1 was 0.650 and the R of Reader 2 was 0.645. Correlation coefficients were higher at the L3–4 level (0.612–0.678) than at other levels but did not show statistical significance (p>0.05).
Conclusion:
Interobserver agreement for the new CLSS grading system was substantial. Grade 0 was associated with NNMs and Grade 3 with PNMs in this cohort. Grade 2 demonstrates more cases of PNM than NNM but requires further evaluation. Correlations between MRI grades and clinical manifestations were moderate and slightly higher in older patients.
Advances in knowledge:
The new practical MRI grading method can be useful in the categorisation of CLSS and shows strong clinical correlation.
Central lumbar spinal stenosis (CLSS) is an important pathological entity to recognise in patients with neurological intermittent claudication, radicular pain and sensory and motor disturbances in the lower extremities [1]. A prior study on CLSS suggested that encroachment of cauda equina nerve roots is the primary cause of symptoms and signs [2]. MRI is used in the evaluation of patients with symptoms related to CLSS. However, there are no widely used diagnostic criteria or grading systems for CLSS using MRI. Ogikudo et al [2] demonstrated close relationships between cross-sectional area of the dural sac and symptoms. In contrast, another study reported that the reduction of the dural sac area was not correlated with clinical symptoms, which had been subjectively graded [3]. Schizas et al [4] evaluated qualitative grading of CLSS severity based on the morphology of the dural sac and clinical symptoms and suggested seven grades of evaluation. However, this grading system can be time-consuming and has not come into widespread clinical practice. In 2011 Lee et al [5] reported a new MRI grading system for CLSS. They classified CLSS into four grades according to cauda equina shape based on T2 weighted axial images and suggested that this new grading system provides a reliable assessment of CLSS. The purpose of this study was to evaluate interobserver agreement and to determine whether the new MRI grading system for CLSS is correlated with symptoms and neurological signs. We also evaluated the clinical significance for each grade.
METHODS AND MATERIALS
Case selection
Our study sample included 72 (45%) males and 88 (55%) females who visited our institution and underwent MRI of the lumbar spine between January 2010 and September 2010. The age distribution was 85 cases younger than 57 years (53%) and 75 cases (47%) older than 57 years. The mean age was 57 years. Inclusion criteria were single-level CLSS and no CLSS from L3–4 to L5–S1. Multilevel stenosis was excluded from the study because the exact evaluation of the correlation between stenosis grade of each level and clinical manifestation was difficult. Other exclusion criteria were infection, tumour, acute trauma, previous surgical history, neural foraminal stenosis, combined brain infarction or other intracranial lesion and peripheral neuropathy. Patients with symptoms at other cord levels were excluded. This retrospective study was approved by the institutional ethics review board, and the requirement for informed consent was waived because of the retrospective study design.
Image analysis
MRI examinations were interpreted by two fellowship-trained, academic musculoskeletal radiologists, one with 12 years and one with 10 years of experience. They were blinded to clinical information and radiological reports. A total of 160 patients were qualitatively analysed from L3–4 to L5–S1. Radiologists assessed the presence and grade of CLSS at the stenosis point according to the new grading system suggested by Lee et al [5]. We named this grading system the Lee system. CLSS was divided into four grades according to the degree of separation of the cauda equina on T2 weighted axial images: Grade 0, no CLSS as the anterior cerebrospinal fluid (CSF) space is not obliterated; Grade 1, mild CLSS in which the anterior CSF space is mildly obliterated, but the cauda equina can be clearly separated; Grade 2, moderate CLSS in which the anterior CSF space is moderately obliterated, and the cauda equina is partially aggregated; and Grade 3, severe CLSS in which the anterior CSF space is obliterated so severely as to show marked compression of the dural sac, and the cauda equina cannot be visually separated, appearing instead as a bundle (Figures 1–5).
Figure 1.
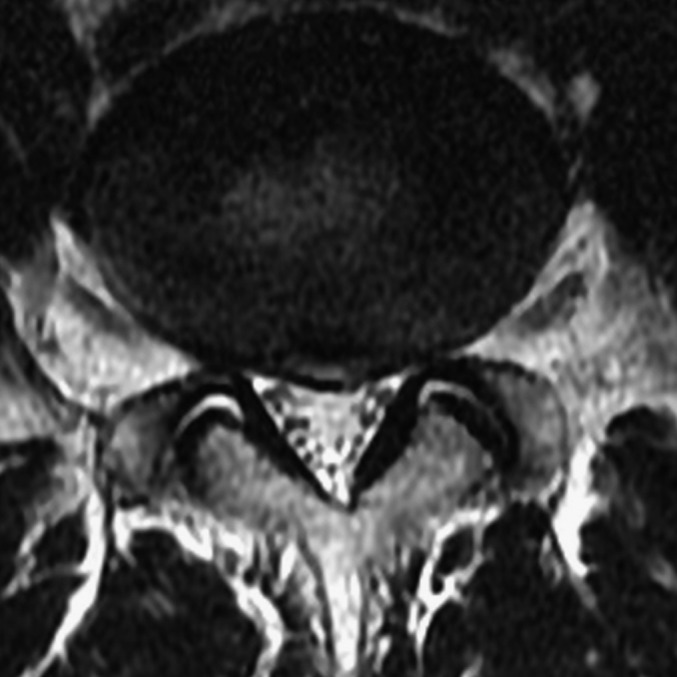
Grade 1: a 49-year-old male with radiating pain in the right lower extremity. Axial T2 weighted turbo spin echo image (repetition time/echo time 3000/100 ms) of the L4–5 disc shows mild canal stenosis and clear separation of the cauda equina, which is classified as Grade 1. The patient had positive neurological manifestations.
Figure 5.
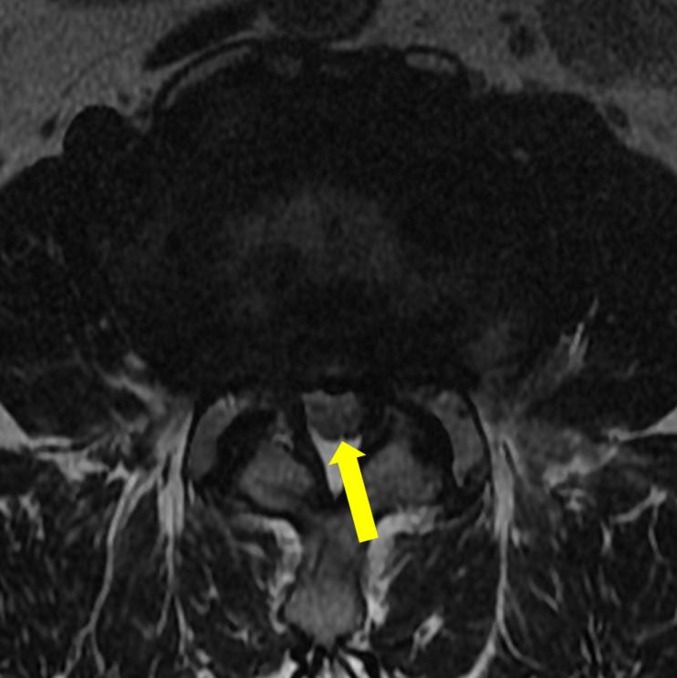
Grade 3: a 67-year-old male with lower back pain. Axial T2 weighted turbo spin echo image (repetition time/echo time 3000/100 ms) of the L3–4 disc shows severe canal stenosis. The entire cauda equina aggregates, demonstrating a bundle-like appearance (arrow), which is classified as Grade 3. The patient had positive neurological manifestations.
Figure 2.
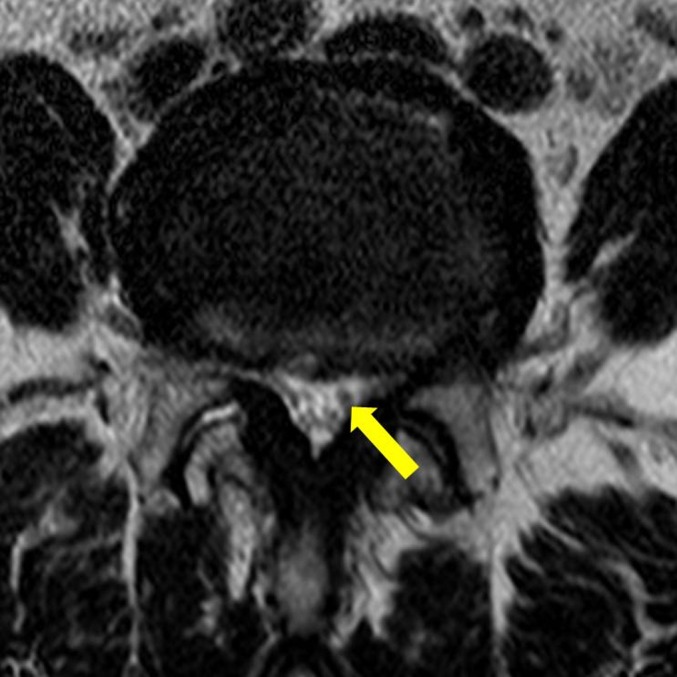
Grade 2: a 79-year-old female with weakness in the lower extremities. Axial T2 weighted turbo spin echo image (repetition time/echo time 3500/120 ms) of the L4–5 disc shows moderate canal stenosis. Some cauda equina aggregates (arrow) are seen, which is classified as Grade 2. The patient had positive neurological manifestations.
Figure 3.
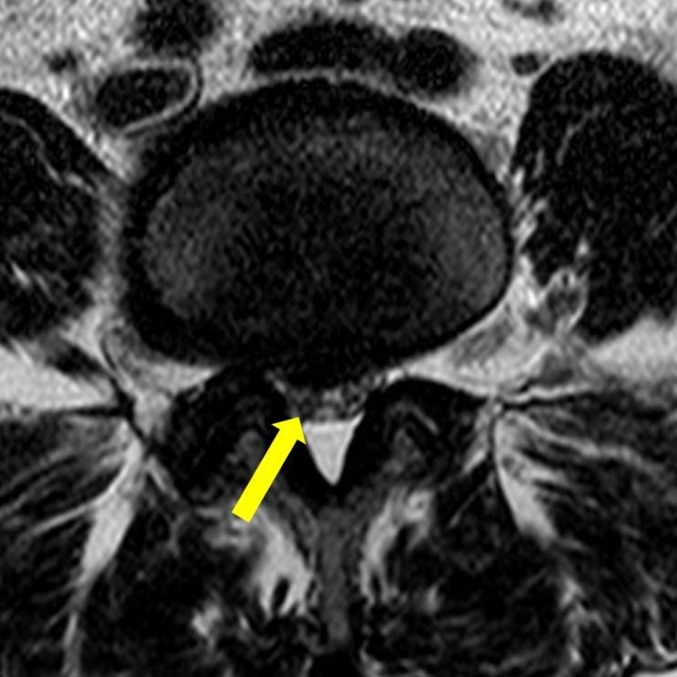
Grade 2: a 71-year-old female with pain in right lower extremity. Axial T2 weighted turbo spin echo image (repetition time/echo time 3200/120 ms) of the L4–5 disc shows moderate canal stenosis. Some cauda equina aggregates (arrow) are seen, which is classified as Grade 2. The patient had negative neurological manifestations.
Figure 4.
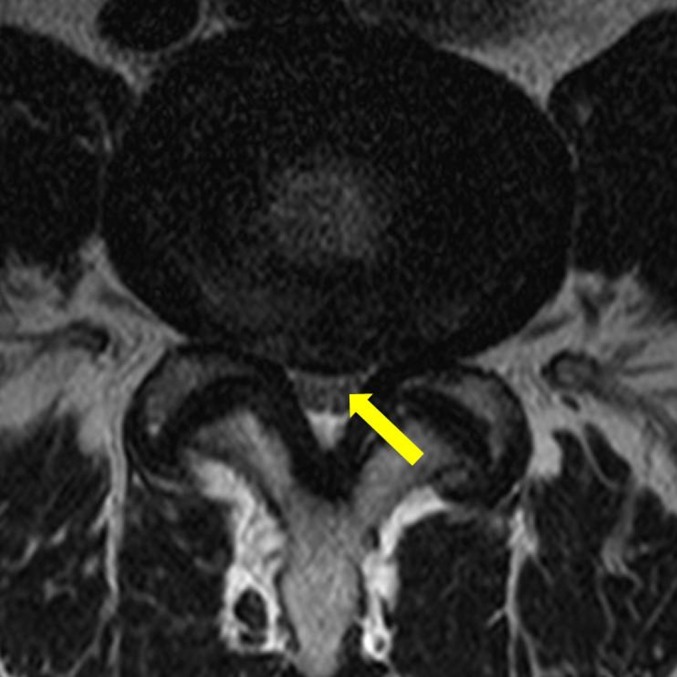
Grade 2: a 44-year-old female with back pain. Axial T2 weighted turbo spin echo image (repetition time/echo time 3070/120 ms) of the L4–5 disc shows moderate canal stenosis. Some cauda equina aggregates (arrow) are seen, which is classified as Grade 2. The patient had positive neurological manifestations.
Clinical correlations
Neurological examinations and clinical manifestations were performed and acquired by the same physician just before the MR examination. We considered neurological clinical manifestations as observed: paraesthesia, extremity weakness, numbness, claudication and radicular pain. Positive neurological signs increased the response of the deep tendon reflex (DTR) and positive denervation sign on electromyography (EMG). DTR evaluations were performed in all cases, and EMG was performed in five cases. More than one positive neurological sign combined with more than one neurological clinical manifestation was considered as a positive neurological manifestation (PNM) of CLSS. Upper extremity symptoms were not considered to be PNM.
MRI parameters
All MRI examinations were performed using the same protocol with a 1.5 T magnet (Intera; Philips Medical Systems, Best, Netherlands) using a syn-spine coil and fast spin echo imaging. T1 and T2 weighted images were obtained in the axial plane, and T1 and T2 weighted images and T2 short tau inversion–recovery (STIR) images were obtained in the sagittal plane in the supine position. A field of view (FOV) of 32 cm, matrix 512×256 and slice thickness of 4 mm were used for sagittal views and a FOV of 15 cm, matrix 256×320 and slice thickness of 4 mm were used for axial images. MRI sequences were sagittal T1 weighted spin echo [repetition time (ms)/echo time (ms) 500–600/12–17], T2 STIR (2500/60), T2 weighted image (3500/120), axial T2 weighted turbo spin echo (3000–4000/60–150) and T1 weighted turbo spin echo (600–700/10–15).
Statistical analysis
Interobserver agreement between the two radiologists was analysed for grading of CLSS using kappa statistics. Kappa value interpretations were poor (κ<0.1), slight (0.1≤κ≤0.2), fair (0.2<κ≤0.4), moderate (0.4<κ≤0.6), substantial (0.6<κ≤0.8) and almost perfect (0.8<κ≤1.0). Correlation coefficients (R) were calculated by non-parametric correlation analysis (Spearman’s correlation). For analyses of the relationships between findings and patient characteristics, the association of MRI findings and clinical manifestations was evaluated by level (L3–4, L4–5 and L5–S1) and age (≥57 years and <57 years). R between 0.5 and 0.7 was considered as moderate correlation, between 0.7 and 0.9 was considered as relatively high correlation and >0.9 was considered as very high correlation. With neurological manifestation used as the standard of reference, the sensitivity and specificity of 95% confidence intervals of Grades 2 and 3 stenosis were calculated. The level of correlation significance was 0.01. Statistical analyses were performed using SPSS®, v. 10.1 (SPSS Inc., Chicago, IL).
RESULTS
The observations of Readers 1 and 2 are shown in Table 1. The incidences of the central stenosis of each level from Grades 1 to 3 were as follows: 20 cases in L3–4, 86 cases in L4–5 and 25 cases in L5–S1. Interobserver agreement in the grading of CLSS between the two readers was substantial (κ-value=0.780). Interobserver agreements of each level were as follows: L3–4, 0.462; L4–5, 0.789; and L5–S1, 0.533 (Table 2). There was no disagreement in the grading of Grade 0 stenosis. Interobserver agreement of the older age group (≥57 years) was higher (0.814) than that (0.718) of the younger age group (<57 years; Table 2). We found PNMs in 80 patients, with negative findings for 80 patients (Table 3). For Reader 1, no PNM patients were noted in 30 patients with Grade 0, 47 negative neurological manifestation (NNM) patients and 28 PNM patients were noted in 75 patients with Grade 1, only 1 NNM patient was noted in 27 patients with Grade 2 and 2 NNM patients were noted in 28 patients with Grade 3. For Reader 2, 5 NNM patients were noted in 33 patients with Grade 2 and only 1 NNM patient was noted in 21 patients with Grade 3. The R of Reader 1 between MRI grades (0, 1, 2 or 3) and neurological manifestations (negative or positive) was 0.654 (Table 4); the R of Reader 2 was 0.591. In the younger age group (<57 years), the R of Reader 1 was 0.634 and the R of Reader 2 was 0.500. In the older age group (≥57 years), the R of Reader 1 was 0.650 and the R of Reader 2 was 0.645. The correlation coefficients of each level are shown in Table 5. Correlation coefficients were higher at the level of L3–4 (0.612–0.678) than at other levels but did not show statistical significance (p>0.05). The sensitivities and specificities of Grades 2 and 3 stenosis for identifying PNM were 70%/96% (Reader 1) and 66%/91% (Reader 2), respectively.
Table 1.
Prevalences of grades for the Lee system
| Observer | Grade 0 (%) | Grade 1 (%) | Grade 2 (%) | Grade 3 (%) | Total (%) |
| Reader 1 | 30 (19) | 75 (47) | 27 (17) | 28 (18) | 160 (100) |
| Reader 2 | 30 (19) | 76 (48) | 33 (21) | 21 (13) | 160 (100) |
The percentage values in parentheses were rounded up.
Table 2.
Interobserver reliabilities and kappa values
| Value | L3–4 | L4–5 | L5–S1 | <57 years | ≥57 years | Total |
| κ | 0.462 | 0.789 | 0.533 | 0.718 | 0.814 | 0.780 |
| p-value | 0.004 | 0.001 | 0.005 | 0.001 | 0.001 | 0.001 |
κ, kappa value: poor (κ<0.1), slight (0.1≤κ≤0.2), fair (0.2<κ≤0.4), moderate (0.4<κ≤0.6), substantial (0.6<κ≤0.8) and almost perfect (0.8<κ≤1).
Table 3.
Correlation between grades and neurological manifestations according to readers
| Observer | Grade 0 (%) | Grade 1 (%) | Grade 2 (%) | Grade 3 (%) | Total (%) | |
| Reader 1 | Prevalence | 30 (19) | 75 (47) | 27 (17) | 28 (18) | 160 (100) |
| PNM | 0 (0) | 28 (34) | 26 (33) | 26 (33) | 80 (100) | |
| Reader 2 | Prevalence | 30 (19) | 76 (48) | 33 (21) | 21 (13) | 160 (100) |
| PNM | 0 (0) | 32 (40) | 28 (35) | 20 (25) | 80 (100) |
PNM, positive neurological manifestation.
The percentage values in parentheses were rounded up.
Table 4.
Correlation coefficients of central lumbar spinal stenosis between MRI grades and neurological manifestations
| Observer | Total (p-value) | <57 years old (p-value) | ≥57 years old (p-value) |
| Reader 1 | 0.654 (<0.001) | 0.634 (<0.001) | 0.650 (<0.001) |
| Reader 2 | 0.591 (<0.001) | 0.500 (<0.001) | 0.645 (<0.001) |
Table 5.
Correlation coefficients of each spinal level between MRI grades and neurological manifestations
| Observer | L3–4 (p-value) | L4–5 (p-value) | L5–S1 (p-value) |
| Reader 1 | 0.678 (<0.001) | 0.547 (<0.001) | 0.438 (<0.001) |
| Reader 2 | 0.612 (<0.001) | 0.467 (<0.001) | 0.329 (<0.001) |
DISCUSSION
Many prior reports have evaluated the relationships between radiological parameters and clinical manifestations or outcomes, but radiological findings alone cannot predict clinical severity and outcomes [5]. Jönsson et al [6] reported that the degree of constriction of the spinal canal considered to be symptomatic for CLSS is not clear. Amudsen et al [7] reported no relationship between the degree of stenosis (measured on myelography and CT) and clinical symptoms in 100 patients selected from a neurology department on the basis of CLSS clinical symptoms. Lohman et al [3] found no relationship between canal cross-sectional area measured on CT and clinical symptoms. In 2011, Lee et al [5] reported a new MRI grading system for CLSS. They classified CLSS into four grades according to cauda equina shape based on T2 weighted axial images. The main differences from previous classification are that the new grading system focuses on the shape of the cauda equina. Grades 2 and 3 are based on the aggregation of the cauda equina. Ogikubo et al [2] reported that encroachment of the cauda equina with its nerve roots is the primary cause of symptoms, and signs and direct obstruction of blood flow to the cauda equina through encroachment can result in clinical manifestations. Lee et al [5] suggested that this new grading system provides a reliable assessment of CLSS, with interobserver agreement for four grades ranging from 0.730 to 0.953 (intraclass correlation coefficient reliability). In the current study, interobserver agreement for the new grading system was similar (κ=0.780). Highest agreement was found at the level of L4–5 (κ=0.789), and agreement for the older age group (≥57 years) was slightly higher (0.814 vs 0.718) than that for the younger age group (<57 years). We attribute the highest agreement at L4–5 to the fact that the incidences of the stenosis (Grade 1–3) were highest at that level. We also correlated the new grading system with clinical manifestations and neurological signs. No Grade 0 patients had PNM, and only one or two patients with Grade 3 had NNMs. Grade 0 was associated with NNMs and Grade 3 with PNMs in this cohort. The clinical significance of Grade 1 CLSS is controversial. The number of NNM cases with Grade 2 was 1 (3%) for Reader 1 and 5 (15%) for Reader 2. The R values of the readers for the younger group of patients differed (0.634 and 0.500, respectively), but the R values for the older age group of patients were similar (0.650 and 0.645, respectively). We found that interobserver agreement and clinical correlation were more accurate in the older group. A previous study [3] reported that there was a significant correlation between the change in the dural sac cross-sectional area at the L4–5 level and the severity of pain radiating to the leg while no positive correlation was found at the L3–4 and L5–S1 levels. Nevertheless, the L3–4 level showed the highest correlation, and the L5–S1 level showed the lowest correlation coefficient in this study. This difference may have resulted from the fact that we adapted a different grading method and that we did not observe any Grade 3 lesions and found only three or four cases of Grade 2 lesions at the L5–S1 level.
One limitation of this study was the single posture of the lumbar spine MRI that was evaluated, as lumbar spine posture affects the dimensions of the spinal canal. Schönstrom et al [8] reported that extension of the lumbar spine exacerbates encroachment of the cauda equina and induces symptoms. In our study, all spines were in the neutral, supine position, and no flexion or extension was applied. Another limitation was that the study was not based on a quantitative evaluation of clinical manifestations. We classified clinical results as either positive or negative, so dependent variables were unordered qualitative variables. Nonetheless, the purpose of this study was to evaluate the clinical effectiveness of the new grading system, because differentiation of the CLSS in symptomatic and asymptomatic conditions might be valuable. The third limitation was that most patients had some symptoms or discomfort. A true healthy control group was not established. The fourth limitation was that multilevel stenosis cases were excluded from the study. The fifth limitation was that we included only 5 cases of EMG study of 160 patients, so its inclusion as a neurological end point is dubious.
In conclusion, interobserver agreement for the new grading system of CLSS was substantial. Grade 0 is associated with NNMs and Grade 3 with PNMs. Grade 2 shows more cases of PNM than NNM but requires further evaluation. The clinical significance of Grade 1 is controversial. The correlation between MRI grade and clinical manifestations was moderate and slightly higher in the older age group of patients.
REFERENCES
- 1.Verbiest H. A radicular syndrome from developmental narrowing of the lumbar vertebral canal. 1954. Clin Orthop Relat Res 2001;384:3–9 [DOI] [PubMed] [Google Scholar]
- 2.Ogikubo O, Forsberg L, Hansson T. The relationship between the cross-sectional area of the cauda equina and the preoperative symptoms in central lumbar spinal stenosis. Spine 2007;32:1423–8 doi: 10.1097/BRS.0b013e318060a5f5 [DOI] [PubMed] [Google Scholar]
- 3.Lohman CM, Tallroth K, Kettunen JA, Lindgren KA. Comparison of radiologic signs and clinical symptoms of spinal stenosis. Spine 2006;31:1834–40 doi: 10.1097/01.brs.0000227370.65573.ac [DOI] [PubMed] [Google Scholar]
- 4.Schizas C, Theumann N, Burn A, Tansey R, Wardlaw D, Smith FW, et al. Qualitative grading of severity of lumbar spinal stenosis based on the morphology of the dural sac on magnetic resonance images. Spine 2010;35:1919–24 doi: 10.1097/BRS.0b013e3181d359bd [DOI] [PubMed] [Google Scholar]
- 5.Lee GY, Lee JW, Choi HS, Oh KJ, Kang HS. A new grading system of lumbar central canal stenosis on MRI: an easy and reliable method. Skeletal Radiol 2011;40:1033–9 doi: 10.1007/s00256-011-1102-x [DOI] [PubMed] [Google Scholar]
- 6.Jönsson B, Annertz M, Sjöberg C, Strömqvist B. A prospective and consecutive study of surgically treated lumbar spinal stenosis. Part I. Clinical features related to radiographic findings. Spine 1997;22:2932–7 [DOI] [PubMed] [Google Scholar]
- 7.Amudsen T, Weber H, Lilleas F, Nordal HJ, Abdelnoor M, Magnaes B. Lumbar spinal stenosis: clinical and radiographic features. Spine 1995;20:1178–86 [DOI] [PubMed] [Google Scholar]
- 8.Schönstrom N, Lindahl S, Willén J, Hansson T. Dynamic changes in the dimensions of the lumbar spinal canal: an experimental study in vitro. J Orthop Res 1989;7:115–21 doi: 10.1002/jor.1100070116 [DOI] [PubMed] [Google Scholar]


