

Abstract
Molecular interactions are at the origin of life. How molecules get at different locations in the cell and how they locate their partners is a major and partially unresolved question in biology that is paramount to signaling. Spatio-temporal correlations of fluctuating fluorescently tagged molecules reveal how they move, interact and bind in the different cellular compartments. Methods based on fluctuations represent a remarkable technical advancement in biological imaging. Here we discuss image analysis methods based on spatial and temporal correlation of fluctuations, Raster Image Correlation Spectroscopy (RICS), Number and & Brightness (N&B) and spatial cross-correlations that give us information about how individual molecules move in cells and interact with partners at the single molecule level. These methods can be implemented with a standard laser scanning microscope and produce a cellular level spatio-temporal map of molecular interactions.
Why image correlation spectroscopy?
Our knowledge of complex molecular reactions occurring in the live-cell interior is dramatically improving and as a consequence researchers are asking questions about the distribution, transport and aggregation of molecules. Standard microscopy methods that detect the location of specific molecules have contributed to our understanding of the compartmentalization of reactions and to the overall architecture of the cell interior. However, the description of interactions and transport at the molecular level in the cell has just begun. The prospect is to be able to have a spatial and temporal description of signaling reactions so that feed back circuits can be identified and their spatial and temporal regulation better understood. The spatio-temporal dynamics, correlations among biomolecules and detections of chemical gradients in cells is perhaps the next frontier.
During the past 30 years, methods based on FRAP (Fluorescence recovery after photobleaching) were introduced to distinguish between mobile and immobile molecules in cells [1,2]. FRAP measures the change in concentration of fluorescent molecules in a given region of the cell after the concentration has been perturbed by the photobleaching beam. As our knowledge of signaling and spatial distribution of biomolecules in cells is improving the limitation of the information that FRAP can provided has become apparent. In contrast, single particle tracking (SPT) has the capability to follow isolated molecules as they move in the cell [3]. SPT is done with bright isolated particles and mainly on cell membranes. Generally SPT is difficult to use when the motion is in 3 dimensions as it is in many biological processes and cannot be used when there are many molecules in the volume of illumination. Building the statistics and the spatial distribution by measuring one particle at a time, as done in SPT, requires extended statistics, although the details of trajectories obtained in the SPT experiment have exceptional spatial and temporal resolution. New methods in confocal microscopy have evolved to reveal spatial and temporal information executing a top down strategy to quantify where and when molecules interact. In contrast to the FRAP and SPT methods, maps of complex interactions of molecules are now quantified for the first time in live cells using image correlation spectroscopy [4–11].
It is becoming clear that the motion of isolated molecules in the presence of other molecules in the excitation volume can be detected by fluctuation correlation spectroscopy [12]. In addition, fluctuation spectroscopy can distinguish the formation of complexes using different colors based on cross-correlation of the fluctuations or by brightness analysis using the same type of molecules [6,9,13–18]. More importantly, by measuring the time (delayed) cross-correlation between different points in the cell we can follow a molecule as it moves in the cell in 3D in the presence of many other molecules of the same kind. As the molecule moves, it could reveal the existence of barriers to motion or regions of the cell of slower (or faster motion) providing an unprecedented detailed map of the transport of molecules in the cell interior.
Single-point FCS, RICS and the pair correlation approach
Here we describe the principle of fluctuation correlation methods and we point out the major advances in the field during the last 5 years using image correlations and the progress these advances could bring to the overall description of molecular interactions and flow in cells. We emphasize the single-molecule sensitivity of the fluctuation spectroscopy method.
If we illuminate a small volume where there are few fluorescent molecules, the measured fluorescence intensity changes if the molecules diffuse in and out of this volume. The duration of the fluctuation depends on the time one molecule resides in the volume of illumination. This consideration is important because is telling us that the (fast) fluctuations in fluorescence intensity are due to the passage of single molecules in the volume of illumination. Given concentrations of macromolecules generally found in cells (in the range 1 nM to 1 μM), the volume must be on the order of 0.1 fL to have few molecules in this volume. In such a small volume, molecules will reside for a small time (in the sub-millisecond range) if they are allowed to diffuse. Therefore a requisite to measure fluorescence fluctuations due to molecular diffusion is to illuminate a very small volume and to sample the fluorescence intensity very fast. This temporal and spatial dimension (of the volume) can be reached using confocal detection or multiphoton excitation. For example a confocal microscope can provide a small volume of excitation (approximately 0.2fL) and using photomultiplier detectors or other fast detectors we can sample to fluorescence fast enough (in the sub microsecond range). Conventional wide field epifluorescence with camera detectors cannot provide the small volume needed for fluctuation spectroscopy. However, in the TIRF microscopy (total internal reflection fluorescence) if molecules diffuse slowly such as membrane bound proteins then the proper volume and time scale could be obtained [19]. Also camera detectors can be used in the multiple pinhole configuration achievable by stopping the rotation in the spinning disk microscope [20] and more recently using SPIM-microscopy [21]. This technique has the potential to measure the dynamics of molecules in the entire inage and at high frame rate, although the pixel time resolution is limited to the ms. There are many example in which this speed is adequate to detect dynamics due to molecular diffusion and aggregation in live cells. [22]
Fluctuation correlation spectroscopy was originally developed as a single-point measurement in which the small volume of illumination was obtained using a confocal arrangement and the fluorescence signal was measured using a fast photomultiplier (or avalanche photodiode) detectors [23–26]. In this case, the fluorescence fluctuations are due to the transit of molecules across the volume of illumination due to spontaneous diffusion (Figure 1A). There are many examples of single point fluorescence fluctuation measurements in cells (For a review see [27,28]). However, in a cell, the rate of diffusion could vary from point to point and the state of aggregation could also be dependent of the cell location.
Figure 1.
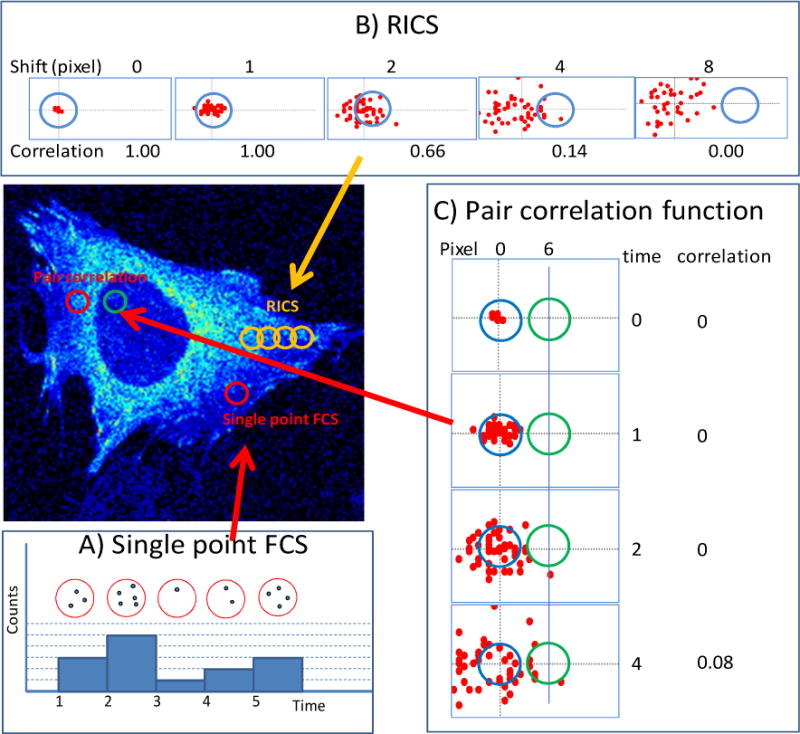
Schematic illustration of fluorescence fluctuation experiments. In the figure a volume of illumination (PSF) is shown as a colored circle. In reality, a PSF represents a diffraction limited spot the size of 200–300nm and it extends in 3D. The sampling time per pixel is generally on the order of 1 to 10us . (A) Single point FCS. A single point in the cell is illuminated with a diffraction limited spot. The fluorescence intensity is recorded at the same position as a function of time using a fast detector. The fluorescence fluctuations are correlated using the mathematics of the correlation functions. Only the same molecule entering and leaving the volume of illumination will give a correlated (in time) fluctuation and contribute to the correlation function. The motion of many molecules is not correlate each other so that the overall contribution to the correlation function will be null (B) RICS. In the confocal microscope the intensity is collected in sequence of neighbor pixels. As the molecules move and the pixel position is changed, only these molecules that can move fast enough will be observed at a distant pixel of the same image frame. In the figure, the red dots represent molecules diffusing in a plane. As a function of time, molecules spread from the initial position. The RICS correlation function is proportional to the product of the number of molecules in the pixel sequence. For example, if 50 molecules were at the center of the original pixel at time zero, as the scanner moves the excitation volume by a small quantity we still get approximately 50 molecules at the next pixel. However, as the raster scan proceeds, fewer molecules that were at the original pixel position can be found in position 4 or 8 in the figure. Remember that only the same molecule give a net positive correlation. (C) Pair correlation function. The fluctuations at two distant pixels (6 pixels apart in the schematic figure indicated in red and in blue) are measured and the correlation function of the fluctuations is calculated at these two pixels at different delay times. At very short delay time, molecules that were originally in the red pixel, cannot reach the blue pixel. As the time proceeds, a molecule originally at the red pixel can reach the blue pixel, producing a net positive delayed correlation as illustrated in the figure for the time delay of 4. Clearly, if the two pixels are at the same location, the pair correlation function is the same thing as the single point FCS.
The single point FCS does not address the question about the spatial extent of single molecule motion. In a cell we could have diffusion barriers and other obstacles. Weakly binding scaffolds can locally change the concentration and determine the long range transport of molecules. For example, diffusion has a specific spatial distribution due to the probability of finding a particle at a different location if the particle was at a given location in a previous time. The deformation of this spatial probability carries information about local barriers or local interactions of the molecule with the surroundings. Therefore spatiotemporal correlations have the potential to reveal “spatial structures” that otherwise will not be noticed (Figure 2).
Figure 2.
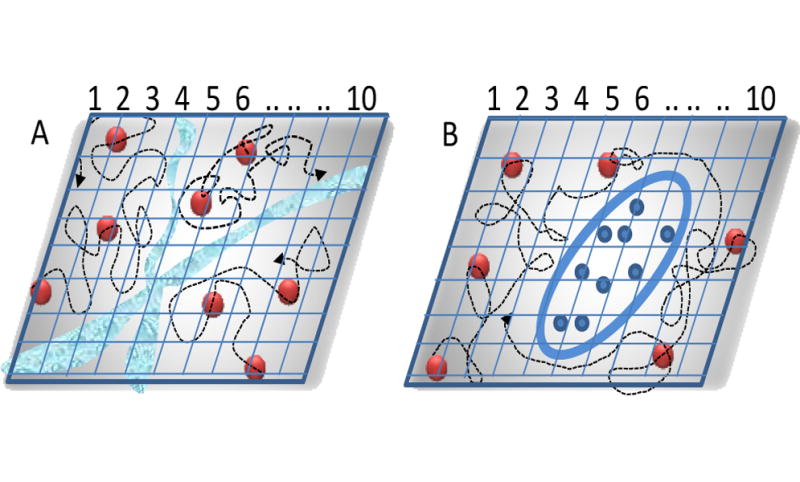
Schematic representation of the pair correlation approach. A) The correlations at two distinct points are cross correlated. If there is a diffusion barrier like in A) points in the region indicated by 1,2 and 3 cannot correlate with points in the region indicated by 5, 6. B) if there is an obstacle, particles can go around. Cross-correlation is possible at all location (except in the obstacle) but there will be a time delay in the correlation due to the longer path the molecules have to take to go around the obstacle.
Given the requirements of fluctuation spectroscopy (small volume of excitation and fast sampling), it is obvious that microscopy methods such as the raster scanning in the common confocal laser scanning microscope could be ideal for providing both the spatial and the temporal range adequate for observing diffusion and binding in cells. The RICS (Raster Scan Image Correlation Spectroscopy) [4,7,29] approach was developed precisely to exploit the spatial correlation of diffusion so that diffusion could be measured in every region of a cell (Figure 1B). In the RICS method we correlate in time and space the fluctuations at neighbor pixels of the raster scan image so that molecules diffusing can be “seen” as they move. The math behind the RICS method has been described in several papers [4,7,29].
The RICS technique was conceived to be sensitive to the local correlation due to diffusion. RICS does not respond to the question related to motion of molecules at larger distances. To approach this more “global” transport problem we need to correlate fluctuations occurring at distant pixels and at the appropriate time delay (Figure 1C). This is done using the pair correlation function method (pCF) in which two pixels are chosen at two locations and the time delayed cross-correlation of the fluorescence fluctuations is calculated at these two pixels [12]. Of course, the operation is done simultaneously on many pixels of an image to obtain a better description of the large scale molecular flow.
Measuring molecular aggregation in live cells
The detection and quantification of molecular motion does not provide information about molecular complexes. There are various methods based on fluctuation analysis that are used to detect the formation of complexes and their location [30–32]. Here we discuss the Number and Molecular Brightness (N&B) method based on the size of the amplitude of fluctuations taken from confocal imaging [33,34]. It is well understood that colocalization of two proteins in a pixel of the size of hundred of nanometer is not sufficient to establish that the two molecules are forming a complex. If the molecules carrying the two colors of fluorescence move together, this is considered evidence that they must reside on the same complex. The cross-correlation of the intensity fluctuations is used to determine if this is the case [13,35,36]. However, this approach works only if the two molecules are labeled with different colors. If we have more than one molecule of the same color in the complex we use the size of the fluorescence fluctuation to determine the number of equal molecules in the complex.
Examples of dynamics in cells revealed by image correlation methods
In the following we present example from published data to illustrate the kind of information that can be extracted using the image correlation methods described in this essay. In the first the formation of complexes between paxillin and its activator FAK is shown to occur only at focal adhesion. No preexisting complexes are found in the cytoplasm. In the second example we characterize the size of Hungtintin oligomers in live cells. We show that relatively small oligomers are found before the formation of inclusions. When the inclusions form, they recruit most of the protein in the cell leaving only monomers. In the third example we show that the diffusion of a small (EGFP) in and around the chromatin is impeded by diffusion barriers, providing further evidence that diffusion of molecules is regulated in the nucleus.
Example of protein diffusing and interacting in cells: FAK and paxillin only interact at focal adhesions
Here we show RICS measurements of diffusion and cross-correlation done with the aim of revealing formation of molecular complexes in cells [6] (The figure and excerpt in this section are reproduced with permission from Biophysical Journal). There is ample evidence that FAK activate paxillin and the two proteins co-precipitate in cell lysates. An outstanding question is if the two proteins form complexes before migrating to the focal adhesions. Figures 4 shows the images of a mouse embryo fibroblast, expressing FAK-EGFP (green channel) and paxillin-mCherry (red channel) whose fluorescence is captured in the two different channels These two proteins co-localize everywhere in the cell as shown by comparing the images in the two channels (Figure 4a,b and the superposition of a and b in c). The RICS analysis shows that both proteins are freely diffusing in the cytoplasm (Figure 4d and e).
Figure 4.
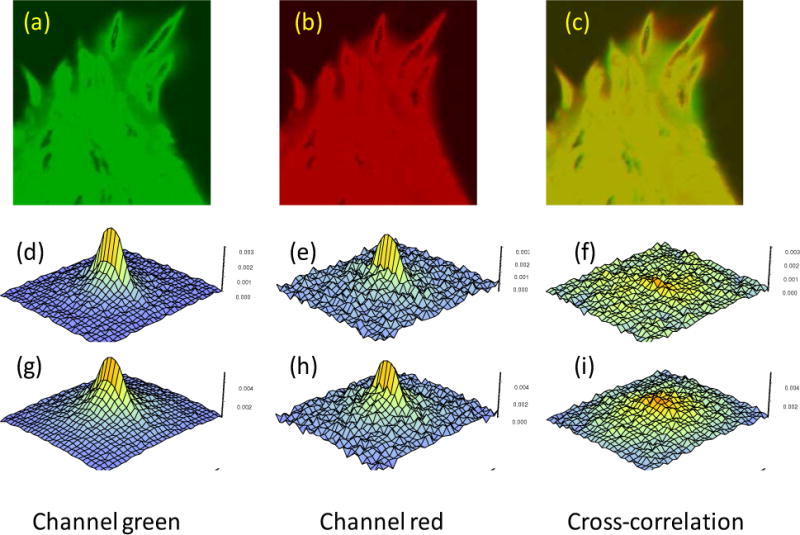
Panel a), b) and c) show intensity images of a cell expressing FAK-EGFP and paxillin-mCherry in the green and red channels and the RGB composition of the green and red channels. The size of the image is 20.5 μm square (or 0.08 μm/pixel) Panels d), e) and f) are the RICS auto (channel 1 and 2) and cross correlation signal using a moving average of 10 s to remove the quasi-immobile components. The correlation function is calculated using a region of 32 pixels (2.56μm). Panels g), h) and i) are the RICS functions obtained using a moving average of 40 s. Images obtained with an Olympus FV1000 microscope. The instrument setup is described in [6].
The presence of RICS autocorrelation for each of the individual channels shows that both FAK and paxillin are rapidly diffusing in the cytoplasm. The characteristic elongated shape of the RICS function along the fast scan axis (Figures 4) shows that the molecules are moving fast relative to the line scanning time, which is about 7.5 ms for these experiments. Interestingly, the RICS cross-correlation is relatively small for these two proteins. Also we were unable to observe FRET between the two proteins. Thus despite the co-localization and their co-immunoprecipitation, there is no direct evidence suggesting that they interact in cells. The first row of RICS functions (Figure 4, panels d–f) were obtained with a high pass filter (moving average of 10s), i.e., all processes from microseconds to about 10 seconds are present in the RICS function.
The amplitude of the ccRICS function (Figure 4f), using the 10s moving average, is much less than that for the autocorrelation (Figure 4d). This small ccRICS signal likely corresponds to a small amount of spectral bleedthrough. However, when the moving average was set to 40s (Figure 4i), the amplitude of the ccRICS increased substantially revealing molecular interaction. For the data analyzed with the moving average of 40s, the shape of the RICS function is round, rather than elongated, and it has the size of the point spread function (PSF). This reveals that the correlated movements of the two proteins at this (slower) time scale are due to localized binding-unbinding rather than diffusion.
While the above analyses were obtained by averaging the spatial correlations over the entire frame, the RICS analysis can also reveal interactions in a smaller region(s) of interest (ROI), thus providing a map of where the protein interactions occur within the cell. In the original article [6] we were able to produce a map of diffusion and coefficient of cross-correlation in the entire cell. We found that the ccRICS signal is higher in the regions where the focal adhesions are disassembling, e.g., at the upper and right border of the image in Figure 4A. We interpreted this cross correlation spatial distribution as due to complexes containing both proteins that are being released from adhesions during their disassembly. Little or no cross correlation is seen away from disassembling adhesions, suggesting that the complexes, after detaching from the adhesions, have only a brief life, and fall apart quickly. It also suggests that there are few if any preassembled complexes in the cytoplasm or associated with the other adhesions, on this time scale. This analysis emphasizes the locations in the cell where binding equilibria are more prominent.
Example of protein aggregation: Hungtintin (Htt) forms oligomers in the live cells
In this example we show that fluctuation intensity analysis at each pixels of a stack of images reveals protein aggregation, the average size of the aggregates and their location in the cell [37]. The figure and excerpt are reproduced with permission from Biophysical Journal.
Hungtinton disease (HD) is associated with an expansion of a polyQ tract in the protein coding region (near the N-Terminus of Htt). As discussed in (32) extensive evidence demonstrates that processed N-terminal peptide (Httex1p) fragments of Htt with a polyQ expansion are found in pathologic specimens from HD patients and can cause disease in model organisms including flies, worms, mice and other organisms. Evidence also exists that processed fragments containing the polyQ stretch are associated with disease in other triplet repeat disorders. Accordingly, we have tagged human exon 1 fragments containing different polyQ lengths with EGFP (Httex1p-25QP-EGFP, Httex1p-46Q-EGFP and Httex1p-97QP-EGFP). COS-7 cells were transfected with Httex1p-EGFP. Only cells with a low protein expression level at the commencement of the experiment were chosen for time lapse imaging so that the entire evolution of monomers to aggregates could be monitored and measured. These cells were then followed for three to four hours. For each condition at least 20 cells were characterized.
Unexpanded Httex1p typically does not form inclusions but whether it transiently forms oligomeric species in live cells is not known. COS-7 cells transiently transfected with unexpanded Httex1p-25QP-EGFP and observed for several hours starting 51 hours after transfection show no evidence of aggregation. The majority of the protein was in the monomeric form and remained monomeric for the duration of the experiment with a modest preference for cytoplasmic localization.
To assess the behavior of longer polyQ-containing peptides, COS-7 cells transfected with Httex1p-97QP-EGFP were followed (Figure 5). We observed a first phase of accumulation of monomers. Different cells exhibited different rates of EGFP accumulation and oligomerization, and inclusion formation was observed at different times after transfection. These differences however, correlate with the EGFP intensity of the cells suggesting that the aggregation process does not depend on the time after transfection but on protein concentration in the cell. We used brightness analysis to determine when oligomers appeared (Figure 5). Oligomerization does not appear until the monomer concentration exceeds 1μM. At that point, monomers aggregate into oligomers containing on average 10±5 Httex1p-97QP-EGFP molecules as determined by the apparent molecular brightness. As more protein is expressed and the total concentration of protein increases by a factor of 1.5 to 2, determined from the number analysis, a nucleation site for the inclusion is formed in the cytoplasm (Figure 5, green arrow). The inclusion grows in intensity and size, reaching a maximum in about 30 minutes to 1 hour (Figure 5, red arrow). The inclusion recruits almost all the Httex1p-97QP-EGFP protein in the cell, shown in the intensity image at 56 hours. At this point, the protein concentration is depleted to a range of ~0.1 μM, well below the threshold level needed to form oligomers. The inclusion recruits protein from both the nucleus as well as the cytoplasm indicating that nuclear Httex1p-97QP-EGFP is in dynamic equilibrium with the cytoplasmic compartment. After formation of the inclusion, the brightness at the inclusion decreased to B = 1, indicating that the inclusion is immobile. The histograms of the percentage of pixels in the monomer and oligomer conformation (Figure 5) corresponding to the different phases of aggregation show the evolution of the distribution of aggregate sizes from the formation of the first oligomers to the formation of the inclusion body. The percentage of pixels with brightness values corresponding to oligomers increases until the inclusion forms (Figure 5; yellow bar in the histogram). Since the remaining soluble protein after the inclusion is formed is monomeric, oligomers must be in equilibrium with monomers in order to rapidly (in minutes) leave the nucleus and be recruited by the inclusion. We never observed very large oligomeric species (larger than 20 proteins), indicating absence of nanofibrillar structures as a separate species which would appear as bright spots in the cell.
Figure 5.
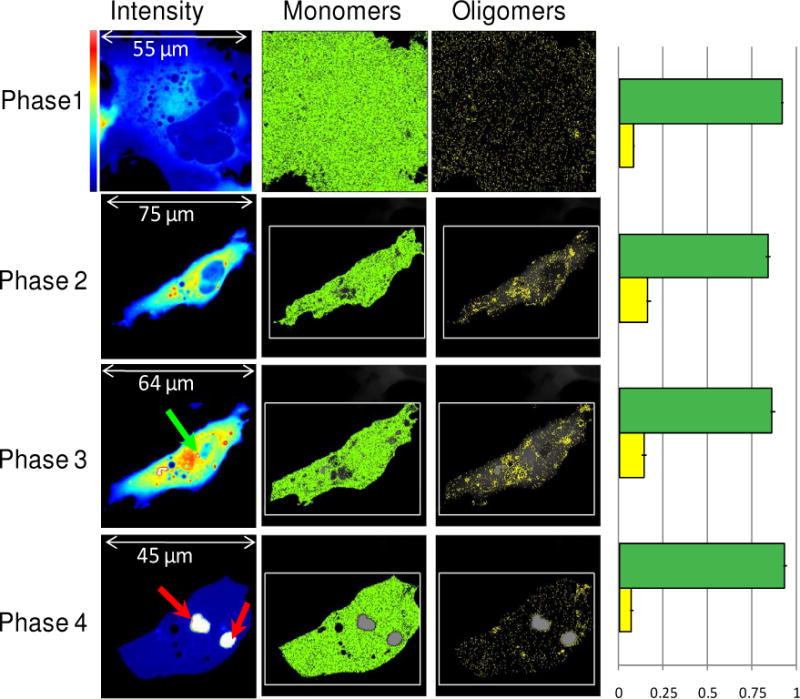
Time evolution of COS-7 cell transfected with Httex1p-97QP-EGFP. Cells were imaged with 0.8% laser power at 488nm and 20μs/pixel. The different rows correspond to the different phases of the aggregation process. The first column shows the average intensity image. The color scale is shown for the first image. In the last image, the white color corresponds to detector saturation. The molecular brightness first increases and then decreases after the formation of the inclusions (indicated by red arrows). The green arrows indicate the points of nucleation. The selection of pixels with the brightness of the monomers (B=1.074, ɛ=3700 cpsm) and oligomers (B=1.74, ɛ=37000 cpsm) are reported in the second and third columns. In the fourth column the fraction of pixels corresponding to monomer (green) and oligomers (yellow) are reported. This graph has been obtained from the analysis of different cells at the different phases shown. The number of pixels with brightness corresponding to oligomers composed of about 2 monomers increases until the inclusion is formed and recruits the majority of the protein.
Example of EGFP diffusing in the nucleus: detection of barriers to diffusion
We summarize in the next example how the pCF approach can provide unprecedented details about barriers to diffusion in the interphase nucleus of cells [38].
The diffusion of proteins in the cell nucleus is central to their mechanism of action as well as to the understanding of nuclear architecture. Single point fluorescence correlation spectroscopy (FCS) has proved to be a powerful tool to study the motions of intracellular molecules, but FCS is limited to measure the diffusion at one point. Here we apply the pair correlation function analysis (pCF) to the subject of molecular diffusion in the interphase nucleus of live cells. By this method we cross correlate several points selected in the nucleus at different locations, enabling us to define migration paths and barriers to diffusion. We use EGFP as a prototypical inert molecule and measure its diffusion between different nuclear environments. It was found that two types of DNA density (high and low) exist as a network of separate ‘channels’ throughout the nucleus, allowing EGFP to diffuse freely throughout either environment, with restricted communication between. Intermittently a window of opportunity for molecules to traverse the channel’s barriers was observed, the temporal nature or which was defined. This is the first in vivo demonstration of the chromatin network providing channel directed diffusion of an inert molecule, as postulated so far by theoretical models.
Nuclear architecture is fundamental to the manner in which molecules traverse the nucleus. The cell nucleus is a functionally and spatially structured organelle in which diffusion is the mode of motion for inert molecules. The diffusion of molecules within the nucleus is obstructed by the steric constraints imposed by structural components, such as chromatin. Proposed models for the three dimensional arrangement of chromatin vary from defined regions of chromatin compartmentalisation to intermingled chromatin fibers and loops. The requirement for biologically significant molecules to reach different destinations within the cell nucleus raises the question, how is the diffusive route taken directed? Given that diffusion cannot be regulated as it is essentially a default mechanism of motion, it has been postulated that structural features of the nucleus must impart retention at particular sites and control flux of movement between compartments.
Insights into intra-nuclear trafficking are predominantly derived from measurement of the accessibility of the nuclear landscape, and the affect it has on diffusion of biologically active and inert molecules. Current approaches commonly employed for such investigations are fluorescence recovery after photo bleaching (FRAP), single particle tracking (SPT) and single point fluorescence correlation spectroscopy (FCS). FRAP cannot reveal the path following by molecules to replenish the region that has been bleached. SPT requires the observation of large isolated particles for a long time which yields poor statistics and could not be relevant to the diffusion of small proteins. FCS in contrast provides information at the single molecule level with good statistics by averaging the behavior of many molecules. However, the traditional single point FCS only measures the time takes for a molecule to cross the diffraction limited excitation spot. The spatial environment around the PSF, and thus the route the molecules take prior to crossing the observation volume is not directly observed in the FCS experiment. The approach based on the pair correlation function could resolve this issue [12]. The pCF method builds upon previous approaches to spatiotemporal correlation such as two foci FCS. However pCF analysis is more comprehensive in that only one laser beam is scanned rapidly across different locations in a repeated pattern (line or a circle) resulting in the measurement of correlation between every possible pair of points in the pattern. By detecting the same molecule at two different locations we measure the average time a molecule takes to move between these two locations. If there is a delay from the expected average time to diffuse the distance between the two points, we can make inferences about the existence of barriers to diffusion between those two points. In the instance the barrier encountered is impenetrable, an absence of correlation between positions on either side is observed.
We used CHO-K1 cells stably expressing EGFP, a well characterized protein known to show minimal interaction with its surroundings and thus diffuse freely. The nuclei of cells were stained with Hoechst 33342, as a means of having a reference for the local DNA density and position. Figure 6 shows the schematic of the experiment and the figure caption describes the method used.
Figure 6. Overview of the line measurement.
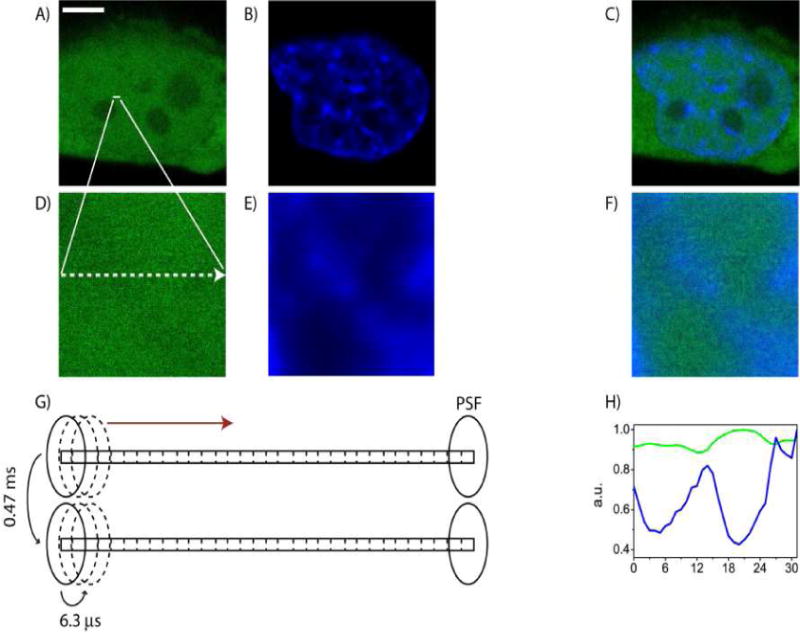
(A) Free EGFP in CHOK1 cell. Scale bar: 5μm. (B) Nucleus of CHOK1 cell stained with Hoechst 33342. (C) Merged image of A and B. (D) Free EGFP in the plane of the line drawn: 3.3μm (E) Hoechst 33342 staining in the plane of the line drawn: 3.3μm. (F) Merged image of D and E. (G) Schematic of the laser PSF traversing across a 3.2μm line (32 pixels) in the nucleus, scanning from left to right with a pixel dwell time of 6.3μs and a line time of 0.47ms. (H) Comparison of the intensity profile of EGFP and Hoechst 33342 for a line experiment.
Figure 7 shows the main results of the pCF experiments. The pCF approach provides a rapid method to detect region of “communication” where molecules in one region can be observed in another region after some times and disconnected regions where there is no communication. In addition, if communication exists, the pCF gives the average time needed for the communication to occur. Our experiments show that communication is possible among region in the nuclear space outside the chromatin and along the chromatin. However the two fluxes as an average are disconnected. This is a very important result. The preferential channeling of molecules along the chromatin has been previously postulated but never proved. Thus, by cross correlating pairs of points in the nucleus we found that there was a dependence of the diffusive route taken by EGFP on DNA density. Through analysis of EGFP diffusion between different DNA environments, migration paths which allowed for communication between different DNA environments were established, as well as barriers to diffusion resulting in poor or no communication. It was found that the two types of DNA density (high and low) exist as a network of separate ‘channels’ throughout the nucleus, that allow EGFP to diffuse freely throughout either environment, however with restricted communication among them. It was also found that in the different regions of the nucleus the diffusion coefficients found in our measurements are in very good agreement with previous results [39][40].
Figure 7. pCF carpet analysis of intranuclear diffusion.
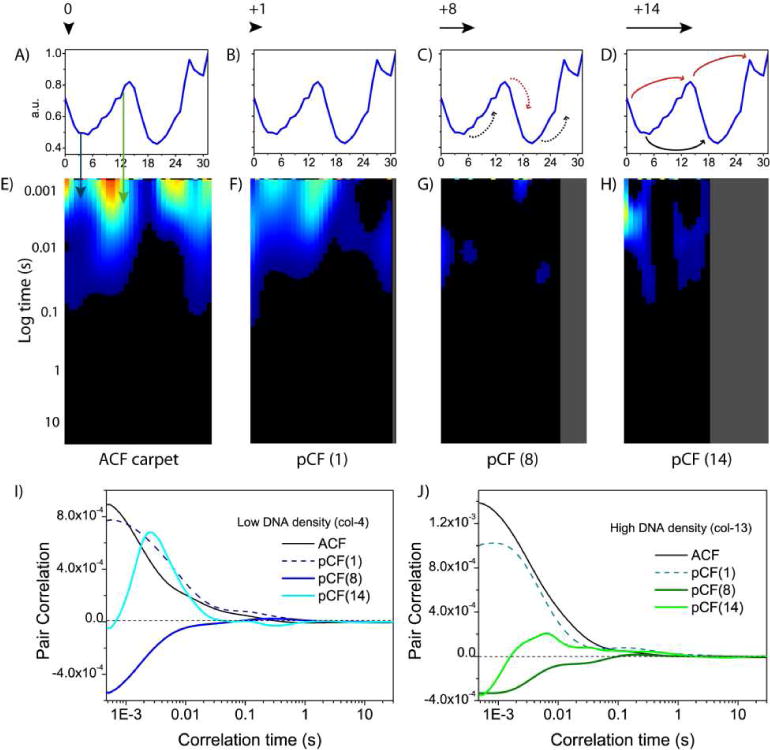
(A)–(B) Intensity profile of the Hoechst 33342 stain across the line measured. (E) pCF(0) carpet which corresponds to calculation of an ACF carpet. (F) pCF(1) carpet which corresponds to cross correlation of adjacent pixels in the same DNA environment within the PSF. (G) pCF(8) carpet which corresponds to cross correlation of pixels in different density DNA environments. (H) pCF(14) carpet which corresponds to cross correlation of pixels in low-low DNA around a high DNA density environment or pixels in high-high DNA around a low DNA density environment. (I) Fitting of an extracted column from each of the pCF carpets (0, 1, 8 and 14) corresponding to low DNA (col. 4). (J) Fitting of an extracted column from each of the pCF carpets (0, 1, 8 and 14) corresponding to high DNA (col. 13).
Conclusions, challenges and future prospects
Fluorescence fluctuation analysis is appealing for the measurement of molecular motion and interaction because it has single molecule sensitivity, very large bandwidth and it is compatible with well-established microcopy techniques used in live cells imaging. As the software for data analysis will become more popular and the basic principles better understood, we believe that image fluctuation analysis will establish as the method of choice to study transport problems in cells and molecular aggregation. What is the next frontier? While the large spatial scale (the size of a cell) description of motion and aggregation distribution is very important for many biological problems as described in this paper, it will be a great progress if the FCS methods could be applied at the nanoscale. Clearly we are moving in this direction with single molecule studies in live cells and with the advent of optical super-resolution. Single molecule methods are very powerful because they have the potential of providing description of complex biological events at the molecular level. A prerequisite for single molecule studies is to be able to reach the nanometer scale. The strategy used in these studies is to fix to a surface some part of the molecular complex and then look at the reactions using several fluorescence methods, commonly FRET. This common approach does not requires super-resolution since the motion is detected using center-of mass fluorescence distributions which can be applied only on isolated particles. The challenge of using this approach is that immobilization is difficult to achieve in live cells, although transient immobilization is possible. Another challenge is to isolate one complex from the others. We believe that 3D particle tracking methods of large complexes could produce enough “immobilization” so that molecular reactions could be detected. Yet, we will need to determine the size, orientation and some elements of the structure of the complex to understand where the reaction in the complex is occurring. We believe that some dynamic nanoimaging in which fluctuations can be measured and FRET techniques can be used is required to reach this limit. Among all the super-resolution imaging method proposed so far, the STED approach appears the only one that has the appropriate dynamic range [41]. STED microscopy in conjunction with feedback imaging has the potential of bringing us to the next frontier in which the formation and diffusion of large macromolecular complexes could be studied in real time and in live cells. In principle, many of the technical advancements needed have been separately demonstrated but they have not been put together to create a fast nanoimager that will allow us to observe the formation of large macromolecular complexes in real time in live cells. Another recent advance in the image correlation field is driven by the availabitly of fats and sensitive cameras. Although these detectors lack of the speed that can be achived using photomultiplers or other single channel detector, they have the potential to measure fluctuations on a large area. These detectors have been recently used in the context of TIRF microscopy [19] and for FCS-SPIM [22].
Figure 3.
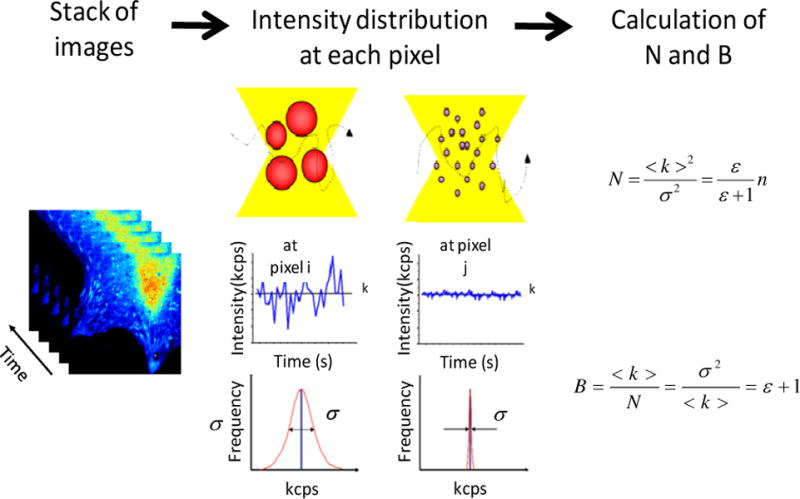
Starting with an image stack, we calculate the average intensity <k> and the variance σ2 at each pixel. The Number of particles N is defined as the ratio of the square of the average intensity to the variance and it can be expressed in terms of the molecular brightness ɛ and number of molecules n. The Brightness B is defined as the ratio of the variance to the average intensity. B is related to the molecular brightness ɛ. Per equal average intensity, the variance depends on the number of particles and the brightness of each particle.
Acknowledgments
The authors acknowledge financial support from the National Institutes of Health, grant numbers 5P50 GM076516 and 5P41 RR03155.
References
- 1.Poo M, Cone RA. Lateral diffusion of rhodopsin in the photoreceptor membrane. Nature. 1974;247:438–41. doi: 10.1038/247438a0. [DOI] [PubMed] [Google Scholar]
- 2.Axelrod D, Koppel DE, Schlessinger J, Elson E, Webb WW. Mobility measurement by analysis of fluorescence photobleaching recovery kinetics. Biophys J. 1976;16:1055–69. doi: 10.1016/S0006-3495(76)85755-4. [DOI] [PMC free article] [PubMed] [Google Scholar]
- 3.Saxton MJ, Jacobson K. Single-particle tracking: applications to membrane dynamics. Annu Rev Biophys Biomol Struct. 1997;26:373–99. doi: 10.1146/annurev.biophys.26.1.373. [DOI] [PubMed] [Google Scholar]
- 4.Digman MA, Brown CM, Sengupta P, Wiseman PW, Horwitz AR. Measuring fast dynamics in solutions and cells with a laser scanning microscope. Biophys J. 2005;89:1317–27. doi: 10.1529/biophysj.105.062836. [DOI] [PMC free article] [PubMed] [Google Scholar]
- 5.Digman MA, Wiseman PW, Choi C, Horwitz AR, Gratton E. Stoichiometry of molecular complexes at adhesions in living cells. Proc Natl Acad Sci USA. 2009;106:2170–5. doi: 10.1073/pnas.0806036106. [DOI] [PMC free article] [PubMed] [Google Scholar]
- 6.Digman MA, Wiseman PW, Horwitz AR, Gratton E. Detecting protein complexes in living cells from laser scanning confocal image sequences by the cross correlation raster image spectroscopy method. Biophys J. 2009;96:707–16. doi: 10.1016/j.bpj.2008.09.051. [DOI] [PMC free article] [PubMed] [Google Scholar]
- 7.Digman MA, Sengupta P, Wiseman PW, Brown CM, Horwitz AR. Fluctuation correlation spectroscopy with a laser-scanning microscope: exploiting the hidden time structure. Biophys J. 2005;88:L33–6. doi: 10.1529/biophysj.105.061788. [DOI] [PMC free article] [PubMed] [Google Scholar]
- 8.Petersen NOHP, Wiseman PW, Seger O, Magnusson KE. Quantitation of membrane receptor distributions by image correlation spectroscopy: concept and application. Biophys J. 1993;165(3):1135–46. doi: 10.1016/S0006-3495(93)81173-1. [DOI] [PMC free article] [PubMed] [Google Scholar]
- 9.Wiseman PWSJ, Ellisman MH, Wilson KR. Two-photon image correlation spectroscopy and image cross-correlation spectroscopy. J Microsc. 2000;200(Pt 1):14–25. doi: 10.1046/j.1365-2818.2000.00736.x. [DOI] [PubMed] [Google Scholar]
- 10.Hebert B, Costantino S, Wiseman PW. Spatiotemporal image correlation spectroscopy (STICS) theory, verification, and application to protein velocity mapping in living CHO cells. Biophys J. 2005;88:3601–14. doi: 10.1529/biophysj.104.054874. [DOI] [PMC free article] [PubMed] [Google Scholar]
- 11.Kolin DL, Wiseman PW. Advances in image correlation spectroscopy: measuring number densities, aggregation states, and dynamics of fluorescently labeled macromolecules in cells. Cell Biochem Biophys. 2007;49:141–64. doi: 10.1007/s12013-007-9000-5. [DOI] [PubMed] [Google Scholar]
- 12.Digman MA, Gratton E. Imaging barriers to diffusion by pair correlation functions. Biophys J. 2009;97:665–73. doi: 10.1016/j.bpj.2009.04.048. [DOI] [PMC free article] [PubMed] [Google Scholar]
- 13.Schwille P, Meyer-Almes FJ, Rigler R. Dual-color fluorescence cross-correlation spectroscopy for multicomponent diffusional analysis in solution. Biophys J. 1997;72:1878–86. doi: 10.1016/S0006-3495(97)78833-7. [DOI] [PMC free article] [PubMed] [Google Scholar]
- 14.Wiseman PW, Squier JA, Ellisman MH, Wilson KR. Two-photon image correlation spectroscopy and image cross-correlation spectroscopy. J Microsc. 2000;200:14–25. doi: 10.1046/j.1365-2818.2000.00736.x. [DOI] [PubMed] [Google Scholar]
- 15.Muller JD, Chen Y, Gratton E. Resolving heterogeneity on the single molecular level with the photon-counting histogram. Biophys J. 2000;78:474–86. doi: 10.1016/S0006-3495(00)76610-0. [DOI] [PMC free article] [PubMed] [Google Scholar]
- 16.Chen Y, Muller JD, Berland KM, Gratton E. Fluorescence fluctuation spectroscopy. Methods. 1999;19:234–52. doi: 10.1006/meth.1999.0854. [DOI] [PubMed] [Google Scholar]
- 17.Chen Y, Muller JD, So PT, Gratton E. The photon counting histogram in fluorescence fluctuation spectroscopy. Biophys J. 1999;77:553–67. doi: 10.1016/S0006-3495(99)76912-2. [DOI] [PMC free article] [PubMed] [Google Scholar]
- 18.Kask PPK, Ullmann D, Gall K. Fluorescence-intensity distribution analysis and its application in biomolecular detection technology. Proc Natl Acad Sci USA. 1999;96:13756–13761. doi: 10.1073/pnas.96.24.13756. [DOI] [PMC free article] [PubMed] [Google Scholar]
- 19.Unruh JR, Gratton E. Analysis of molecular concentration and brightness from fluorescence fluctuation data with an electron multiplied CCD camera. Biophys J. 2008;95:5385–98. doi: 10.1529/biophysj.108.130310. [DOI] [PMC free article] [PubMed] [Google Scholar]
- 20.Needleman DJ, Xu Y, Mitchison TJ. Pin-hole array correlation imaging: highly parallel fluorescence correlation spectroscopy. Biophys J. 2009;96:5050–9. doi: 10.1016/j.bpj.2009.03.023. [DOI] [PMC free article] [PubMed] [Google Scholar]
- 21.Heuvelman G, Erdel F, Wachsmuth M, Rippe K. Analysis of protein mobilities and interactions in living cells by multifocal fluorescence fluctuation microscopy. Eur Biophys J. 2009;38:813–28. doi: 10.1007/s00249-009-0499-9. [DOI] [PubMed] [Google Scholar]
- 22.Wohland T, Shi X, Sankaran J, Stelzer EH. Single plane illumination fluorescence correlation spectroscopy (SPIM-FCS) probes inhomogeneous three-dimensional environments. Opt Express. 18:10627–41. doi: 10.1364/OE.18.010627. [DOI] [PubMed] [Google Scholar]
- 23.Elson ELMD. Fluorescence correlation spectroscopy. I. Conceptual basis and theory. Biopolymers. 1974;13(1):1–27. doi: 10.1002/bip.1974.360130103. [DOI] [PubMed] [Google Scholar]
- 24.Magde D, Elson EL, Webb WW. Fluorescence correlation spectroscopy. II. An experimental realization. Biopolymers. 1974;13:29–61. doi: 10.1002/bip.1974.360130103. [DOI] [PubMed] [Google Scholar]
- 25.Elson EL, Webb WW. Concentration correlation spectroscopy: a new biophysical probe based on occupation number fluctuations. Annu Rev Biophys Bioeng. 1975;4:311–34. doi: 10.1146/annurev.bb.04.060175.001523. [DOI] [PubMed] [Google Scholar]
- 26.Koppel DEAD, Schlessinger J, Elson EL, Webb WW. Dynamics of fluorescence marker concentration as a probe of mobility. Biophys J. 1976;16:1315–29. doi: 10.1016/S0006-3495(76)85776-1. [DOI] [PMC free article] [PubMed] [Google Scholar]
- 27.Bacia K, Schwille P. Fluorescence correlation spectroscopy. Methods Mol Biol. 2007;398:73–84. doi: 10.1007/978-1-59745-513-8_7. [DOI] [PubMed] [Google Scholar]
- 28.Haustein E, Schwille P. Fluorescence correlation spectroscopy: novel variations of an established technique. Annu Rev Biophys Biomol Struct. 2007;36:151–69. doi: 10.1146/annurev.biophys.36.040306.132612. [DOI] [PubMed] [Google Scholar]
- 29.Brown CM, Dalal RB, Hebert B, Digman MA, Horwitz AR. Raster image correlation spectroscopy (RICS) for measuring fast protein dynamics and concentrations with a commercial laser scanning confocal microscope. J Microsc. 2008;229:78–91. doi: 10.1111/j.1365-2818.2007.01871.x. [DOI] [PMC free article] [PubMed] [Google Scholar]
- 30.Chen YMJ, So PTC, Gratton E. The photon counting histogram in fluorescence fluctuation spectroscopy. Biophys J. 1999;77:553–567. doi: 10.1016/S0006-3495(99)76912-2. [DOI] [PMC free article] [PubMed] [Google Scholar]
- 31.Chen Y, Muller JD, Tetin SY, Tyner JD, Gratton E. Probing ligand protein binding equilibria with fluorescence fluctuation spectroscopy. Biophys J. 2000;79:1074–84. doi: 10.1016/S0006-3495(00)76361-2. [DOI] [PMC free article] [PubMed] [Google Scholar]
- 32.Wu B, Chen Y, Muller JD. Dual-color time-integrated fluorescence cumulant analysis. Biophys J. 2006;91:2687–98. doi: 10.1529/biophysj.106.086181. [DOI] [PMC free article] [PubMed] [Google Scholar]
- 33.Digman MA, Dalal R, Horwitz AF, Gratton E. Mapping the number of molecules and brightness in the laser scanning microscope. Biophys J. 2008;94:2320–32. doi: 10.1529/biophysj.107.114645. [DOI] [PMC free article] [PubMed] [Google Scholar]
- 34.Dalal RB, Digman MA, Horwitz AF, Vetri V, Gratton E. Determination of particle number and brightness using a laser scanning confocal microscope operating in the analog mode. Microsc Res Tech. 2008;71:69–81. doi: 10.1002/jemt.20526. [DOI] [PubMed] [Google Scholar]
- 35.Bacia K, Kim SA, Schwille P. Fluorescence cross-correlation spectroscopy in living cells. Nat Methods. 2006;3:83–9. doi: 10.1038/nmeth822. [DOI] [PubMed] [Google Scholar]
- 36.Bacia K, Schwille P. A dynamic view of cellular processes by in vivo fluorescence auto- and cross-correlation spectroscopy. Methods. 2003;29:74–85. doi: 10.1016/s1046-2023(02)00291-8. [DOI] [PubMed] [Google Scholar]
- 37.Ossato G, Digman MA, Aiken C, Lukacsovich T, Marsh JL. A two-step path to inclusion formation of huntingtin peptides revealed by number and brightness analysis. Biophys J. 98:3078–85. doi: 10.1016/j.bpj.2010.02.058. [DOI] [PMC free article] [PubMed] [Google Scholar]
- 38.Hinde E, Cardarelli F, Digman MA, Gratton E. In vivo pair correlation analysis of EGFP intranuclear diffusion reveals DNA-dependent molecular flow. Proc Natl Acad Sci USA. 107:16560–5. doi: 10.1073/pnas.1006731107. [DOI] [PMC free article] [PubMed] [Google Scholar]
- 39.Wachsmuth M, Waldeck W, Langowski J. Anomalous diffusion of fluorescent probes inside living cell nuclei investigated by spatially-resolved fluorescence correlation spectroscopy. J Mol Biol. 2000;298:677–89. doi: 10.1006/jmbi.2000.3692. [DOI] [PubMed] [Google Scholar]
- 40.Dross N, Spriet C, Zwerger M, Muller G, Waldeck W. Mapping eGFP oligomer mobility in living cell nuclei. PLoS One. 2009;4:e5041. doi: 10.1371/journal.pone.0005041. [DOI] [PMC free article] [PubMed] [Google Scholar]
- 41.Willig KI, Harke B, Medda R, Hell SW. STED microscopy with continuous wave beams. Nat Methods. 2007;4:915–8. doi: 10.1038/nmeth1108. [DOI] [PubMed] [Google Scholar]