

Abstract
Analysis of the cellular distributions of coenzymes including NADH may aid in understanding a cells metabolic status. We altered serum concentration (0%, 2% and 10%) to induce living myoblast cells to undergo the early stages of differentiation. Through microscopy and phasor-FLIM, we spatially mapped and identified variations in the distribution of free and bound NADH. Undifferentiated cells displayed abundant free NADH within the nucleus along with specific regions of more bound NADH. Complete serum starvation dramatically increased the fraction of bound NADH in the nucleus, indicating heightened requirement for transcriptional processes. In comparison, cells exposed to 2% serum exhibited intermediate free nuclear NADH fraction. Overall our results suggest an order of events in which a cells metabolic status alters significantly during the early stages of serum induced differentiation.
INTRODUCTION
We have used the differences in fluorescence lifetime between the states of protein ligation of the coenzymes Nicotinamide Adenine Dinucleotide (NADH), Nicotinamide Adenine Dinucleotide Phosphate (NAD(P)H) and Flavin Adenine Dinucleotide (FAD) as an indirect method for determining a living cells metabolic status (Stringari and others, 2011). Alterations in the spatial distribution of the aforementioned cofactors often correlate with variations in cellular metabolic states and metabolite concentration (Fjeld and others, 2003; Stringari and others, 2011). The role of NADH has been examined, with its presence in different cellular compartments affecting overall functionality. Within the nucleus, interaction of NADH/NAD+ with regulatory proteins including the repressor protein CtBP ultimately influences transcriptional behavior (Kim and others, 2005; Lejeune and Ladurner, 2005). NADH has also been implicated in regulatory processes associated with histone acetylation which in turn influences a cascade of replicative processes (Ghosh and others, 2010; Kim and others, 2005; Lin and Guarente, 2003; Skala and others, 2007).
Methods to assess such regulatory mechanisms may benefit areas including cancer pathology, pharmacological development and neurodegenerative studies (Heikal, 2010). In previous investigations, discrimination of metabolic cofactors has occurred through the use of single photon redox fluorometry (Currie and others, 1966); however, this process may induce autofluorescent photobleaching (Huang and others, 2002). Multiphoton microscopy (MPM) mitigates photobleaching as well as maintaining cell viability (Huang and others, 2002), increasing the prospect of real time visualization of live cell metabolic dynamics.
The development of FLIM (Fluorescence Lifetime Imaging Microscopy) techniques have enabled minimal differences between the protein bound and protein free form of NADH to be detected (Huang and others, 2002). Further, the presence of FAD/NADH may be optically resolved or selectively excluded with the aid of a cut off filter and separate collection channels (Wright and others, 2012).
Through the phasor approach to FLIM we identified differences in the detectable concentration ratio of NADH in both the free form and bound to proteins or organelles when comparing cellular compartments; nuclear and cytoplasmic regions. Unlike other FLIM techniques, the phasor approach requires no fitting to exponentials, with each data point in the phasor representing an experimental point (Gratton and others, 1984a; Gratton and others, 1984b).
We exploited the dynamics of progenitor myoblast cells through inducing the early stages of cell differentiation by serum starvation in order to provoke natural alterations in NADH behavior and quantity during the early stages of cell development. To excite the autofluorescent properties of NADH, MPM with excitation at 740 nm was utilized with an emission filter to selectively separate autofluorescent FAD. We identified distribution differences in free and bound NADH in all three tested ranges of serum concentration (0%, 2% and 10%) with relevance to spatial positions including the nucleus, nucleolus and cytoplasm.
RESULTS
The application of phasor-FLIM in combination with MPM allows for potential real time analysis of metabolic components within living cells. Before applying the phasor approach, the expected spatial distribution of the desired species must first be determined. We identified regions in the phasor plot of pixels cluster with cellular relevance (Fig. 1 colored circles) and created a phasor fingerprint for both free and bound NADH as depicted in Fig. 1.
Figure 1.
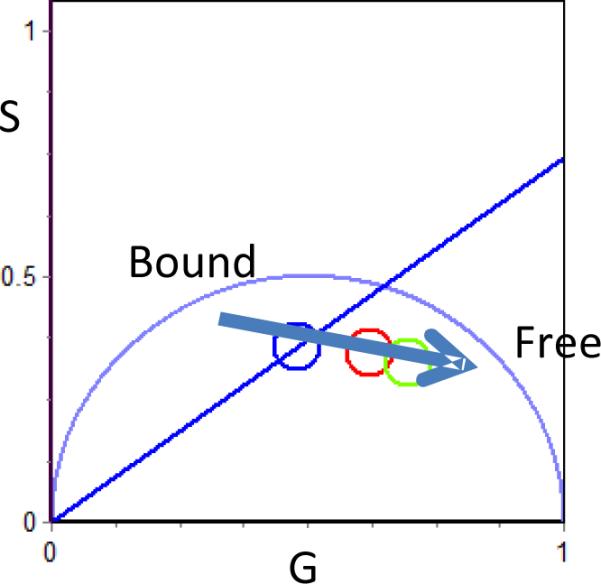
Color scheme for free/bound NADH. The blue color corresponds to pixels which has a large fraction of bound NADH while the green pixels correspond to more free NADH, Red is intermediate. Large fraction of bound NADH (blue pixels) is found in the cytoplasm while lower fraction of bound NADH (red and green pixels) is found in the nucleus.
For all cellular data, analysis of intensity images (Fig. 2A, D, 3A, D and 4A, D) revealed clustering of NADH mainly within the cytoplasm. However we are not able to distinguish NADH subtypes based only on fluorescence intensity, irrespective of the cells differentiation state. Through the phasor FLIM analysis, regions of various abundances of bound and free NADH forms were determined at a pixel level enabling the extraction of further information from the intensity images. Manual selection of clustered distributions within a phasor plot occurred through the use of a circular cursor as shown in Figure 1. This selection enabled clear discernment of NADH subtypes. In the phasor-FLIM analysis, undifferentiated myoblasts exposed to 10% serum (10%S) exhibited larger fraction of free NADH in the nucleus with the emergence of a pattern (green=less bound and red=more bound as per the color code of Fig. 1) indicating the free and bound NADH cluster in the nucleus.
Figure 2. A lifetime analysis of bound/free NADH in 10%S cells.

Intensity image (A, D) and FLIM image (B, E) of two undifferentiated myoblast cells according to the color scale in Figure 1. Note the high abundance of free NADH within the nucleolus (yellow circle and green coded pixels). The `S' and `G' coordinates are the sine and cosine transform respectively as given in the method section.
Figure 3.

Phasor analysis of bound/free NADH in 0%ED cells. Intensity image (A, D) and FLIM image (B, E) according to the colour scheme in Figure 1 of myoblast cells induced to undergo the early stages of differentiation through complete serum starvation (0%).
Figure 4.
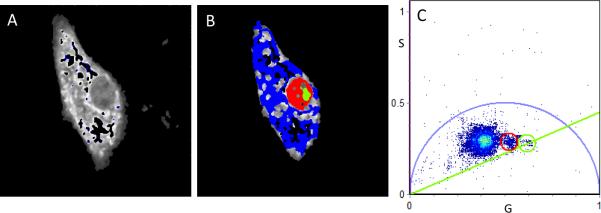
FLIM analysis of bound/free NADH myoblast cells. Intensity image (A) and FLIM image (B, according to the colour scale in Figure 1) of a cell induced to undergo the early stages of differentiation in 2% serum. The phasor plot (C) corresponds to the cell in A with nuclear (red pixels), nucleolus (green pixels) and cytoplasmic (blue pixels).
Distinct patterns in individual cells were identified. Within the tested serum ranges, 10%S cells exhibited clear definition of nuclear (red and green pixels) and cytoplasmic (blue pixels) compartments with NADH free and bound relative variations between nuclear and nucleolus (red and green) regions evident.
Within cells induced to undergo the early stages of differentiation through complete serum starvation (0%ED), bound NADH within the cytoplasmic regions was evident (Fig. 3B, E) while there was still free NADH detected within the nucleus which again showed regions of less bound concentration in the nucleolus (Fig. 3B, E).
At a 2% serum concentration to induce the early stages of differentiation (2%ED), a decrease in the quantity of free NADH which influenced overall co-localization of free and bound NADH within the nucleus was apparent (Fig. 4 A, B) while there was at times an increase in free NADH within the cytoplasmic periphery. Differentiation between each region according to the colour scheme of figure 1 (blue more bound, red, intermediate and green less bound) was still evident with nucleolar discrimination still the most apparent.
The overall phasor histogram of the 10%S cells (Fig. 5A, N=6 cells), produced through an analysis of the phasor distribution plots, showed a bimodal distribution indicating potential differentiation of NADH states in cellular compartments. A decrease in the concentration of serum to 0% lead to the phasor histogram bimodal distribution being no longer evident (Fig. 5B). At 2% serum concentration, the bimodal distribution in the phasor histogram was still no longer apparent (Fig. 5C) coinciding with previous serum induced differentiation (Fig. 5B). It was further identified that there was a shift in the phasor distribution at each serum concentration towards a longer lifetime distribution (to the left of the phasor plot).
Figure 5.
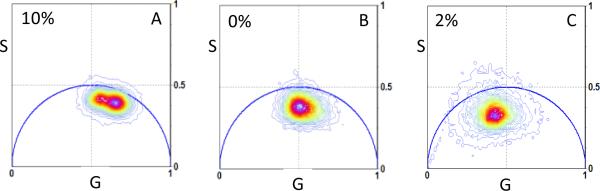
Comparison of the average phasor histogram distribution at three serum concentrations. The phasor histogram of cells exposed to 10% serum shows a bimodal distribution not evident in the other tested ranges. As the serum concentration was decreased to either 0% serum and 2% serum, the phasor histogram shifted towards the direction of the bound NADH.
For the direct comparison of all regions, analysis of the variations in serum concentrations examined were combined in a single scatter plot in order to assess structural differences in the detected phasor distributions. As presented in the average phasor distribution plot in Figure 6, differences in the spatial location of the phasor values were identified. For 10%S cells, the phasor distribution clusters were positioned on the right side of the phasor plot for both the nuclear (light green circle) and nucleolus (light blue diamond) regions. In the cytoplasm (pink square) the phasor distribution shifted toward the left (more bound NADH). For the 0%ED treated cells, a substantial overall shift of the phasor distribution towards the left was apparent in the nucleus (green circle) with a slight shift also toward the left in the cytoplasm (red square). The nucleolus (dark blue diamond) exhibited shifts towards the left (more bound NADH) when compared to that of 10% serum exposure. The 2%ED cells overall exhibited shifts towards the left in all analysed regions (nucleolus; purple diamond, nucleus; dark green circle and cytoplasm; orange square). Cell variances (N=6) are presented for all areas as circular or oval lines.
Figure 6.
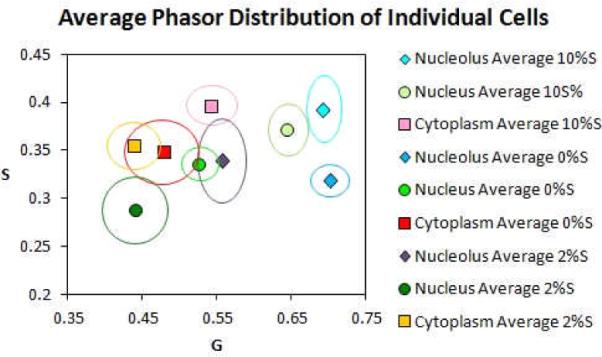
Localization of distribution points within different cellular regions for all tested serum concentrations through a scatter analysis. An average of the color coded points of localization for each region (nucleolus, nucleus and cytoplasm) is presented for the analyzed cells (N= 6). The variance is indicated by the bold color coded lines.
DISCUSSION
Here we show that the phasor approach to FLIM provides a label-free means to identify the states of differentiation of the cell using the autofluorescence of the metabolic coenzyme NADH. We further show that a phasor FLIM analysis enables not only the distinction of cellular compartments with respect to NADH but also provides a possible means for the identification of the early stages of cell differentiation in myoblast cells and potentially other cell types. Previously, discrimination between metabolic coenzymes has proven difficult (Huang and others, 2002) however, the phasor approach enables identification of enzyme differentiation states including those of both free and bound NADH through a lifetime analysis (Stringari and others, 2011; Wright and others, 2012). The phasor approach exploits all of the autofluorescent properties of the reduced form to enable comparison between oxidative states. The theoretical lifetimes for both free and bound NADH are 0.4 ns and 3.2 ns respectively (Stringari and others, 2011; Wright and others, 2012).
In all of the tested serum ranges (0%, 2% and 10%), there were identifiable patterns and changes in spatial distribution, quantity and co-localization of both bound and free NADH. In a phasor-FLIM analysis, the 10%S cells exhibited an abundance of free NADH within the nucleus coupled at times with a co-localized pattern where the free NADH appeared to be in close proximity to bound NADH (Fig. 2B, E). We propose the observed quantity of free NADH within the nucleus may indicate reduced nuclear activity with respects to replication, chromatin remodeling and transcriptional activity. Free NADH within the nucleus is known to interact with multiple regulatory proteins including CtBP, Silence Information Regulator 2 (Sir2) and Sirtuin 6 (Sirt6) (Fjeld and others, 2003; Ghosh and others, 2010; Kim and others, 2005). The aforementioned species influence NADH interaction through mechanisms including histone acetylation, transcriptional repression and gene regulatory mechanisms. It is possible that previous in vitro analyses (Kim and others, 2005) of these regulatory proteins with respect to NADH concentration coincide with the observed NADH patterns presented in this work. A phasor plot analysis of 10%S cells (Fig. 2) enabled the clear separation of the assessed cellular regions (nucleolar, nuclear and cytoplasmic).
The 0%ED cells displayed a high abundance of bound NADH which appeared to be mainly localized in the nuclear region (Fig. 3). The distinction of the nucleolar region in the phasor plots (Fig. 3C, F) became more apparent in these cells due to the increase of bound NADH within the nuclear region. There was also an observed decrease in bound NADH in the cytoplasmic periphery indicating a shift towards cellular respiratory mechanisms including the production of energy in the form of ATP (Schultz and Chan, 2001). Interestingly, the compartmentalization of the free/bound NADH in the nucleus appeared to increase when compared to the 10%S cells, indicating a possible increase in the cells replicative and transcriptional activity at this stage in cell development.
As serum exposure decreased, changes in both the quantity and spatial distribution of both free and bound NADH became apparent. For the 2%ED cells, a decrease in both the quantity and as a result co-localization of free and bound NADH within the nucleus was evident (Fig. 4). The decrease in the observed quantity suggests the replenishment of the cells free NADH within the nucleus through salvage pathways (Lin and Guarente, 2003) is still required for future replenishment of nuclear NADH levels but may not be a central focus at this stage of development. The salvage pathways in live cells indirectly result in an increase in NADH levels through both NAD replenishment and oxidative reactions (Lin and Guarente, 2003). There was a shift towards a large fraction of the bound form for all regions in the distribution plot analysis (Fig. 5).
The average phasor histogram in each of the conditions analyzed was definitively different. For the 10%S cells, the histogram was bimodal indicating a large compartmentalization for the cytoplasm with respect to the nucleus (Fig. 5A). As the volume of serum decreased, a spatial shift in phasor became apparent. At both 0%S and 2%S, the bimodal distribution of the histogram was not observed inferring regional differences of NADH compartmentalization became less evident.
The combination of all measured cells into a single scatter plot (Fig. 6) enabled the identification of spatial shifts in phasor clusters throughout all of the analyzed regions. Overall there was a linear increase of the bound form of NADH nuclear regions at the early stages of differentiation due to the shift towards a longer lifetime. The distribution for the nucleolar region of the 0%ED and 10%S cells exhibited similarity however there was an observed shift of the nucleolar region of the 2%ED cells towards a bound form of NADH when the serum differences were compared. Cytoplasmic distributions displayed consistent clustering for all three tested ranges.
Phasor plot representation enabled the identification of not only significant bound/free fractional contribution of NADH differences in the three examined regions; nuclear, nucleolar and cytoplasmic (Fig. 2 and Fig. 3) but also distribution differences at the nuclear periphery (more red pixels in the nuclear periphery).
Overall, this data suggest a highly organized order of events in which a cells metabolic status significantly alters during the early stages of serum induced cell differentiation. This identification may propose a means by which the early stages of differentiation may be assessed in real time with metabolic relevance using phasor-FLIM. Further, the implementation of a scatter analysis when combined with phasor-FLIM provides a possible means to differentiate between different cellular regions based on the presence of bound and free NADH.
METHODS
The L6 myoblast cell line in an undifferentiated form were brought up from cryo-preservation at minimum two days prior to experimental procedures. The cells were cultured in complete DMEM supplemented with 10% FBS, PEN/STREP and maintained in a 37°C, 5% CO2 humidified incubator. The cells were plated on a 35mm Mat Tek dish coated with Fibronectin (3 °g/mL) 24 hrs prior to imaging. Cells were induced to differentiate through exposure to either 0% or 2% serum at minimum 3 hrs prior to imaging.
All measurements were acquired with the aid of a Zeiss 710 confocal microscope coupled with a Ti:Sapphire laser (Spectra-Physics Mai Tai) and an ISS A320 FastFLIM (FLIMbox). For all FLIM acquisitions, a 40 × 1.2 NA oil objective (Zeiss) or a C-Apochromat 40 × 1.2 NA W Korr M27 objective were used with a pixel resolution of 256 × 256 and a scan speed of 25 μs/pixel. The excitation wavelength was set to 740 nm (maximum 10%). Light from the laser was excluded by a 690 nm dichroic filter. Fluorescence was detected through the use of a photomultiplier collecting a bandwidth of 416 – 730 nm.
A fluorescein solution (30 nM) in 0.1 M NaOH was used to calibrate the system against a known single exponential lifetime of 4.04ns. FLIM data, acquired through the SimFCS Globals software, was collected for a minimum of 120 counts with typical acquisition occurring in a 3–4s timeframe.
The theory behind FLIM has been described previously (Digman and others, 2008; Stringari and others, 2011; Van Munster and Gadella, 2005) however in brief, in the approach for time domain FLIM, the sine and cosine transformations of the decay curve are used to determine the phasor at every pixel. The transforms are then plotted on the phasor plot. The two component algorithm used to calculate the g and s coordinates for the phasor plot are presented below where i and j represent the position of a pixel within the data points. ω is the frequency where ω = 2πf. In the frequency calculation, f is the repetition rate of the laser (often 80 MHz). The coordinate `g' represents the x-axis while the coordinate `s' represents the y-axis.
| (1) |
The universal circle is a semi circle within the phasor plot which represents all of the possible single exponential lifetimes which may be calculated using equation 2 where τ is the lifetime of the component and ω is the frequency of the laser.
| (2) |
For a multi-exponential lifetime, within the distribution plot of the phasor the lifetimes appear as a linear combination of the expected single exponential lifetimes, making the plot lie inside the universal circle. For the multiple component analysis, the coordinates for the phasor are identified by the following expression where hk is the contribution of each single exponential component to the identified lifetime (τk) based on intensity.
| (3) |
Acknowledgements
Financial support (EG, CS and MAD) was provided by NIH Grants P41-RR03155, P41 GM103540 and P50 GM076516. We would like to acknowledge M. Stakic for culturing the cells.
References
- Currie WD, Davidian NM, Elliott WB, Rodman NF, Penniall R. Respiratory activity of isolated mammalian nuclei. III. The reduced nicotinamide adenine dinucleotide oxidase of rat liver nuclei and nucleoli. Archives of Biochemistry and Biophysics. 1966;113(1):156–166. doi: 10.1016/0003-9861(66)90169-x. [DOI] [PubMed] [Google Scholar]
- Digman MA, Caiolfa VR, Zamai M, Gratton E. The phasor approach to fluorescence lifetime imaging analysis. Biophysical Journal. 2008;94(2):L14–L16. doi: 10.1529/biophysj.107.120154. [DOI] [PMC free article] [PubMed] [Google Scholar]
- Fjeld CC, Birdsong WT, Goodman RH. Differential binding of NAD+ and NADH allows the transcriptional corepressor carboxyl-terminal binding protein to serve as a metabolic sensor. Proceedings of the National Academy of Sciences of the United States of America. 2003;100(16):9202–9207. doi: 10.1073/pnas.1633591100. [DOI] [PMC free article] [PubMed] [Google Scholar]
- Ghosh S, George S, Roy U, Ramachandran D, Kolthur-Seetharam U. NAD: A master regulator of transcription. Biochimica et Biophysica Acta - Gene Regulatory Mechanisms. 2010;1799(10–12):681–693. doi: 10.1016/j.bbagrm.2010.08.002. [DOI] [PubMed] [Google Scholar]
- Gratton E, Jameson DM, Hall RD. Multifrequency phase and modulation fluorometry. Annual review of biophysics and bioengineering. 1984a;13:105–124. doi: 10.1146/annurev.bb.13.060184.000541. [DOI] [PubMed] [Google Scholar]
- Gratton E, Limkeman M, Lakowicz JR, Maliwal BP, Cherek H, Laczko G. Resolution of mixtures of fluorophores using variable-frequency phase and modulation data. Biophysical Journal. 1984b;46(4):479–486. doi: 10.1016/S0006-3495(84)84044-8. [DOI] [PMC free article] [PubMed] [Google Scholar]
- Heikal AA. Intracellular coenzymes as natural biomarkers for metabolic activities and mitochondrial anomalies. Biomarkers in Medicine. 2010;4(2):241–263. doi: 10.2217/bmm.10.1. [DOI] [PMC free article] [PubMed] [Google Scholar]
- Huang S, Heikal AA, Webb WW. Two-photon fluorescence spectroscopy and microscopy of NAD(P)H and flavoprotein. Biophysical Journal. 2002;82(5):2811–2825. doi: 10.1016/S0006-3495(02)75621-X. [DOI] [PMC free article] [PubMed] [Google Scholar]
- Kim JH, Cho EJ, Kim ST, Youn HD. CtBP represses p300-mediated transcriptional activation by direct association with its bromodomain. Nature Structural and Molecular Biology. 2005;12(5):423–428. doi: 10.1038/nsmb924. [DOI] [PubMed] [Google Scholar]
- Lejeune E, Ladurner AG. Hitting transcription in all the right places. Nature Structural and Molecular Biology. 2005;12(5):390–392. doi: 10.1038/nsmb0505-390. [DOI] [PubMed] [Google Scholar]
- Lin SJ, Guarente L. Nicotinamide adenine dinucleotide, a metabolic regulator of transcription, longevity and disease. Current Opinion in Cell Biology. 2003;15(2):241–246. doi: 10.1016/s0955-0674(03)00006-1. [DOI] [PubMed] [Google Scholar]
- Schultz BE, Chan SI. Structures and proton-pumping strategies of mitochondrial respiratory enzymes. 2001. pp. 23–65. [DOI] [PubMed] [Google Scholar]
- Skala MC, Riching KM, Gendron-Fitzpatrick A, Eickhoff J, Eliceiri KW, White JG, Ramanujam N. In vivo multiphoton microscopy of NADH and FAD redox states, fluorescence lifetimes, and cellular morphology in precancerous epithelia. Proceedings of the National Academy of Sciences of the United States of America. 2007;104(49):19494–19499. doi: 10.1073/pnas.0708425104. [DOI] [PMC free article] [PubMed] [Google Scholar]
- Stringari C, Cinquin A, Cinquin O, Digman MA, Donovan PJ, Gratton E. Phasor approach to fluorescence lifetime microscopy distinguishes different metabolic states of germ cells in a live tissue. Proceedings of the National Academy of Sciences. 2011;108(33):13582–13587. doi: 10.1073/pnas.1108161108. [DOI] [PMC free article] [PubMed] [Google Scholar]
- Van Munster B, Gadella T. Fluorescence Lifetime Imaging Microscopy (FLIM) Advanced Biochemical Engineering and Biotechnology. 2005;95:143–175. doi: 10.1007/b102213. [DOI] [PubMed] [Google Scholar]
- Wright BK, Andrews LM, Markham J, Jones MR, Stringari C, Digman MA, Gratton E. NADH Distribution in Live Progenitor Stem Cells by Phasor-Fluorescence Lifetime Image Microscopy. Biophysical Journal. 2012;103(1):L7–L9. doi: 10.1016/j.bpj.2012.05.038. [DOI] [PMC free article] [PubMed] [Google Scholar]