

Abstract
Background
Prior evidence suggests panic disorder (PD) is characterized by neurometabolic abnormalities, including increased brain lactate responses to neural activation. Increased lactate responses could reflect a general upregulation of metabolic responses to neural activation. However, prior studies in PD have not measured activity-dependent changes in brain metabolites other than lactate. Here we examine activity-dependent changes in both lactate and glutamate plus glutamine (glx) in PD.
Methods
Twenty-one PD patients (13 remitted, 8 symptomatic) and 12 healthy volunteers were studied. A single-voxel, J-difference, magnetic resonance spectroscopy editing sequence was used to measure lactate and glx changes in visual cortex induced by visual stimulation.
Results
PD patients had significantly greater activity-dependent increases in brain lactate than healthy volunteers. The differences were significant for both remitted and symptomatic PD patients, who did not differ from each other. Activity-dependent changes in glx were significantly smaller in PD patients than in healthy volunteers. The temporal correlation between lactate and glx changes was significantly stronger in control subjects than in PD patients.
Conclusions
The novel demonstration that glx responses are diminished and temporally decoupled from lactate responses in PD contradicts the model of a general upregulation of activity-dependent brain metabolic responses in PD. The increase in activity-dependent brain lactate accumulation appears to be a trait feature of PD. Given the close relationship between lactate and pH in the brain, the findings are consistent with a model of brain metabolic and pH dysregulation associated with altered function of acid-sensitive fear circuits contributing to trait vulnerability in PD.
Keywords: agoraphobia, anxiety disorders, lactic acid, acid-sensing, glutamatergic, neuroenergetics, monocarboxylate transporters
Introduction
Panic disorder with or without agoraphobia (PD) is a potentially disabling condition with lifetime prevalence greater than 5% in the United States (1). Although efficacy studies suggest good responses to medication or psychotherapy, effectiveness and naturalistic studies show that ≥70% of treatment-seeking PD patients remain ill for extended periods and relapse is common (2, 3). Family and twin studies reveal a substantial heritable component in PD (4, 5), but little is yet known about the specific neurobiological mechanisms mediating vulnerability to PD. A better understanding of these mechanisms could promote development of more widely effective treatments.
Many neurobiological models of panic disorder posit dysfunction of acid-sensitive circuits involved in respiratory and fear-related processing (6–10). Several clinical observations support this idea. PD patients frequently experience dyspnea and exhibit dysregulated respiration that persists during sleep and following remission (8, 11–13). PD patients are sensitive to panic-induction by agents that increase brain acidity or stimulate respiration (6, 7, 14–18). Evidence of the clinical relevance of panic-induction by these agents is particularly well-developed for sodium lactate infusions and CO2 inhalation (15, 19–26). Preclinical studies suggest that activation of acid-sensitive circuits could trigger panic attacks (27). Many brain regions mediating fear and arousal responses contain neurons specifically activated by local increases in brain acidity, including amygdala, hypothalamus, bed nucleus of the stria terminalis, periaqueductal gray, raphe nuclei, locus ceruleus, and anterior cingulate cortex (28–31).
Proton magnetic resonance spectroscopy (1H-MRS) studies have demonstrated excess brain lactate accumulation in response to hyperventilation and lactate infusions in PD patients (32–34). Since both these challenge protocols can cause cerebral vasoconstriction, the exaggerated lactate responses could result from cerebral hypoxia. In contrast, sensory stimulation evokes local cerebral vasodilation and hyperoxia accompanied by local increases in brain lactate and glutamate (35–38). We recently showed that symptomatic PD patients have exaggerated visual cortex lactate responses to visual stimulation. This finding contradicts the hypothesis that hypoxia mediates the increased lactate response in PD and suggests an intrinsic disturbance of activity-dependent brain metabolism involving either increased production or decreased removal of lactate in PD (39). Both the production and removal of brain lactate are closely coupled with mechanisms regulating dynamic changes in brain pH (40–46). Acid-sensitive neurons play an essential role in autonomic and fear-related processing (27, 41). Thus, excess brain lactate accumulation may be associated with a disturbance of pH dynamics having pathogenic significance in PD.
Lactate responses to neural activation are driven largely by the energy requirements of glutamatergic neurotransmission, including the glutamate-glutamine cycle (47). It is possible that an increase in these energy requirements is responsible for the elevated brain lactate responses in PD. Our prior study showing increased lactate responses to visual stimulation in PD did not include measures of any other activity-dependent brain metabolic responses. In addition to lactate, neural activation also evokes an MRS-visible increase in glutamate or glx (the combined signal from glutamate and glutamine) (48–52). If greater overall metabolic demand during neural activation drives increased brain lactate responses in PD, then both lactate and glx responses to visual stimulation should be increased in PD patients. Alternatively, if increased brain lactate accumulation has a different cause, such as selectively increased production or decreased metabolic removal of lactate, then increased activity-dependent glx responses would not be expected in PD patients. The current study examines this question by measuring visual stimulation-induced changes in both lactate and glx in the primary visual cortex in PD patients. The study also tests the hypothesis that increased activity-dependent brain lactate responses are a trait feature of PD.
Methods and Materials
Subjects
Twenty-three patients with a current or past primary diagnosis of PD (thirteen remitted, ten symptomatic) and thirteen healthy volunteers matched for gender, age, and education, were recruited from the University of California Davis outpatient psychiatry clinic and via advertisement. The study was approved by the UC Davis IRB. All subjects gave written informed consent. A psychiatrist (RJM) evaluated all subjects using the Structured Clinical Interview for DSM-IV (53). All patients were assessed with the clinician-rated Panic and Agoraphobia Scale (PAS) (54) and completed the patient-rated Anxiety Sensitivity Index (ASI) (55) and Mobility Inventory for Agoraphobia (MIA) (56). Remitted PD patients were free of panic attacks and other significant PD symptoms for at least 4 months.
Experimental Procedures
Following habituation to a “mock” scanner (39), subjects entered the MRI scanner for anatomical scans followed by a 28.8 minute 1H-MRS acquisition. During the first 6.2 minutes of scanning, subjects rested with eyes closed. During the subsequent 10.6 minutes, subjects watched a black and white radial checkerboard undergoing 8 Hz pattern reversal flicker (39). Subjects pressed a button when the checkerboard transiently changed shape, which occurred 43 times. This embedded vigilance task was intended to engage and monitor subjects’ attention to the stimulus. For 12 minutes following stimulus offset, subjects were scanned with eyes closed. Anxiety was rated with the Acute Panic Inventory (API) (57) and the State Anxiety Inventory (SA) (58) immediately before scanning and post-scanning retrospectively for the period of visual stimulation. End-tidal pCO2 was recorded throughout scanning using a face mask connected to an infrared capnometer (59).
MRI Methods
Data were acquired with a 1.5 Tesla MRI system (Signa Horizon NV/i; GE Medical Systems, Milwaukee, WI) using a 3-inch surface coil positioned under the occiput. Sagittal T1 and axial T2 FSE scans were acquired for localization. A single-voxel 1H-MRS scan was acquired using an interleaved, J-editing sequence (60, 61) incorporating a PRESS sequence with TE 144 ms, TR 1500 ms, and phase cycling 8 (51, 62). Frames (each consisting of eight acquisitions) acquired with a BASING (band selective inversion with gradient dephasing) pulse (“BASING frames”) were interleaved with frames acquired with a CHESS (chemical-shift selective saturation) pulse (“CHESS frames”). The CHESS water suppression pulse sequence (bandwidth = 75 Hz (0.61 ppm)) is centered on the 4.67 ppm water peak. The BASING pulse excitation band (bandwidth = 180 Hz (1.46 ppm)) is centered on the 4.1 ppm lactate methine quartet. At TE=144 msec, the lactate doublet is upright during BASING frames and inverted during CHESS frames. Both BASING and CHESS pulses provide excellent water suppression. Subtracting CHESS frame spectra from BASING frame spectra suppressed signals from lipid and most metabolites while retaining the lactate signal (Figure 1). 1H-MRS data from primary visual cortex were acquired from a 30×25×25 mm voxel centered on bilateral calcarine fissures. For all but five subjects, a 3D-SPGR high-resolution scan of the brain was obtained for segmentation of the MRS voxel immediately after 1H-MRS data collection (procedures described in Supplement 1).
Figure 1.

MR spectra from a representative PD patient acquired with the interleaved J-editing sequence at TE=144 msec. Top spectrum is acquired with a conventional PRESS sequence incorporating CHESS water suppression. Note the small inverted lactate methyl peak at 1.33 ppm. Middle spectrum is acquired with the BASING editing pulse applied to the 4.1 ppm methine resonance of lactate. The editing pulse prevents inversion of the lactate methyl doublet, thus it is upright at 1.33 ppm. Bottom tracing shows the difference spectrum (scaled 2x) obtained by subtracting the CHESS spectrum (top trace) from the BASING spectrum (middle trace) (see text). The upright lactate doublet is clearly evident at 1.33 ppm. Horizontal bars show frequency range used for peak integration of lactate and NAA signals. Inset shows voxel location.
Data Processing and Analysis
The lactate increase lags the onset of visual stimulation by about 36 seconds (39). Thus, we defined five time periods for analysis: “baseline” (initial 6.2 minutes with eyes closed), “visual stimulation 1” (VS1, 5 minutes of visual stimulation after the initial 36 seconds of stimulation), “visual stimulation 2” (VS2, 5 minutes of visual stimulation after VS1), “recovery 1” (RC1, 6 minutes of rest after VS2), and “recovery 2” (RC2, 6 minutes of rest after RC1). For lactate quantification, MRUI software (63) was used to zero-fill and phase-align individual frames of MRS data, which were then summed across the time periods of interest and apodized with a 4 Hz Gaussian filter. After setting the NAA peak frequency to 2.01 ppm, an automated peak integration algorithm quantified lactate at 1.33 (±0.15) ppm in the difference spectrum. LCModel software (64) and the canonical basis set from 1.0 to 4.0 ppm (including NAA, creatine, choline, glutamate, glutamine, myo-inositol, scyllo-inositol, lactate, alanine, and guanidinoacetate) were used to quantify NAA, creatine and glx from the CHESS spectra only. A prior 3T study suggested that 144 msec is a reasonable TE when estimating glx with LCModel (65).
Lactate and glx responses result from neuronal activation. For this reason, lactate and glx were quantified relative to NAA (a marker of neuronal functional integrity (66)) for our primary analyses, as in our prior dynamic MRS studies (39, 67). Lactate and glx were normalized to creatine for secondary analyses. The percent changes in lactate and glx from baseline were quantified for VS1, VS2, RC1 and RC2 and analyzed with repeated measures analysis of variance (rANOVA). These were conducted as two-group analyses (all PD patients and controls) and as three-group analyses (remitted PD, symptomatic PD, and controls). Significant group or interaction effects involving 3 groups were followed by subgroup rANOVAs. End-tidal pCO2 data were quantified by a blinded rater using a semi-automated algorithm implemented in LabView software (National Instruments, Austin, Tx). Percent change from baseline end-tidal pCO2 during VS1, VS2, RC1, and RC2 was analyzed using rANOVA. Other three-group comparisons were made by ANOVA followed by unpaired t-tests. Other two-group comparisons were made using unpaired t-tests (all alphas = .05 two-tailed).
Results
Comorbid diagnoses in symptomatic PD patients included agoraphobia (nine), generalized anxiety disorder (three) and social phobia (two). Past diagnoses in the symptomatic and remitted PD patients included other anxiety disorders, major depression, substance abuse, and anorexia nervosa (full listing in Supplement 1). No subjects had taken psychiatric medications for at least 6 weeks prior to scanning, except as follows: Four remitted patients were taking selective serotonin reuptake inhibitor (SSRI) monotherapy, and two patients (one remitted and one symptomatic) took low dose alprazolam twice weekly or less (most recent dose ≥ four days before scanning). Subjects were otherwise free of illnesses and medications affecting brain, vascular, metabolic, or respiratory function. One control subject admitted taking a psychostimulant on the scanning day and was excluded from the analysis. Two symptomatic patients were unable to remain still, displaying gross limb and truncal movements during the MRS acquisition. Their MRS data were unusable and were excluded from analysis. These exclusions yielded a sample size of 33 subjects (13 remitted patients, 8 symptomatic patients and 12 controls).
Demographic, rating scale and baseline measures are shown in Table 1. Groups were well matched demographically, with more severe PD-related symptoms in the symptomatic patients. There were no group differences in pre-scan or baseline values of any biological measures, except for a lower baseline visual cortex NAA/creatine ratio in PD patients compared to control subjects.
Table 1.
Demographic, clinical and baseline data
| All PD Patients | Remitted PD | Symptomatic PD | Controls | ||
|---|---|---|---|---|---|
| N | 21 | 13 | 8 | 12 | |
| Female (%) | 14 (67) | 9 (75) | Fisher test, NS | ||
| 3 groups | 8 (62) | 6 (75) | 9 (75) | Fisher test, NS | |
| Age (yrs) | 38.7 (11.3) | 38.4 (8.7) | t=.08, df 31, NS | ||
| 3 groups | 41.7 (11.5) | 33.9 (9.7) | 38.4 (8.7) | F=1.49, df 2,30, NS | |
| Education (yrs) | 15.7 (2.5) | 15.4 (1.6) | t=0.2, df 31, NS | ||
| 3 groups | 16.0 (2.2) | 14.9 (2.0) | 15.4 (1.6) | F=0.8, df 2,30, NS | |
| PAs/week | 0 (0) | 2.1 (1.5) | t=5.17, df 19, P<.0001 | ||
| ASI | 41.8 (13.1) | 55.0 (14.6) | 24.0 (5.0) | F=18.9, df 2,30, P<.0001, abc | |
| PAS | 3.6 (4.9) | 19.9 (8.0) | t=5.67, df 18, P<.0001 | ||
| MIA Alone | 1.4 (0.4) | 2.5 (0.7) | t=4.65, df 19, P<.0002 | ||
| MIA Accompanied | 1.1 (0.1) | 1.9 (0.6) | t=4.82, df 19, P<.0001 | ||
| Pre-scan SAI | 34.7 (9.5) | 31.0 (5.9) | 25.2 (6.2) | F=4.5, df 2,30, P=.015, a | |
| Pre-scan API | 1.3 (2.2) | 0.8 (1.0) | 0.3 (0.7) | F=1.26, df 2,30, NS | |
| Baseline Lac/NAA | .077 (.013) | .079 (.010) | t=0.35, df 31, NS | ||
| 3 groups | .080 (.015) | .077 (.009) | .079 (.010) | F=0.1, df 2,30, NS | |
| Baseline Lac/Cr | .164 (.028) | .176 (.025) | t=1.27, df 31, NS | ||
| 3 groups | .162 (.034) | .166 (.016) | .176 (.025) | F=0.83, df 2,30, NS | |
| Baseline Glx/NAA | .47 (.08) | .44 (.07) | t=1.1, df 31, NS | ||
| 3 groups | .46 (.09) | .48 (.06) | .44 (.07) | F=0.2, df 2,30, NS | |
| Baseline Glx/Cr | .99 (.17) | .97 (.16) | t=0.2, df 31, NS | ||
| 3 groups | .95(.19) | 1.04 (.13) | .97 (.16) | F=0.64, df 2,30, NS | |
| Baseline NAA/Cr | 2.11 (.15) | 2.23 (.13) | t=2.22, df 31, P<.05 | ||
| 3 groups | 2.09 (.15) | 2.16 (.15) | 2.23 (.13) | F=2.9, df 2,30, NS | |
| Baseline Cr/H2O | 5.91 (1.2) | 5.97 (1.3) | t=0.12, df 31, NS | ||
| 3 groups | 6.37 (1.1) | 5.18 (1.2) | 5.97 (1.3) | F=2.48, df 2,30, NS | |
| Baseline pCO2 | 35.7 (4.0) | 35.1 (3.5) | t=0.39, df 23, NS | ||
| 3 groups | 36.9 (3.2) | 35.0 (4.5) | 35.1 (3.5) | F=0.5, df 2,22, NS |
R-PD vs C, P< .05;
S-PD vs C, P<.05;
S-PD vs. R-PD, P<.05 (R = remitted panic disorder, S = symptomatic panic disorder, C = controls).
PAs/wk = panic attacks per week; ASI = Anxiety Sensitivity Index; PAS = Panic and Agoraphobia Scale; MIA = Mobility Inventory for Agoraphobia; SAI = State Anxiety Inventory; API = Acute Panic Inventory; Lac = lactate; NAA = n-acetylaspartate; Cr = creatine; Glx = glutamate + glutamine; H2O = water signal measured at the end of the MRS acquisition; pCO2 = end-tidal partial pressure CO2 in mm Hg.
No subject reported a panic attack during data collection. Remitted, symptomatic, and control subjects achieved similar hit rates on the embedded vigilance task, F(2,27) =0.01, NS (three subjects’ data were lost). The mean LCModel estimate of signal-to-noise ratio for the CHESS spectra was 31 and did not differ between groups (F(2,30) =0.4, NS). Cramer-Rao lower bounds (CRLBs) reflecting the goodness of fit for LCModel estimates were ≤5% for all measurements of NAA (mean =2.2%), and creatine (mean =3.0%) (see example LCModel fits in Figure S1 in Supplement 1). The lactate doublet at 1.33 ppm was visible in all 33 subjects (Figure 1). There was a highly significant increase in visual cortex lactate/NAA during visual stimulation compared to baseline across groups (t(32) =4.9, p <.0001). Two subjects (one symptomatic PD and one control) exhibited unusual responses, showing large decreases in lactate during visual stimulation. These subjects had the most extreme modified Z-scores in our total sample (both Z < −3.5) and were considered outliers by the criteria of Iglewicz and Hoaglin (68). All MRS analyses were performed both with and without their data. Segmentation analysis of the MRS voxel showed no difference between patients and controls in gray matter, white matter or cerebrospinal fluid fractions of the MRS voxel, or in the gray/white ratio (all t ≤1.2, df=26, NS).
The two-group rANOVA of percent change from baseline lactate/NAA during visual stimulation and subsequent recovery periods (outliers excluded) showed a significant main effect of group, F(1,29) =11.76, p =.0018. This main effect was due to a larger percent increase in lactate across time in the patient group (15.7 ±11.7%) than the controls (1.3 ±10.1%) (effect size, Cohen’s d =1.32) (Figure 2A). Both groups showed elevated lactate during visual stimulation, but this effect was larger and persisted longer in the PD patients. Figure 3 shows the mean lactate doublet peaks before and during visual stimulation for both groups. The two-group rANOVA also showed a significant main effect for time (F(3,87) = 6.86, p = .0003) but no group by time interaction (F(3,87) =0.97, NS) (Figure 2A). Including outliers did not change any of the above results. Similar results were seen with the analogous three-group analysis, with both remitted (p =.003) and symptomatic (p =.023) PD patients having significantly greater increases in lactate/NAA than control subjects (Table 2). Effect sizes (d) were similar in remitted (1.36) and symptomatic (1.19) patients. This indicates that increased activity-dependent brain lactate accumulation is similarly present during active illness and clinical remission in PD. All above results were unchanged when outliers were included, except that the difference between symptomatic PD and control groups no longer reached significance. When excluding the four PD patients on SSRI monotherapy, the difference between remitted patients and control subjects remained significant (p =.016, Cohen’s d =1.17). The pattern of statistical findings reported above was unchanged when using lactate/creatine ratios (Table 2). There were no significant correlations between our clinical measures and the total lactate response over time in PD patients.
Figure 2.

Percent change from baseline in visual cortex Lactate/NAA (A) and Glx/NAA (B) during and after visual stimulation. VS1 and VS2 are consecutive five-minute periods of visual stimulation. RC1 and RC2 are consecutive six-minute periods of eyes closed rest immediately after visual stimulation. Group means and s.e.m. are shown. (A) Analysis of lactate/NAA changes showed a significant main effect of group (F(1,29) =11.76, p =.0018). (B) Analysis of glx/NAA changes showed a significant main effect of time (F(3,87) =5.02, p =.0029) and a significant group by time interaction (F(3,87) =4.70, p =.0043).
Figure 3.
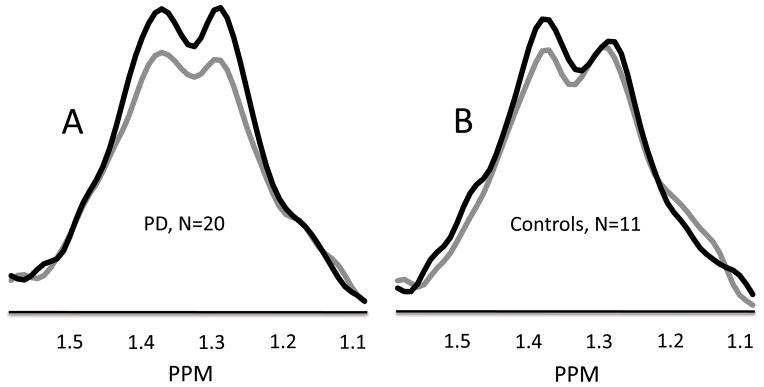
Group mean MR spectral data from 1.59 to 1.07 ppm shows the lactate doublet centered at 1.33 ppm for N=20 PD patients (A) and N=11 control subjects (B). Grey lines show the lactate doublet during the baseline condition with eyes closed. Black lines show the lactate doublet during 10 minutes of visual stimulation (VS1 and VS2). Data from individual subjects were normalized to their NAA signal intensity values prior to calculating group means.
Table 2.
Percent changes from baseline during and after visual stimulation
| VS1 | VS2 | RC1 | RC2 | F (df) | P | ||
|---|---|---|---|---|---|---|---|
|
| |||||||
| Lac/NAA | |||||||
| Control | +8.2 (15) | +9.3 (18) | −1.6 (13) | −10.6 (14) | G (3) | 5.78 (2,28) | .008 a,b,c |
| R-PD | +21.2 (26) | +20.0 (12) | +11.6 (19) | +13.1 (19) | T | 7.42 (3,84) | .0002 |
| S-PD | +12.6 (12) | +31.0 (15) | +4.5 (16) | +9.4 (23) | GxT | 1.28 (6,84) | NS |
|
| |||||||
| Lac/Cr | G (2) | 11.22 (1,29) | .002 | ||||
| Control | +6.7 (14) | +8.2 (20) | −0.2 (14) | −10.7 (16) | T | 5.88 (3,87) | .001 |
| All PD | +18.7 (24) | +22.9 (14) | +9.2 (18) | +11.8 (19) | GxT | 0.77 (3,87) | NS |
| G (3) | 5.65 (2.28) | .009 a,b,c | |||||
| R-PD | +21.8 (29) | +19.2 (14) | +12.4 (19) | +13.9 (19) | T | 6.60 (3,84) | .0005 |
| S-PD | +12.9 (12) | +29.8 (11) | +3.4 (16) | +8.0 (20) | GxT | 1.22 (6,84) | NS |
|
| |||||||
| Glx/NAA | |||||||
| Control | +8.6 (11) | +5.7 (18) | −5.3 (15) | −13.4 (14) | G (3) | 0.16 (2,28) | NS |
| R-PD | +5.2 (18) | +1.1 (14) | −0.3 (25) | −4.7 (25) | T | 2.53 (3,84) | .062 |
| S-PD | +1.8 (21) | +1.1 (23) | +0.5 (17) | −0.2 (15) | GxT | 2.41 (6,84) | .034 d |
|
| |||||||
| Glx/Cr | G (2) | 0.49 (1,29) | NS | ||||
| Control | +7.0 (10) | +3.9 (15) | −5.8 (14) | −13.8 (13) | T | 5.32 (3,87) | .002 |
| All PD | +4.2 (19) | −0.5 (16) | −0.4 (20) | +2.9 (21) | GxT | 5.13 (3,87) | .003 |
| G (3) | 0.29 (2.28) | NS | |||||
| R-PD | +5.1 (17) | −0.8 (14) | −0.2 (22) | +5.2 (24) | T | 2.94 (3,84) | .038 |
| S-PD | +2.4 (23) | +0.1 (21) | −0.8 (17) | −1.2 (14) | GxT | 2.68 (6,84) | .020 d |
|
| |||||||
| NAA/Cr | G (2) | 0.50 (1,29) | NS | ||||
| Control | −1.3 (4) | −1.3 (4) | −0.4 (3) | −0.3 (3) | T | 0.68 (3,87) | NS |
| All PD | +0.2 (3) | −0.8 (3) | +0.1 (4) | +0.1 (3) | GxT | 0.24 (3,87) | NS |
|
| |||||||
| pCO2 | G (2) | 3.24 (1,23) | .085 | ||||
| Control | −3.2 (5) | −5.5 (6) | −4.4 (6) | −2.9 (6) | T | 1.30 (3,69) | NS |
| All PD | −0.2 (2) | −0.8 (4) | −0.5 (6) | −0.3 (7) | GxT | 0.53 (3,69) | NS |
| G (3) | 1.56 (2,22) | NS | |||||
| R-PD | −0.7 (2) | −1.0 (5) | −0.1 (5) | +0.4 (4) | T | 0.78 (3,66) | NS |
| S-PD | +0.5 (3) | −0.6 (3) | −1.3 (9) | −1.5 (11) | GxT | 0.67 (6,66) | NS |
VS1 and VS2 = 1st and 2nd visual stimulation periods; RC1 and RC2 = 1st and 2nd post-stimulation recovery periods; G (2) =group effect from 2 group rANOVA (results for Lac/NAA and Glx/NAA are shown in Figure 2); G (3) =group effect from 3 group rANOVA; T =time effect; GxT =group by time interaction; other abbreviations as in Table 1.
R-PD > C, P<.005;
S-PD>C, P≤.025;
R-PD vs. S-PD, NS;
GxT interaction was significant for R-PD vs. C (P ≤.008), trend for S-PD vs C (P ≤.076), and NS for R-PD vs. S-PD.
Glx estimates using LCModel had CRLBs ranging from 10% to 22% (mean CRLB =15.2%). There were no effects of group, time, or group by time interactions for glx CRLBs. The two-group rANOVA of percent change from baseline glx/NAA showed a significant main effect of time, F(3,87) =5.02, p =.0029 and a significant group by time interaction, F(3,87) =4.70, p =.0043 (Figure 2B). There was no main effect of group, F(1,29) =0.28. The significant main effect of time reflected glx increasing above baseline to a peak during VS1 and then steadily decreasing below baseline, reaching its lowest point during RC2. The group by time interaction reflected this pattern of glx changes over time being significantly larger in the control group than in patients (Figure 2B). The main effect of time could be simplified to a single value by calculating the difference between VS1 and RC2. This value was significantly greater in control subjects than in patients (+22.0% (±20%) and +1.0% (±18%), respectively, t(29) =3.0, p =.006). These results were unchanged when outliers were included. A significant group by time interaction was also seen in the three-group rANOVA (Table 2). Including outliers in the three-group analysis reduced the interaction effect to a trend. All significant findings noted above were also observed when normalizing glx to creatine (Table 2).
The temporal association between activity-dependent changes in lactate/NAA and glx/NAA was examined by calculating the correlation between the percent change values of the two metabolites over the four time periods, within each subject. The correlation coefficient (r) for each subject was converted to a z-value, based on the probability distribution of r. The resulting z-values were significantly higher in control subjects than PD patients (means = 0.83 (±.64) and 0.03 (±.82), respectively, t(29) =2.76, p <.01) (see Supplement 1). The z-values were significantly greater than zero in control subjects (t(10) =4.28, p =.0016) but not in patients (t(19) =0.19, NS).
The two-group rANOVA of percent change in end-tidal pCO2 showed a trend toward a main effect for group, with the control group trending toward a greater overall decrease in pCO2 than the patient group. There were no other significant effects or trends in the pCO2 data (Table 2). Complete end-tidal pCO2 data were unavailable in 8 subjects (3 remitted, 2 symptomatic, and 3 controls) due to technical problems or intolerance of the mask. Since hypocapnia can increase brain lactate levels, the lactate analyses were repeated including only subjects for whom complete pCO2 data were available. All significant group differences in lactate values reported above remained significant.
Significant group effects were seen for the change in State Anxiety (SA) and Acute Panic Inventory (API) ratings from pre-scan to visual stimulation (F(2,29) =5.9, p =.007; F(2,29) =15.3, p <.0001, respectively). In both cases, anxiety increased significantly more in symptomatic patients than both remitted patients and controls (SA: +13.7 (7.7), +1.8 (8.7), and +1.9 (5.9); API: +7.5 (3.0), +2.3 (2.9), and +0.8 (1.6) respectively). Remitted patients and controls did not differ.
Discussion
Activity-dependent changes in brain lactate and glx were abnormal in symptomatic and remitted PD patients. The findings extend prior studies showing elevated brain lactate responses to metabolic challenge in PD and represent the first report of abnormal glx responses in PD. The J-difference editing sequence used here permits a more specific measure of brain lactate than conventional pulse sequences used on clinical MR systems. Recent studies using high field scanners have shown a 10% to 23% increase in visual cortex lactate during visual stimulation (35, 36). Similarly, the increase in visual cortex lactate here averaged 15% across groups. The effect size for the difference between PD patients and controls (1.28) in the current study is similar to that reported in our prior study of visual stimulation (1.08) (39) and similar to that reported in two prior lactate infusion studies (0.9 and 1.67) (32, 33), suggesting that abnormal brain lactate accumulation following metabolic challenge is a robust phenomenon in PD.
Since hypocapnia can increase lactate production (via disinhibition of phosphofructokinase), we monitored end-tidal pCO2 throughout scanning. There were no group differences in baseline pCO2 or subsequent pCO2 changes from baseline. Hypoxia can also increase brain lactate production. However, neural activation evokes local hyperoxia. Logically, the greater activity-dependent lactate accumulation observed in PD patients must result from a process that causes either increased lactate production or decreased lactate removal during neural activity. However, it cannot be attributed to either hypocapnia or hypoxia.
The glx signal reflects the total MRS-visible pool of glutamate plus glutamine, with minor contributions from GABA, glutathione, and other metabolites (66). Studies using 7T MRI systems can reliably distinguish between glutamate and glutamine, but this discrimination is less certain for lower field clinical MRI systems. Two recent 7T studies found that glutamate, but not glutamine, increased in the visual cortex during visual stimulation (35, 36). Mangia et al. reported that the change in glutamate was biphasic, increasing during stimulation and decreasing below baseline during the post-stimulation period. The initial increase in glutamate was attributed to elevated glycolytic and oxidative metabolism evoked by neural activation (35, 36). If increased activity-dependent brain lactate responses in PD reflect a general upregulation of the metabolic response to neural activation, then increased glx responses to visual stimulation would be predicted in PD. The current study observed a significant, biphasic, activity-dependent change in glx, similar in time-course to the glutamate response previously reported (36). However, the glx changes over time were significantly smaller in patients compared to control subjects. In addition, activity-dependent glx changes were temporally correlated with lactate changes in the control subjects but not in the patients, suggesting a decoupling of the two metabolic responses in PD. Taken together, our findings argue against the hypothesis that PD patients exhibit a generalized increase in activity-dependent brain metabolic responses. Alternative models of elevated brain lactate responses in PD, such as a selective increase in lactate production or a reduced rate of metabolic consumption of lactate, have not yet been tested experimentally.
Preclinical studies suggest potential mechanisms through which abnormal lactate responses could be associated with pH changes affecting acid-sensitive circuits involved in fear and arousal responses. During neural activation, substantial lactate is produced from glucose and glycogen in neurons and astrocytes (69, 70). Astrocytic lactate is transported into brain extracellular fluid (ECF) and taken up by nearby cells for removal by oxidation (37, 38, 41, 69, 71). Specific subtypes of monocarboxylate transporters (MCTs) mediate co-transport of lactate and H+ across astrocytic and neuronal cell membranes (41, 42, 45). MCT-mediated lactate transport is a key step in the metabolic removal of lactate, and it is directly coupled to pH dynamics and pH buffering mechanisms (40–46). Reduced activity of MCTs would be expected to cause an activity-dependent accumulation of brain lactate accompanied by a disturbance in local pH dynamics. Erlichman et al. recently showed that inhibition of the neuronal MCT in an acid-sensitive, brainstem respiratory nucleus caused a significant, pH-mediated, respiratory stimulation (41). Increased activity-dependent brain lactate responses in PD could be associated with an underlying abnormality that also alters pH dynamics, such as reduced activity of MCTs. Studies in mice have shown that activity-dependent pH decreases in the amygdala are an essential element of fear processing. Wemmie and colleagues demonstrated that knock-out or pharmacological blockade of an acid-sensing ion channel (ASIC1a) in mice substantially reduced both conditioned and innate fear responses and blocked the fear response to CO2 inhalation (28, 72–74). Use of viral vectors to express ASIC1a locally in the amygdala restored these responses (74). In addition to amygdala, acid-sensitive circuits are present in other brain regions potentially relevant to PD, including hypothalamus, bed nucleus of the stria terminalis, periaqueductal gray, raphe nuclei, locus ceruleus, and anterior cingulate cortex (28–31). Structural and functional abnormalities in many of these regions have been described in PD (75–81). These findings suggest potential mechanisms by which abnormal, activity-dependent, metabolic responses leading to increased lactate accumulation could be associated with altered functioning of acid-sensitive circuits that could underlie increased vulnerability to panic symptoms in PD patients.
Elevated activity-dependent brain lactate accumulation was similarly present in our symptomatic and remitted PD patients. Thus, the elevated brain lactate responses cannot be attributed to secondary effects of ongoing PD symptoms. Our findings suggest that elevated activity-dependent brain lactate accumulation is a trait feature of PD. A model that posits an enduring, trait vulnerability to PD requires an interacting mechanism that influences expression of the disorder. In this framework, we propose that PD patients have an underlying vulnerability to panic attacks and an additional pathogenic process that either activates or fails to inhibit overt expression of these attacks. Both would be influential in the typical presentation of symptomatic PD, with the former as an enduring trait and the latter as a state factor that varies over time and with treatment. From this perspective, our findings are consistent with the hypothesis that an underlying disturbance of activity-dependent brain pH dynamics causes trait vulnerability in PD, yet remains present during clinical remission.
There are important limitations to this study. Glx rather than glutamate was measured. However, the pool of glutamate and glutamine is largely integrated over a timescale of minutes (82, 83). Animal and ex-vivo studies combining MRS and biochemical measurements show that 20–30% of total glutamate is MRS-invisible at long echo times and suggest that vesicular glutamate represents the MRS-invisible compartment (84–88). Acquired with TE=144 msec, the current glx findings may reflect movement of glutamate between invisible and visible compartments, rather than changes in total glx. Glx is more accurately quantified at 3T than at 1.5T, where it can also include some GABA signal, and our CRLBs ranged up to 22%. However, we demonstrated consistent activity-dependent changes similar to those observed using 7T systems. Given the relatively small sample size, replication of these glx findings in PD is needed. Visual cortex was studied because it is a well-established model system for investigating activity-dependent changes in cortical metabolism. However, it is not involved in fear-related processing nor known to be acid-sensitive. Although Dager et al. found abnormal lactate accumulation in all brain regions examined, including the acid-sensitive anterior cingulate cortex in PD (32), higher field MRS studies targeting acid-sensitive brain regions are needed to substantiate the model described here.
To test the model of a general upregulation of activity-dependent brain metabolic responses in PD, we measured visual stimulation-induced changes in both lactate and glx. Our finding that glx responses were diminished and temporally decoupled from elevated lactate responses in PD contradicts this model. We replicated our prior finding of increased activity-dependent brain lactate responses in PD and showed that it appears to be a trait feature of PD, present in both symptomatic and remitted patients. Recent preclinical studies suggest that increased brain lactate accumulation could be associated with an abnormality affecting acid-sensitive circuits involved in respiratory, autonomic, and fear-related processing. If substantiated, then novel treatments targeting these circuits could have therapeutic value (27, 28, 51, 74, 89, 90).
Supplementary Material
Figure S1. An example spectrum and its LCModel fit is shown for a remitted PD patient (panel A) and for a control subject (panel B). The large area in the center of each panel shows three tracings: 1) the spectral data as acquired (black line); 2) the LCModel fit of the acquired spectral data (red line); and the LCModel baseline estimation (black line along the baseline of the spectral data). The small area above the spectral data shows the residual signal (black line), which illustrates how much the acquired spectral data deviates from the fit. Each spectrum was obtained from the interleaved CHESS frames acquired over a single 5-minute period of visual stimulation (see Methods). CHESS, chemical-shift selective saturation.
Figure S2. Each line illustrates the slope of the regression between changes in lactate over time (Y axis) and changes in glx over time (X axis) for each of the 20 PD patients (A) and each of the 11 control subjects (B) (outliers excluded). In the control subjects, all but two subjects show a positive slope. In the PD patients, there is no consistent relationship between change in lactate and change in glx over time. glx, glutamate + glutamine.
Acknowledgments
This research was supported by a grant from the National Institutes of Health (1R21MH076988) to RJM.
Footnotes
Financial Disclosures
Ms. Miller reports being a paid consultant for Forest Laboratories, but no other biomedical financial interests or potential conflicts of interest. All other authors report no biomedical financial interests or potential conflicts of interest.
Publisher's Disclaimer: This is a PDF file of an unedited manuscript that has been accepted for publication. As a service to our customers we are providing this early version of the manuscript. The manuscript will undergo copyediting, typesetting, and review of the resulting proof before it is published in its final citable form. Please note that during the production process errors may be discovered which could affect the content, and all legal disclaimers that apply to the journal pertain.
References
- 1.Grant BF, Hasin DS, Stinson FS, Dawson DA, Goldstein RB, Smith S, et al. The epidemiology of DSM-IV panic disorder and agoraphobia in the United States: results from the National Epidemiologic Survey on Alcohol and Related Conditions. The Journal of clinical psychiatry. 2006;67:363–374. doi: 10.4088/jcp.v67n0305. [DOI] [PubMed] [Google Scholar]
- 2.Bruce SE, Yonkers KA, Otto MW, Eisen JL, Weisberg RB, Pagano M, et al. Influence of psychiatric comorbidity on recovery and recurrence in generalized anxiety disorder, social phobia, and panic disorder: a 12-year prospective study. The American journal of psychiatry. 2005;162:1179–1187. doi: 10.1176/appi.ajp.162.6.1179. [DOI] [PMC free article] [PubMed] [Google Scholar]
- 3.Roy-Byrne PP, Craske MG, Stein MB, Sullivan G, Bystritsky A, Katon W, et al. A randomized effectiveness trial of cognitive-behavioral therapy and medication for primary care panic disorder. Arch Gen Psychiatry. 2005;62:290–298. doi: 10.1001/archpsyc.62.3.290. [DOI] [PMC free article] [PubMed] [Google Scholar]
- 4.Kendler KS, Gardner CO, Prescott CA. Panic syndromes in a population-based sample of male and female twins. Psychol Med. 2001;31:989–1000. doi: 10.1017/s0033291701004226. [DOI] [PubMed] [Google Scholar]
- 5.Knowles JA, Weissman MM. Panic disorder and agoraphobia. In: Oldham JM, Riba MB, editors. Review of Psychiatry. Washington, DC: American Psychiatric Press; 1995. pp. 383–404. [Google Scholar]
- 6.Coplan JD, Lydiard RB. Brain circuits in panic disorder. Biol Psychiatry. 1998;44:1264–1276. doi: 10.1016/s0006-3223(98)00300-x. [DOI] [PubMed] [Google Scholar]
- 7.Esquivel G, Schruers KR, Maddock RJ, Colasanti A, Griez EJ. Review: Acids in the brain: a factor in panic? J Psychopharmacol. 2010;24:639–647. doi: 10.1177/0269881109104847. [DOI] [PubMed] [Google Scholar]
- 8.Friedman SD, Mathis CM, Hayes C, Renshaw P, Dager SR. Brain pH response to hyperventilation in panic disorder: preliminary evidence for altered acid-base regulation. Am J Psychiatry. 2006;163:710–715. doi: 10.1176/ajp.2006.163.4.710. [DOI] [PubMed] [Google Scholar]
- 9.Klein DF. False suffocation alarms, spontaneous panics, and related conditions: an integrative hypothesis. Arch Gen Psychiatry. 1993;50:306–317. doi: 10.1001/archpsyc.1993.01820160076009. [DOI] [PubMed] [Google Scholar]
- 10.Maddock RJ. The lactic acid response to alkalosis in panic disorder: An integrative review. J Neuropsychiatry Clin Neurosci. 2001;13:22–34. doi: 10.1176/jnp.13.1.22. [DOI] [PubMed] [Google Scholar]
- 11.Burkhardt SC, Wilhelm FH, Meuret AE, Blechert J, Roth WT. Temporal stability and coherence of anxiety, dyspnea, and physiological variables in panic disorder. Biol Psychol. 2010;85:226–232. doi: 10.1016/j.biopsycho.2010.07.005. [DOI] [PMC free article] [PubMed] [Google Scholar]
- 12.Stein MB, Millar TW, Larsen DK, Kryger MH. Irregular breathing during sleep in patients with panic disorder. Am J Psychiatry. 1995;152:1168–1173. doi: 10.1176/ajp.152.8.1168. [DOI] [PubMed] [Google Scholar]
- 13.Wilhelm FH, Gerlach AL, Roth WT. Slow recovery from voluntary hyperventilation in panic disorder. Psychosom Med. 2001;63:638–649. doi: 10.1097/00006842-200107000-00017. [DOI] [PubMed] [Google Scholar]
- 14.Bradwejn J, LeGrand JM, Koszycki D, Bates JH, Bourin M. Effects of cholecystokinin tetrapeptide on respiratory function in healthy volunteers. Am J Psychiatry. 1998;155:280–282. doi: 10.1176/ajp.155.2.280. [DOI] [PubMed] [Google Scholar]
- 15.Cowley DS, Arana GW. The diagnostic utility of lactate sensitivity in panic disorder. Arch Gen Psychiatry. 1990;47:277–284. doi: 10.1001/archpsyc.1990.01810150077012. [DOI] [PubMed] [Google Scholar]
- 16.Lee YJ, Curtis GC, Weg JG, Abelson JL, Modell JG, Campbell KM. Panic attacks induced by doxapram. Biol Psychiatry. 1993;33:295–297. doi: 10.1016/0006-3223(93)90299-s. [DOI] [PubMed] [Google Scholar]
- 17.Olsson M, Ho HP, Annerbrink K, Thylefors J, Eriksson E. Respiratory responses to intravenous infusion of sodium lactate in male and female Wistar rats. Neuropsychopharmacology. 2002;27:85–91. doi: 10.1016/S0893-133X(02)00296-8. [DOI] [PubMed] [Google Scholar]
- 18.Uhde TW, Boulenger JP. Caffeine model of panic. In: Lerer B, Gershon S, editors. New directions in Affective Disorders. New York: Springer-Verlag; 1989. pp. 410–413. [Google Scholar]
- 19.Goetz RR, Klein DF, Gorman JM. Symptoms essential to the experience of sodium lactate-induced panic. Neuropsychopharmacology. 1996;14:355–366. doi: 10.1016/0893-133X(95)00147-6. [DOI] [PubMed] [Google Scholar]
- 20.Papp LA, Klein DF, Martinez J, Schneier F, Cole R, Liebowitz MR, et al. Diagnostic and substance specificity of carbon-dioxide-induced panic. The American journal of psychiatry. 1993;150:250–257. doi: 10.1176/ajp.150.2.250. [DOI] [PubMed] [Google Scholar]
- 21.Perna G, Bussi R, Allevi L, Bellodi L. Sensitivity to 35% carbon dioxide in patients with generalized anxiety disorder. The Journal of clinical psychiatry. 1999;60:379–384. doi: 10.4088/jcp.v60n0606. [DOI] [PubMed] [Google Scholar]
- 22.Talesnik B, Berzak E, Ben-Zion I, Kaplan Z, Benjamin J. Sensitivity to carbon dioxide in drug-naive subjects with post-traumatic stress disorder. Journal of psychiatric research. 2007;41:451–454. doi: 10.1016/j.jpsychires.2005.11.008. [DOI] [PubMed] [Google Scholar]
- 23.Coryell W, Fyer A, Pine D, Martinez J, Arndt S. Aberrant respiratory sensitivity to CO(2) as a trait of familial panic disorder. Biol Psychiatry. 2001;49:582–587. doi: 10.1016/s0006-3223(00)01089-1. [DOI] [PubMed] [Google Scholar]
- 24.Coplan JD, Liebowitz MR, Gorman JM, Fyer AJ, Dillon DJ, Campeas RB, et al. Noradrenergic function in panic disorder. Effects of intravenous clonidine pretreatment on lactate induced panic. Biol Psychiatry. 1992;31:135–146. doi: 10.1016/0006-3223(92)90200-j. [DOI] [PubMed] [Google Scholar]
- 25.Gorman JM, Levy GF, Liebowitz MR, McGrath P, Appleby IL, Dillon DJ, et al. Effect of acute beta-adrenergic blockade on lactate-induced panic. Arch Gen Psychiatry. 1983;40:1079–1082. doi: 10.1001/archpsyc.1983.01790090041006. [DOI] [PubMed] [Google Scholar]
- 26.Perna G, Bertani A, Caldirola D, Gabriele A, Cocchi S, Bellodi L. Antipanic drug modulation of 35% CO2 hyperreactivity and short-term treatment outcome. J Clin Psychopharmacol. 2002;22:300–308. doi: 10.1097/00004714-200206000-00011. [DOI] [PubMed] [Google Scholar]
- 27.Wemmie JA. Neurobiology of panic and pH chemosensation in the brain. Dialogues Clin Neurosci. 2011;13:475–483. doi: 10.31887/DCNS.2011.13.4/jwemmie. [DOI] [PMC free article] [PubMed] [Google Scholar]
- 28.Coryell MW, Ziemann AE, Westmoreland PJ, Haenfler JM, Kurjakovic Z, Zha XM, et al. Targeting ASIC1a reduces innate fear and alters neuronal activity in the fear circuit. Biol Psychiatry. 2007;62:1140–1148. doi: 10.1016/j.biopsych.2007.05.008. [DOI] [PubMed] [Google Scholar]
- 29.Ito Y, Oyamada Y, Okada Y, Hakuno H, Aoyama R, Yamaguchi K. Optical mapping of pontine chemosensitive regions of neonatal rat. Neurosci Lett. 2004;366:103–106. doi: 10.1016/j.neulet.2004.05.035. [DOI] [PubMed] [Google Scholar]
- 30.Richerson GB. Serotonergic neurons as carbon dioxide sensors that maintain pH homeostasis. Nat Rev Neurosci. 2004;5:449–461. doi: 10.1038/nrn1409. [DOI] [PubMed] [Google Scholar]
- 31.Severson CA, Wang W, Pieribone VA, Dohle CI, Richerson GB. Midbrain serotonergic neurons are central pH chemoreceptors. Nat Neurosci. 2003;6:1139–1140. doi: 10.1038/nn1130. [DOI] [PubMed] [Google Scholar]
- 32.Dager SR, Friedman SD, Heide A, Layton ME, Richards T, Artru A, et al. Two-dimensional proton echo-planar spectroscopic imaging of brain metabolic changes during lactate-induced panic. Arch Gen Psychiatry. 1999;56:70–77. doi: 10.1001/archpsyc.56.1.70. [DOI] [PubMed] [Google Scholar]
- 33.Dager SR, Richards T, Strauss W, Artru A. Single-voxel 1H-MRS investigation of brain metabolic changes during lactate-induced panic. Psychiatry Res. 1997;30:89–99. doi: 10.1016/s0925-4927(97)00066-8. [DOI] [PubMed] [Google Scholar]
- 34.Dager SR, Strauss WL, Marro KI, Richards TL, Metzger GD, AA A. Proton magnetic resonance spectroscopy investigation of hyperventilation in subjects with panic disorder and comparison subjects. Am J Psychiatry. 1995;152:666–672. doi: 10.1176/ajp.152.5.666. [DOI] [PubMed] [Google Scholar]
- 35.Lin Y, Stephenson MC, Xin L, Napolitano A, Morris PG. Investigating the metabolic changes due to visual stimulation using functional proton magnetic resonance spectroscopy at 7 T. J Cereb Blood Flow Metab. 2012 doi: 10.1038/jcbfm.2012.33. [DOI] [PMC free article] [PubMed] [Google Scholar]
- 36.Mangia S, Tkac I, Gruetter R, Van de Moortele PF, Maraviglia B, Ugurbil K. Sustained neuronal activation raises oxidative metabolism to a new steady-state level: evidence from 1H NMR spectroscopy in the human visual cortex. J Cereb Blood Flow Metab. 2007;27:1055–1063. doi: 10.1038/sj.jcbfm.9600401. [DOI] [PubMed] [Google Scholar]
- 37.Hu Y, Wilson GS. A temporary local energy pool coupled to neuronal activity: Fluctuations of extracellular lactate levels in rat brain monitored with rapid-response enzyme-based sensor. J Neurochem. 1997;69:1484–1490. doi: 10.1046/j.1471-4159.1997.69041484.x. [DOI] [PubMed] [Google Scholar]
- 38.Prichard J, Rothman D, Novotny E, Petroff O, Kuwabara T, Avison M, et al. Lactate rise detected by 1H NMR in human visual cortex during physiologic stimulation. Proc Natl Acad Sci USA. 1991;88:5829–5831. doi: 10.1073/pnas.88.13.5829. [DOI] [PMC free article] [PubMed] [Google Scholar]
- 39.Maddock RJ, Buonocore MH, Copeland LE, Richards AL. Elevated brain lactate responses to neural activation in panic disorder: a dynamic 1H-MRS study. Mol Psychiatry. 2009;14:537–545. doi: 10.1038/sj.mp.4002137. [DOI] [PubMed] [Google Scholar]
- 40.Bergersen LH. Is lactate food for neurons? Comparison of monocarboxylate transporter subtypes in brain and muscle. Neuroscience. 2007;145:11–19. doi: 10.1016/j.neuroscience.2006.11.062. [DOI] [PubMed] [Google Scholar]
- 41.Erlichman JS, Hewitt A, Damon TL, Hart M, Kurascz J, Li A, et al. Inhibition of monocarboxylate transporter 2 in the retrotrapezoid nucleus in rats: a test of the astrocyte-neuron lactate-shuttle hypothesis. J Neurosci. 2008;28:4888–4896. doi: 10.1523/JNEUROSCI.5430-07.2008. [DOI] [PMC free article] [PubMed] [Google Scholar]
- 42.Hashimoto T, Hussien R, Cho HS, Kaufer D, Brooks GA. Evidence for the mitochondrial lactate oxidation complex in rat neurons: demonstration of an essential component of brain lactate shuttles. PLoS ONE. 2008;3:e2915. doi: 10.1371/journal.pone.0002915. [DOI] [PMC free article] [PubMed] [Google Scholar]
- 43.Klier M, Schuler C, Halestrap AP, Sly WS, Deitmer JW, Becker HM. Transport activity of the high-affinity monocarboxylate transporter MCT2 is enhanced by extracellular carbonic anhydrase IV but not by intracellular carbonic anhydrase II. J Biol Chem. 2011;286:27781–27791. doi: 10.1074/jbc.M111.255331. [DOI] [PMC free article] [PubMed] [Google Scholar]
- 44.Nguyen TT, Bonanno JA. Bicarbonate, NBCe1, NHE, and carbonic anhydrase activity enhance lactate-H+ transport in bovine corneal endothelium. Invest Ophthalmol Vis Sci. 2011;52:8086–8093. doi: 10.1167/iovs.11-8086. [DOI] [PMC free article] [PubMed] [Google Scholar]
- 45.Pierre K, Pellerin L. Monocarboxylate transporters in the central nervous system: distribution, regulation and function. J Neurochem. 2005;94:1–14. doi: 10.1111/j.1471-4159.2005.03168.x. [DOI] [PubMed] [Google Scholar]
- 46.Stridh MH, Alt MD, Wittmann S, Heidtmann H, Aggarwal M, Riederer B, et al. Lactate flux in astrocytes is enhanced by a non-catalytic action of carbonic anhydrase II. J Physiol. 2012;590:2333–2351. doi: 10.1113/jphysiol.2011.220152. [DOI] [PMC free article] [PubMed] [Google Scholar]
- 47.Pellerin L, Magistretti PJ. Excitatory amino acids stimulate aerobic glycolysis in astrocytes via an activation of the Na+/K+ ATPase. Dev Neurosci. 1996;18:336–342. doi: 10.1159/000111426. [DOI] [PubMed] [Google Scholar]
- 48.Gussew A, Rzanny R, Erdtel M, Scholle HC, Kaiser WA, Mentzel HJ, et al. Time-resolved functional 1H MR spectroscopic detection of glutamate concentration changes in the brain during acute heat pain stimulation. Neuroimage. 2010;49:1895–1902. doi: 10.1016/j.neuroimage.2009.09.007. [DOI] [PubMed] [Google Scholar]
- 49.Kim SY, Jang EJ, Hong KS, Lee C, Lee DW, Choi CB, et al. Acute restraint-mediated increases in glutamate levels in the rat brain: an in vivo (1)H-MRS study at 4.7 T. Neurochemical research. 2012;37:740–748. doi: 10.1007/s11064-011-0668-y. [DOI] [PubMed] [Google Scholar]
- 50.Kim SY, Lee YJ, Kim H, Lee DW, Woo DC, Choi CB, et al. Desipramine attenuates forced swim test-induced behavioral and neurochemical alterations in mice: an in vivo(1)H-MRS study at 9.4T. Brain Res. 2010;1348:105–113. doi: 10.1016/j.brainres.2010.05.097. [DOI] [PubMed] [Google Scholar]
- 51.Maddock RJ, Casazza GA, Buonocore MH, Tanase C. Vigorous exercise increases brain lactate and Glx (glutamate+glutamine) A dynamic 1H-MRS study. Neuroimage. 2011;57:1324–1330. doi: 10.1016/j.neuroimage.2011.05.048. [DOI] [PubMed] [Google Scholar]
- 52.Mullins PG, Rowland LM, Jung RE, Sibbitt WL., Jr A novel technique to study the brain’s response to pain: proton magnetic resonance spectroscopy. Neuroimage. 2005;26:642–646. doi: 10.1016/j.neuroimage.2005.02.001. [DOI] [PubMed] [Google Scholar]
- 53.First MB, Spitzer RL, Gibbon M, Williams JBW. Structured Clinical Interview for DSM-IV-TR Axis I Disorders, Research Version, Patient Edition With Psychotic Screen (SCID-I/P W/PSY SCREEN) New York: Biometrics Research New York State Psychiatric Institute; 2001. [Google Scholar]
- 54.Bandelow B. Assessing the efficacy of treatments for panic disorder and agoraphobia. II. The Panic and Agoraphobia Scale. Int Clin Psychopharmacol. 1995;10:73–81. doi: 10.1097/00004850-199506000-00003. [DOI] [PubMed] [Google Scholar]
- 55.Reiss S, Peterson RA, Gursky DM, McNally RJ. Anxiety sensitivity, anxiety frequency and the prediction of fearfulness. Behavior Research and Therapy. 1986;24:1–8. doi: 10.1016/0005-7967(86)90143-9. [DOI] [PubMed] [Google Scholar]
- 56.Chambliss DL, Caputo GC, Jasin SE, Gracel EJ, Williams C. The Mobility Inventory for Agoraphobia. Behav Res Ther. 1985;23:35–44. doi: 10.1016/0005-7967(85)90140-8. [DOI] [PubMed] [Google Scholar]
- 57.Dillon DJ, Gorman JM, Liebowitz MR, Fyer AJ, Klein DF. Measurement of lactate-induced panic and anxiety. Psychiatry Res. 1987;20:97–105. doi: 10.1016/0165-1781(87)90002-3. [DOI] [PubMed] [Google Scholar]
- 58.Spielberger CD. Manual for the State-Trait Anxiety Inventory (STAI Form Y) Palo Alto: Consulting Psychologists Press; 1983. [Google Scholar]
- 59.Maddock RJ, Mateo-Bermudez J. Elevated serum lactate following hyperventilation during glucose infusion in panic disorder. Biol Psychiatry. 1990;27:411–418. doi: 10.1016/0006-3223(90)90551-c. [DOI] [PubMed] [Google Scholar]
- 60.Sison S. Magnetic Resonance Spectroscopy Sequence Development for Optimal Lactate Detection [Master of Science] Davis: University of California Davis; 2006. [Google Scholar]
- 61.Star-Lack J, Spielman D, Adalsteinsson E, Kurhanewicz J, Terris DJ, Vigneron DB. In vivo lactate editing with simultaneous detection of choline, creatine, NAA, and lipid singlets at 1.5 T using PRESS excitation with applications to the study of brain and head and neck tumors. J Magn Reson. 1998;133:243–254. doi: 10.1006/jmre.1998.1458. [DOI] [PubMed] [Google Scholar]
- 62.Maddock RJ, Buonocore MH. Measuring brain lactate at rest and during visual stimulation. Psychiatry Res. 2008;162:175–179. [Google Scholar]
- 63.MRUI. Magnetic Resonance User Interface. 2007 Available at http://www.mrui.uab.es/mrui/mrui_Overview.shtml.
- 64.Provencher SW. Estimation of metabolite concentrations from localized in vivo proton NMR spectra. Magnetic resonance in medicine. 1993;30:672–679. doi: 10.1002/mrm.1910300604. [DOI] [PubMed] [Google Scholar]
- 65.Hancu I. Optimized glutamate detection at 3T. J Magn Reson Imaging. 2009;30:1155–1162. doi: 10.1002/jmri.21936. [DOI] [PMC free article] [PubMed] [Google Scholar]
- 66.Maddock RJ, Buonocore MH. MR Spectroscopic Studies of the Brain in Psychiatric Disorders. Curr Top Behav Neurosci. 2012;11:199– 251. doi: 10.1007/7854_2011_197. [DOI] [PubMed] [Google Scholar]
- 67.Maddock RJ, Buonocore MH, Lavoie SP, Copeland LE, Kile SJ, Richards AL, et al. Brain lactate responses during visual stimulation in fasting and hyperglycemic subjects: a proton magnetic resonance spectroscopy study at 1.5 Tesla. Psychiatry Research: Neuroimaging. 2006;148:47–54. doi: 10.1016/j.pscychresns.2006.02.004. [DOI] [PMC free article] [PubMed] [Google Scholar]
- 68.Iglewicz B, Hoaglin D. How to detect and handle outliers. Milwaukee: ASQC Quality Press; 1993. [Google Scholar]
- 69.Dienel GA, Hertz L. Glucose and Lactate Metabolism During Brain Activation. J Neurosci Res. 2001;66:824–838. doi: 10.1002/jnr.10079. [DOI] [PubMed] [Google Scholar]
- 70.Pellerin L, Magistretti PJ. Neuroenergetics: Calling upon astrocytes to satisfy hungry neurons. Neuroscientist. 2004;10:53–62. doi: 10.1177/1073858403260159. [DOI] [PubMed] [Google Scholar]
- 71.Pellerin L, Pellegri G, Bittar PG, Charnay Y, Bouras C, Martin JL, et al. Evidence supporting the existence of an activity dependent astrocyte-neuron lactate shuttle. Dev Neurosci. 1998;20:291–299. doi: 10.1159/000017324. [DOI] [PubMed] [Google Scholar]
- 72.Wemmie JA, Askwith CC, Lamani E, Cassell MD, Freeman JH, Jr, Welsh MJ. Acid-sensing ion channel 1 is localized in brain regions with high synaptic density and contributes to fear conditioning. J Neurosci. 2003;23:5496–5502. doi: 10.1523/JNEUROSCI.23-13-05496.2003. [DOI] [PMC free article] [PubMed] [Google Scholar]
- 73.Wemmie JA, Coryell MW, Askwith CC, Lamani E, Leonard AS, Sigmund CD, et al. Overexpression of acid-sensing ion channel 1a in transgenic mice increases acquired fear-related behavior. Proc Natl Acad Sci U S A. 2004;101:3621–3626. doi: 10.1073/pnas.0308753101. [DOI] [PMC free article] [PubMed] [Google Scholar]
- 74.Ziemann AE, Allen JE, Dahdaleh NS, Drebot II, Coryell MW, Wunsch AM, et al. The amygdala is a chemosensor that detects carbon dioxide and acidosis to elicit fear behavior. Cell. 2009;139:1012–1021. doi: 10.1016/j.cell.2009.10.029. [DOI] [PMC free article] [PubMed] [Google Scholar]
- 75.Boshuisen ML, Ter Horst GJ, Paans AM, Reinders AA, den Boer JA. rCBF differences between panic disorder patients and control subjects during anticipatory anxiety and rest. Biol Psychiatry. 2002;52:126–135. doi: 10.1016/s0006-3223(02)01355-0. [DOI] [PubMed] [Google Scholar]
- 76.Chechko N, Wehrle R, Erhardt A, Holsboer F, Czisch M, Samann PG. Unstable prefrontal response to emotional conflict and activation of lower limbic structures and brainstem in remitted panic disorder. PLoS ONE. 2009;4:e5537. doi: 10.1371/journal.pone.0005537. [DOI] [PMC free article] [PubMed] [Google Scholar]
- 77.Fujiwara A, Yoshida T, Otsuka T, Hayano F, Asami T, Narita H, et al. Midbrain volume increase in patients with panic disorder. Psychiatry Clin Neurosci. 2011;65:365–373. doi: 10.1111/j.1440-1819.2011.02219.x. [DOI] [PubMed] [Google Scholar]
- 78.Protopopescu X, Pan H, Tuescher O, Cloitre M, Goldstein M, Engelien A, et al. Increased brainstem volume in panic disorder: a voxel-based morphometric study. Neuroreport. 2006;17:361–363. doi: 10.1097/01.wnr.0000203354.80438.1. [DOI] [PubMed] [Google Scholar]
- 79.Sakai Y, Kumano H, Nishikawa M, Sakano Y, Kaiya H, Imabayashi E, et al. Cerebral glucose metabolism associated with a fear network in panic disorder. Neuroreport. 2005;16:927–931. doi: 10.1097/00001756-200506210-00010. [DOI] [PubMed] [Google Scholar]
- 80.Sakai Y, Kumano H, Nishikawa M, Sakano Y, Kaiya H, Imabayashi E, et al. Changes in cerebral glucose utilization in patients with panic disorder treated with cognitive-behavioral therapy. Neuroimage. 2006;33:218–226. doi: 10.1016/j.neuroimage.2006.06.017. [DOI] [PubMed] [Google Scholar]
- 81.Uchida RR, Del-Ben CM, Busatto GF, Duran FL, Guimaraes FS, Crippa JA, et al. Regional gray matter abnormalities in panic disorder: a voxel-based morphometry study. Psychiatry Res. 2008;163:21–29. doi: 10.1016/j.pscychresns.2007.04.015. [DOI] [PubMed] [Google Scholar]
- 82.Hertz L. Intercellular metabolic compartmentation in the brain: past, present and future. Neurochem Int. 2004;45:285–296. doi: 10.1016/j.neuint.2003.08.016. [DOI] [PubMed] [Google Scholar]
- 83.Rothman DL, Behar KL, Hyder F, Shulman RG. In vivo NMR studies of the glutamate neurotransmitter flux and neuroenergetics: implications for brain function. Annu Rev Physiol. 2003;65:401–427. doi: 10.1146/annurev.physiol.65.092101.142131. [DOI] [PubMed] [Google Scholar]
- 84.Bovee WM. Quantification of glutamate, glutamine, and other metabolites in in vivo proton NMR spectroscopy. NMR Biomed. 1991;4:81–84. doi: 10.1002/nbm.1940040209. [DOI] [PubMed] [Google Scholar]
- 85.Kauppinen RA, Pirttila TR, Auriola SO, Williams SR. Compartmentation of cerebral glutamate in situ as detected by 1H/13C n.m.r. Biochem J. 1994;298(Pt 1):121–127. doi: 10.1042/bj2980121. [DOI] [PMC free article] [PubMed] [Google Scholar]
- 86.Kauppinen RA, Williams SR. Nondestructive detection of glutamate by 1H nuclear magnetic resonance spectroscopy in cortical brain slices from the guinea pig: evidence for changes in detectability during severe anoxic insults. J Neurochem. 1991;57:1136–1144. doi: 10.1111/j.1471-4159.1991.tb08271.x. [DOI] [PubMed] [Google Scholar]
- 87.Pirttila TR, Hakumaki JM, Kauppinen RA. 1H nuclear magnetic resonance spectroscopy study of cerebral glutamate in an ex vivo brain preparation of guinea pig. J Neurochem. 1993;60:1274–1282. doi: 10.1111/j.1471-4159.1993.tb03287.x. [DOI] [PubMed] [Google Scholar]
- 88.de Graaf AA, Deutz NE, Bosman DK, Chamuleau RA, de Haan JG, Bovee WM. The use of in vivo proton NMR to study the effects of hyperammonemia in the rat cerebral cortex. NMR Biomed. 1991;4:31–37. doi: 10.1002/nbm.1940040106. [DOI] [PubMed] [Google Scholar]
- 89.Coryell MW, Wunsch AM, Haenfler JM, Allen JE, Schnizler M, Ziemann AE, et al. Acid-sensing ion channel-1a in the amygdala, a novel therapeutic target in depression-related behavior. J Neurosci. 2009;29:5381–5388. doi: 10.1523/JNEUROSCI.0360-09.2009. [DOI] [PMC free article] [PubMed] [Google Scholar]
- 90.Dwyer JM, Rizzo SJ, Neal SJ, Lin Q, Jow F, Arias RL, et al. Acid sensing ion channel (ASIC) inhibitors exhibit anxiolytic-like activity in preclinical pharmacological models. Psychopharmacology (Berl) 2009;203:41–52. doi: 10.1007/s00213-008-1373-7. [DOI] [PubMed] [Google Scholar]
Associated Data
This section collects any data citations, data availability statements, or supplementary materials included in this article.
Supplementary Materials
Figure S1. An example spectrum and its LCModel fit is shown for a remitted PD patient (panel A) and for a control subject (panel B). The large area in the center of each panel shows three tracings: 1) the spectral data as acquired (black line); 2) the LCModel fit of the acquired spectral data (red line); and the LCModel baseline estimation (black line along the baseline of the spectral data). The small area above the spectral data shows the residual signal (black line), which illustrates how much the acquired spectral data deviates from the fit. Each spectrum was obtained from the interleaved CHESS frames acquired over a single 5-minute period of visual stimulation (see Methods). CHESS, chemical-shift selective saturation.
Figure S2. Each line illustrates the slope of the regression between changes in lactate over time (Y axis) and changes in glx over time (X axis) for each of the 20 PD patients (A) and each of the 11 control subjects (B) (outliers excluded). In the control subjects, all but two subjects show a positive slope. In the PD patients, there is no consistent relationship between change in lactate and change in glx over time. glx, glutamate + glutamine.