

Abstract
We present an initial molecular characterization of a morphological transition between two early aging states. In previous work, an age score reflecting physiological age was developed using a machine classifier trained on images of worm populations at fixed chronological ages throughout their lifespan. The distribution of age scores identified three stable post-developmental states and transitions. The first transition occurs at day 5 post-hatching, where a significant percentage of the population exists in both state I and state II. The temperature dependence of the timing of this transition (Q10 ~ 1.17) is too low to be explained by a stepwise process with an enzymatic or chemical rate-limiting step, potentially implicating a more complex mechanism. Individual animals at day 5 were sorted into state I and state II groups using the machine classifier and analyzed by microarray expression profiling. Despite being isogenic, grown for the same amount of time, and indistinguishable by eye, these two morphological states were confirmed to be molecularly distinct by hierarchical clustering and principal component analysis of the microarray results. These molecular differences suggest that pharynx morphology reflects the aging state of the whole organism. Our expression profiling yielded a gene set that showed significant overlap with those from three previous age-related studies and identified several genes not previously implicated in aging. A highly represented group of genes unique to this study is involved in targeted ubiquitin-mediated proteolysis, including Skp1-related (SKR), F-box-containing, and BTB motif adaptors.
Electronic supplementary material
The online version of this article (doi:10.1007/s11357-012-9401-2) contains supplementary material, which is available to authorized users.
Keywords: Machine classifier, Biomarker of aging, Metastable aging state, Microarray analysis
Introduction
Aging models have postulated that wear and tear (Weissman 1891), stress (Whittenberger 1956), free radical species (Harman 1956), or developmental genetic programs (Williams 1957) may explain senescence. The nematode Caenorhabditis elegans provides a genetically tractable system to examine those models and develop others related to senescence (T E Johnson 1987). To examine the aging process in genetic detail, several microarray analyses comparing transcript levels at differing chronological ages have been performed. These studies used isolated individual animals (Golden and Melov 2004), populations with similar body muscle function phenotypes (Golden et al. 2008), or pools of worms (Lund et al. 2002; Murphy et al. 2003; Budovskaya et al. 2008; Park et al. 2009). The identification of a transcription factor “circuit” (Budovskaya et al. 2008) provided the first genetic evidence supporting antagonistic pleiotropy (Pincus and Slack 2008), a theory that suggests that some traits that are beneficial in early development may be deleterious when they are expressed later in life (Walker 2011). As natural selection declines post-reproductively, the opportunity for reactivation of developmentally important factors increases, without the necessary reserves to utilize (or properly regulate) the activated pathways, resulting in damage accumulation and disease. Consequently, the evolution of fecundity promoting traits later exacts a cost reduction of lifespan (discussed in detail by Kirkwood and Rose (1991)). Thus, it appears that developmental pathways drift in post-developmental animals, resulting in a growing physiological disparity between individuals over time. To resolve the resulting mixture of individuals in an aging population, we require a way to measure true physiological age.
Biological age or physiological age is an assessment of an individual's relative health at a given chronological age (Benjamin 1947). Several useful criteria for a biomarker of aging have been suggested (Simm and Johnson 2010). Namely, the biomarker must be a better predictor of lifespan than chronological age alone, it must monitor a basic process that underlies the aging process (not just the effects of disease), and it must be measurable repeatedly without harm to the individual, using, for example, an imaging technique. Finally, the assay must be functional in laboratory animals, so that it can be tested in a controlled setting before being validated in humans. Molecular biomarkers have been assessed to predict the remaining lifespan of C. elegans (Rea et al. 2005; Pincus and Slack 2010)—thousands of significantly age-regulated genes have been identified in the microarray studies referenced previously, and dozens have been proven to be gerontogenes (life-extending and life-shortening factors). In addition to genetic biomarkers, morphological aging biomarkers, e.g., accumulation of lipofuscin, loss of fecundity, and muscle degradation (sarcopenia), can also provide a qualitative assessment of aging state (Yu and Driscoll 2011). We developed a quantitative measure of aging state (age score) to assess sarcopenia over the worm's lifespan (Johnston et al. 2008). Our measure fulfills the first three criteria of usefulness (defined previously), but currently lacks an experimental correlate in humans and mice, mainly due to the difficulty in obtaining high-resolution imaging data for many individuals finely sampled across their lifespan.
In this study, we used our machine vision approach to further characterize this morphological biomarker and determine its physiological basis. We confirmed our previous observation of stable aging states in the C. elegans pharynx using a more sensitive image classifier that relies on linear discriminant analysis for feature selection. As before, the resulting classifier reports an age score as a continuous variable for individual worms, and the distribution of these scores in an aging population shows that individuals progress stepwise through three states and transitions rather than monotonically. The states roughly correspond to young, adult worms capable of egg-laying (state I), an extended mid-life state characterized by healthy active adults with reduced reproductive activity (state II), and old worms characterized by reduced activity and significant accumulation of lipofuscin (state III, see Fig. 1). We investigated the temperature dependence of the kinetics of the first state transition in order to model the underlying mechanisms as a bulk process and to determine if it is an open loop and largely governed by rate-limiting steps or if it is potentially a closed-loop process with temperature compensating feedback. The observed Q10 of 1.17 is within the range observed for feedback-regulated mechanisms like circadian rhythms rather than the range observed for enzymatic or even chemical processes. We further analyzed this transition by microarray hybridization. Using standard techniques to interpret our microarray findings, hierarchical clustering (HC), principal component analysis (PCA), and functional pathway analysis (EASE) all showed that these early post-developmental states have distinct molecular signatures. Although the animals were sorted by pharynx morphology alone, the microarrays were performed on whole animals, indicating that the age score reflects the aging state of the entire organism. We compared our list of differentially expressed genes with those from three previous aging studies in C. elegans and found many genes in common (e.g., heat-shock proteins, mitochondrial electron transport, and insulin signaling pathway components, cytochrome p450) as well as a functional group uniquely well represented in our study involved in targeted protein degradation (e.g., Skip1-related, BTB, and F-box containing proteins).
Fig. 1.

Normalized frequency of age scores was plotted separately for all seven chronologically defined worm populations. Frequencies for each timepoint were normalized by setting the maximum to 1.0. Age state is noted by a label in a gray box delimiting state boundaries. Day 0 worms (dark blue line) constitute state 0. As previously pointed out, although this state occurs after hatching, there is still considerable growth, and so, it is not strictly considered an aging state (Johnston et al. 2008). Day 2 (light blue) and day 4 (turquoise) worms are found in state I. Days 4, 6 (yellow), and 8 (orange) all contribute to state II. Days 8, 10, and 12 (brown) form state III
Materials and methods
C. elegans cultivation
C. elegans strain BA17, fem-1(hc17) was used in this work. Animals were grown and maintained at 15°C or 25°C on nematode growth media (NGM) containing 2.1% agar with E. coli strain OP50 as a food source. Age-synchronized populations were obtained by allowing fertile adult hermaphrodites to lay eggs on NGM medium with bacterial food for 2 to 4 h at 15°C. The eggs were shifted to 25°C for 48 h to complete development into aspermic hermaphrodites. Day 0 of adulthood was defined as the day of the L4 to adult molt. Animals were collected at the specified day of adulthood for imaging. In temperature dependence experiments for determining Q10, the 15°C worms were shifted to 15°C at day 0 of adulthood and kept at this temperature until imaging, while the 25°C population remained at 25°C.
Image acquisition
Animals were immobilized between a 2% agarose pad and a No. 1 glass coverslip, after treatment with 0.1% azide for 1 min. The pharynx was imaged with a Hamamatsu ORCA-ER CCD digital camera mounted on a Nikon E800 upright microscope, equipped with DIC optics ( × 60 objective). OpenLab software allowed organized storage of images acquired in LIFF format. ImageJ was used to prepare terminal bulb images from original LIFF files. A 300 × 300 pixel region of interest, with the grinder centered in the frame, was duplicated and saved as a TIFF file for further analysis.
Machine vision interpretation of images
WND-CHRM used the pixel intensities derived from TIFF images collected to calculate features and create a feature vector (Orlov et al. 2008). Classifiers were trained with at least 85 images of animals grown for 0, 2, 4, 6, 8, 10, and 12 days after egg-laying. The seven-class classifier was most efficient and accurate when less than ten features were used. Test images were classified by producing a vector of probabilities across the chronological age classes. The sum of the products of the marginal probability of a particular class and its class value in days produced an age score for each pharynx image. Worms scoring in the range of 5.2–5.6 and 6.2–6.6 were assigned to state I and state II, respectively. For temperature-sensitivity measurements, worms were grown for the indicated number of days after the L4 molt at the indicated temperature. For microarray analysis, worms were grown for 5 days following the L4 molt at 25°C and then sorted by calculating age score in real time. On three separate occasions, collections of 300 sorted animals (150 in each state) were saved for subsequent RNA preparation. Animals scoring outside the ranges defined previously were discarded.
Microarray probe preparation
After storage at −80°C, aliquots of worms were used to prepare mRNA. Total RNA was isolated with Absolutely RNA miniprep kit (Stratagene, La Jolla, CA). cRNA was generated and labeled with the Quick Amp 2 Color Labeling Kit (Agilent Technologies, Santa Clara, CA) and hybridized to the C. elegans 4 × 44K Oligo Microarray (Agilent Technologies, USA). Raw microarray hybridization intensity data (Cy3(green, state I) or Cy5(red, state II)) from four separate experiments were log-transformed. Three separate probe preparations were used individually or combined in equal amounts for the fourth hybridization.
Data analysis
Microarray data were analyzed with DIANE 6.0, a spreadsheet-based program derived from the SAS JMP7.0 system. Raw data were subjected to Z normalization as described previously (Cheadle et al. 2003). The sample quality was first assessed with principal component analysis and hierarchical clustering based on all gene sample z-scores (Fig. 3). Hierarchical clustering (HC) and principal components analysis (PCA) were performed to compare all samples in the four separate hybridizations using DIANE 6.0.
Fig. 3.
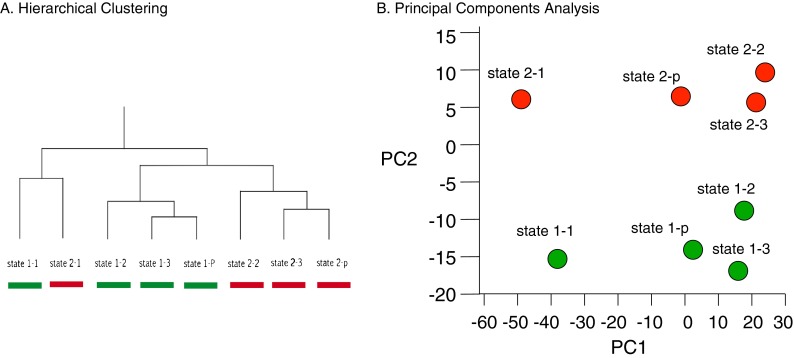
Hierarchical clustering and principal component analysis of microarray hybridizations. a Mean z-scores for all genes expressed in state I (green) or state II (red) were used for hierarchical clustering. Results from four separate hybridizations were compared—1, 2, 3, and p (pool of probes 1, 2, and 3). b Principal component analysis based on the z-ratio of expression for all state I genes (green) and all state II genes (red)
ANOVA tests were used to eliminate genes with large variances within each test comparison. The pooled samples were not used in ANOVA analysis. Differentially expressed genes were determined by the Z ratio (the fold-difference between experimental groups) and false discovery rate (fdr—expected proportion of false positives). Individual genes with p value ≤0.05, absolute value of Z ratio ≥ 1.50, and fdr ≤ 0.30 were considered significantly changed.
Lists of significantly changed genes were uploaded to DAVID Bioinformatics Resources 6.7 website (http://david.abcc.ncifcrf.gov/), and cosmid ID numbers were converted to DAVID identification tags. After converting their systematic names, we assessed each list for gene functional classification. We used this tool to generate gene clusters with all five parameter sets available. The scores reported in Table 2 are computed from the rank orders of each cluster for each run. A normalized, per-run score for each cluster was computed from the rank order as reported by DAVID by inverting it and dividing by the total number of significant (i.e., enrichment score > 1.0) clusters found in each run. Clusters that were not found in a given run (marked in Table 2 with a blank cell) were assigned a per-run score of 0. The reported score for each cluster is the norm (i.e., the square root of the sum of squares) of the normalized, per-run scores for each cluster.
Table 2.
Gene functional classification clusters
| Score | Classification stringency | |||||
|---|---|---|---|---|---|---|
| Description | LL | L | M | H | HH | |
| HSPs | 1.73 | 1 | 1 | 1 | ||
| Mitochondrial | 1.62 | 2 | 2 | 2 | 2 | |
| Skp1- related | 1.31 | 2 | 1 | |||
| Secreted, Cys | 1.28 | 3 | 4 | 4 | 3 | |
| Dehydrogenases | 1.08 | 3 | 3 | |||
| F-box containing | 1.01 | 1 | ||||
| Saposin-like | 0.91 | 4 | 5 | 5 | ||
| Insulin, proteases | 0.78 | 5 | 6 | 6 | 4 | |
| P450 and sterol oxidases | 0.51 | 7 | 5 | 3 | ||
| C-type lectins | 0.33 | 7 | 8 | |||
| BTB domain | 0.24 | 6 | 8 | 9 | ||
| # Clusters reported | 6 | 8 | 9 | 5 | 3 | |
The list of DAVID tags was also converted to Official Gene names to allow determination of the microarray discovery timeframe in WormBase release WS227 (http://www.wormbase.org/). All genes presented in Table 3 were significantly regulated in our study—if a gene was not found in another microarray study of aging in worms, we considered the gene to be discovered in this study.
Table 3.
Gene functional classification clusters
| Cluster name | Locus and/or description | Microarray discovery |
|---|---|---|
| HSPs | ||
| hsp-12.2 | Heat -shock protein | This study |
| hsp-17 | Heat -shock protein | This study |
| hsp-16.49 | Heat -shock protein | Aging, Stress-1 |
| hsp-43 | Heat -shock protein | Aging |
| hsp-16.2 | Heat -shock protein | Daf2-1, Aging, Stress-1 |
| hsp-16.11 | Heat -shock protein | Daf2-1 |
| hsp-12.6 | Heat -shock protein | Daf2-1 |
| Mitochondrial function | ||
| ND2 | NADH-ubiquinone oxidoreductase chain 2 | This study |
| ND4 | NADH-ubiquinone oxidoreductase chain 4 | This study |
| CYTB | Cytochrome b | This study |
| ND3 | NADH-ubiquinone oxidoreductase chain 3 | This study |
| ND4L | NADH-ubiquinone oxidoreductase chain 4L | This study |
| COX1 | Cytochrome c oxidase subunit 1 | This study |
| COX3 | Cytochrome c oxidase subunit 3 | This study |
| Insulin related and others | ||
| C41D11.9 | Lin-12 signaling | This study |
| cpg-7 | Chondroitin proteoglycan | This study |
| cpg-9 | Chondroitin proteoglycan | This study |
| daao-1 | Amino acid oxidases | This study |
| ins-12 | Insulin-like | This study |
| ppt-1 | Palmitoyl protein thioesterase | This study |
| T05H10.3 | T05H10.3 | This study |
| asah-1 | Acylsphingosine amidohydrolase | Daf2-1 |
| F09B12.3 | F09B12.3 | Aging, Stress-1, daf2-1 |
| ins-7 | Insulin-like | Aging, Stress-1, daf2-2 |
| nas-9 | Astacin protease | Aging, Stress-1 |
| cpr-6 | Protease | Aging |
| ins-23 | Insulin-like | Aging |
| vit-1 | Vitellogenin | Aging |
| ZC412.3 | ZC412.3 | Aging |
| ZK1320.3 | ZK1320.3 | Aging |
| ins-2 | Insulin-like | Aging |
| F32A5.4 | F32A5.4 | Stress-1, daf2-1 |
| flp-9 | FMRF-like peptide | Stress-1 |
| ZK669.3 | ZK669.3 | Stress-1 |
| Cytochrome P450s | ||
| cyp-13A5 | CYtochrome P450 family | This study |
| cyp-33B1 | CYtochrome P450 family | This study |
| cyp-35B1 | CYtochrome P450 family | Daf2-1, Aging |
| cyp-35A2 | CYtochrome P450 family | Daf2-2, Aging |
| cyp-33C8 | CYtochrome P450 family | Aging, Stress-1 |
| cyp-35C1 | CYtochrome P450 family | Daf2-2 |
| cyp-25A1 | CYtochrome P450 family | Aging, Stress-2 |
| cyp-14A5 | CYtochrome P450 family | Stress-1 |
| F49E12.9 | C-4 sterol methyl oxidase | Aging |
| C-lectin domain containing | ||
| clec-218 | C-type lectin | This study |
| clec-65 | C-type lectin | Aging |
| clec-66 | C-type lectin | Aging |
| F28B4.3 | F28B4.3 | Aging |
| F-box containing | ||
| fbxb-35 | F-box E3 ligase adapter | This study |
| fbxb-42 | F-box E3 ligase adapter | This study |
| fbxb-62 | F-box E3 ligase adapter | This study |
| fbxb-88 | F-box E3 ligase adapter | This study |
| fbxb-90 | F-box E3 ligase adapter | This study |
| CC47D12.4 | F-box E3 ligase adapter | This study |
| C52A10.3 | F-box E3 ligase adapter | This study |
| fbxb-24 | F-box E3 ligase adapter | Daf2-2 |
| fbxb-54 | F-box E3 ligase adapter | Aging, Stress-1 |
| fbxb-84 | F-box E3 ligase adapter | Aging, daf2-2 |
| fbxb-9 | F-box E3 ligase adapter | Aging, daf2-2 |
| pes-2.1 | F-box E3 ligase adapter | Aging, daf2-2 |
| fbxb-44 | F-box E3 ligase adapter | Aging |
| fbxb-82 | F-box E3 ligase adapter | Aging |
| sdz-33 | F-box E3 ligase adapter | Aging |
| K05F6.4 | F-box E3 ligase adapter | Aging |
| F15A4.2 | F-box E3 ligase adapter | Aging |
| fbxb-26 | F-box E3 ligase adapter | Stress-1 |
| fbxb-85 | F-box E3 ligase adapter | Stress-1 |
| Ub proteolysis | ||
| apc-11 | F-box E3 ligase adapter | This study |
| ubl-5 | Ubiquitin-like protein | This study |
| tag-277 | Ubiquitin-like fold | This study |
| skr-16 | Skp-1 -related protein | This study |
| skr-10 | Skp-1 -related protein | This study |
| skr-14 | Skp-1 -related protein | This study |
| skr-8 | Skp-1 -related protein | Aging, daf2-2 |
| skr-7 | Skp-1 -related protein | Aging |
| skr-12 | Skp-1 -related protein | Aging |
| skr-13 | Skp-1 -related protein | Aging |
| Secreted cysteine-rich | ||
| F35F10.13 | Secreted, cysteine-rich | This study |
| T28A11.16 | Secreted, cysteine-rich | This study |
| W10G11.2 | Secreted, cysteine-rich | This study |
| C17B7.4 | Secreted, cysteine-rich | This study |
| D1086.3 | Secreted, cysteine-rich | Aging, daf2-1, Stress-1 |
| ZK105.1 | Secreted, cysteine-rich | Aging |
| Dehydrogenases | ||
| dhs-2 | Dehydrogenases, short chain | This study |
| dhs-26 | Dehydrogenases, short chain | This study |
| C30G12.2 Dehydrogenases, short chain | Aging | |
| C55A6.6 | Dehydrogenases, short chain | Stress-1 |
| stdh-1 | Steroid dehydrogenase family | Aging, daf2-1 |
| Saposin-like | ||
| spp-14 | Saposin-like | This study |
| spp-8 | Saposin-like | Aging, Stress-1 |
| spp-10 | Saposin-like | Aging, Stress-1 |
| spp-4 | Saposin-like | Aging |
| BTB, cullin-3 associated | ||
| bath-35 | BTB motif | This study |
| btb-4 | BTB motif | This study |
| bath-16 | BTB motif | This study |
| bath-31 | BTB motif | This study |
| btb-10 | BTB motif | Aging, Stress-1 |
| btb-11 | BTB motif | Aging |
-1 up -regulated, -2 down -regulated
Venn diagram generation and analysis
A Venn diagram shows the degree of overlap between the gene lists from three previous studies of aging in C. elegans, similar to a figure presented in Park et al. (2009), Murphy et al. (2003), and Budovskaya et al. (2008). This overlap reflects real differences in the response of animals to experimental regimes, but also the differences in the microarray platforms. We found that the Aging, RG, and 44 k platforms have a large number of unique genes represented on or omitted from the microarray, resulting in a common gene set that is relatively small (13,900 genes). We assessed the genes common to all studies, after removing genes unique to any particular microarray platform.
From a common list of 13,900 genes found on all microarrays, we were left with the following significantly regulated genes from each study—Murphy et al., 406/496 (81.8%); Budovskaya et al., 1,024/1,175 (87.1%); Park et al., 926/1,206 (76.8%); this study, 413/635 (64.9%).
We cut and pasted gene lists from spreadsheet or tab-delimited text files into appropriate windows at the Venny site (http://bioinfogp.cnb.csic.es/tools/venny/index.html, (Oliveros 2007) and saved the .gif files for representation of the areas of overlap.
Results
LDA classifier identifies several stable aging states
The C. elegans pharynx terminal bulb was previously used as a model for age-related sarcopenia both morphologically and functionally. The functional decline in this organ's activity as well as its degeneration morphologically is well correlated with other physiological measures of aging including lifespan (Chow et al. 2006). This study presents additional evidence that sarcopenia in this organ is a general marker for the organisms' physiological age (see “Results” section: “Molecular basis for morphological age states”). In our previous work, we used high-resolution differential-interference contrast imaging together with a machine classifier to further characterize this organ's utility as a general marker of the aging process (Johnston et al. 2008). Our image classifier is based on transforming observed morphology into quantitative low-level image descriptors or features. Each image is thus associated with a long feature vector that combines multiple measures of morphological change. The image classifier is trained to distinguish worms of seven chronological ages and assign individuals an age score as a continuous variable (see “Materials and methods”). When the age scores for an aging population were plotted in rank order for each chronological group, several stable ranges of values were observed, suggesting that stable states of physiological age exist across the C. elegans lifespan (Johnston et al. 2008). Notably, these stable ranges were observed within chronologically identical groups, as well as persisting across several chronologically distinct groups. When the nature of some specific low-level image descriptors was more closely examined, we found that texture entropy increases at the predicted time of transition between states I and II (day 4 compared to day 2), as well as between states II and III (day 10 compared to day 8). We also found that texture directionality decreases at the same transitions, demonstrating that the aging signal detected by our classifier is a mixture of positive and negative feature contributions, and that the classifier is strongly influenced by increasing disorder in this tissue throughout lifespan (Shamir et al. 2009).
To avoid redundancy in our low-level image descriptors as well as to reduce their number, we constructed a low-dimensionality Euclidean (i.e., orthogonal) space from our original multi-dimensional feature space (Orlov et al. 2008). We used a specific linear orthogonal transformation to emphasize inter-group difference and within-group homogeneity, a method called linear discriminant analysis (LDA). In LDA, the number of independent dimensions is N − 1, where N is the number of the age groups analyzed. When LDA was used to measure image-to-image Euclidean distance, it produced similar findings compared to Fisher discriminant feature reduction (Johnston et al. 2008; Orlov et al. 2008). Combining Fisher discriminant feature reduction with further feature reduction and orthogonalization by LDA resulted in a classifier that corroborated the previously observed states as well as improving their separation. Our previous classifier could not resolve the timing of the transition between states II and III, whereas this improved classifier was able to disambiguate this transition, assigning it clearly to day 8 (Fig. 1).
Transition from state I to state II is temperature compensated
Single gene mutations can drastically increase the C. elegans lifespan (Friedman and Johnson 1988a; Friedman and Johnson 1988b; Kenyon et al. 1993), perhaps by altering transitions between states of aging. The temperature dependence of the kinetics of a complex biological process can sometimes distinguish between a mechanism controlled largely by a rate-limiting step and one where feedback plays a significant role. Enzyme-driven reactions are highly temperature sensitive and are expected to decrease velocity (v) in response to a decrease in temperature (T). A separate reaction acting in the opposite direction (i.e., feedback) will also decrease velocity under decreased temperature conditions, creating a temperature compensation effect. Typically, the temperature dependence of a biological process is characterized using the Q10 temperature dependence coefficient (see Ruoff and Rensing (2004)). The value of Q10 is determined as follows:
 |
1 |
where v(T) is the reaction rate at a given temperature.
Circadian rhythms in many organisms are temperature compensated using feedback regulation and have Q10 values of 0.9–1.2 (Simonetta et al. 2009; Ruoff and Rensing 2004; Pittendrigh 1960). In contrast, enzymatic reactions, biosynthetic pathways, cell growth, and respiration have Q10 values of 2–3 and are not considered to be temperature compensated (Ruoff and Rensing 2004). To measure the Q10 for the first age-state transition, we grew worms at 15°C and 25°C, imaged their pharynxes at three timepoints for each temperature, and obtained individual age scores using the classifier described previously (LDA feature selector). A probability density estimate plot, depicting the frequency of age scores, was generated (see “Materials and methods”). Each plot had two clear peaks, corresponding to state I and state II (Fig. 2). Age score bins were defined by placing lower and upper bounds symmetrically around the maximum of each peak (Age score 5.4 for state I and 6.4 for state II). For each temperature, we calculated the exact time of the transition midpoint, where the numbers of state I and state II animals were equal (T50). The exact midpoint was not directly observed, but was interpolated from the number of worms in state I and state II on days before and after T50. Depending on bin width, the interpolated T50 was 4.30 ± 0.11 days at 25°C and 5.04 ± 0.14 days at 15°C. The resulting Q10 measurements from applying formula 1 were 1.17 ± 0.06 (Table 1). The measured Q10 lies within the range observed for temperature-compensated biological processes, implying that the timing of this transition is not governed by an enzymatic rate-liming step.
Fig. 2.

Frequency distribution of age scores plotted for several timepoints at different temperatures. a Animals grown at 25°C. b Animals grown at 15°C. Day 4 (turquoise line), day 5 (green), day 6 (yellow), day 7 (orange)
Table 1.
Q 10 determinations
| Age score intervals | 25°C stage I = stage II (day) | 15°C stage I = stage II (day) | Q 10 |
|---|---|---|---|
| 5.4 ± +/- 0.5; 6.45 ± +/-0.5 | 4.19 | 4.90 | 1.17 |
| 5.4 ± +/- 0.4; 6.40 ± +/-0.4 | 4.22 | 4.94 | 1.17 |
| 5.4 ± +/- 0.3; 6.40 ± +/-0.3 | 4.33 | 5.13 | 1.18 |
| 5.4 ± +/- 0.2; 6.40 ± +/-0.2 | 4.41 | 5.17 | 1.17 |
Molecular basis for morphological age states
If the pharynx morphology imaged in our assays reflects the global state of aging for the animal, it would be possible to sort chronologically identical individuals into distinct populations representing different aging states. However, the pharynx terminal bulb represents ~5% of the animal's body mass. If the pharynx is not a good proxy for the global aging state, then the aging signal could be easily overwhelmed by noise contributed by other parts of the animal. Noise would dominate the aging signal whether the other tissues are in a uniform state or in an unsynchronized mosaic of states unrelated to those of the pharynx.
In order to determine if states I and II are observed in whole animals, we used the classifier to score images of the pharynx of day 5 animals in real time. On three separate occasions, worms were grown to day 5 and sorted into two pools based on the age scores reported by the classifier. RNA was prepared for each pool and used to generate labeled microarray probes (see “Materials and methods” for details). The six separate pools were used in three microarray hybridizations (state I-1/state II-1 to state I-3/state II-3). A fourth hybridization used a pooled sample generated by mixing equal amounts of the three independent state I and state II RNA preparations (state I-p/state II-p). Hierarchical clustering (HC) and principal component analysis (PCA) demonstrated that two distinct groups of transcripts are found within the single chronological age that we examined (Fig. 3a and b). Although the first sample (state I-1/state II-1 in Fig. 3b) is an apparent outlier responsible for the majority of the range in PC1, all of the samples are well separated by aging state along PC2. Our findings show that age score based on pharynx morphology is consistent with the aging state of the whole organism.
Transition transcripts compared to other aging and lifespan signatures
Expression profiling was used to characterize the transition between age states at the transcriptional level. For the purposes of discussing up- and down-regulated genes, state I was considered as the baseline level of gene expression. We used a z-ratio method (Cheadle et al. 2003) to analyze our raw hybridization data and identify significantly changed transcripts. State II up-regulated and state II down-regulated genes were defined by z-scores of 1.50 or higher and −1.50 or lower. The pooled hybridization (state I-p/state II-p in Fig. 3) was not considered in this gene selection. By this criterion, 635 genes were significantly up- or down-regulated during the transition to state II of adulthood, providing a molecular signature for this aging state transition.
We compared our list of 635 genes to transcripts discovered in three landmark studies of C. elegans aging. These three studies defined differentially expressed genes found in daf-2 mutant animals compared with daf-2; daf-16 animals (Murphy et al. 2003), over an aging time course (Budovskaya et al. 2008) and after treatment with hyperbaric oxygen (Park et al. 2009). After converting the reported WormBase transcript IDs to official gene names, we had lists of 496 genes within the daf-2 transcriptome (“daf2”), 1,175 genes from the aging time course (“Aging”), 1,206 genes from the oxidative stress study (“Stress”), and 635 significantly regulated genes in state II worms (“State”).
Different subsets of transcripts are represented on the three different microarray platforms used in these studies, so in subsequent comparisons, we considered only the set of genes common to all platforms (Fig. S1, 13,900 common genes, see “Materials and methods”), resulting in 406 daf2 genes, 1,024 Aging genes, 926 Stress genes, and 413 State genes. Gene expression changes between states I and II may identify transcriptional targets for regulators of the aging processes controlling the transition between the states. Several of the significantly regulated genes found here are likely to be reporting on the action of the transcription factor DAF-16 (IIS/daf2 pathway (Oh et al. (2006)). Of 196 genes potentially regulated by DAF16 in a DAF16:DamID ChIP study (Schuster et al. 2010), we found that 4.1% of the genes in our set are daf16-responsive by this criterion, compared to 3.2% of the Aging set, 3.8% of the Stress set, and, not surprisingly, 16% of the daf2 set. We used a statistical tool (http://nemates.org/MA/progs/overlap_stats.html) to calculate the representativity factor for each pairwise comparison of lists, finding the following values: Aging/State 4.2, Aging/daf2 4.1, daf2/State 3.9, Stress/daf2 2.9, Stress/Aging 2.8, and Stress/State 2.3. These values indicate that the Age, State, and Daf gene sets have more in common with each other than with the Stress set.
We expanded this pairwise analysis by comparing three and four set Venn diagrams (Fig. 4). The three-set comparison was previously published, and it has been discussed (Park et al. 2009). Nearly a quarter (11/48) of the genes found in all of the three previous studies is also found in our list (compare centermost region of overlap in Fig. 4a, b). Only one of the four possible three-way comparisons (excluding Aging) is significantly different from the others (8 vs. 23, 37, and 23 when excluding State, daf2, and Stress respectively), suggesting that the three sets are more similar to Aging than they are to each other. This is confirmed in pairwise comparisons for the State set, where the State and Aging overlap (87/1,437, 6.0%) is much larger than the overlap between State and daf2 (11/819, 1.3%) or State and Stress (30/1,339, 2.2%). The same pattern is observed for the two other gene sets. The low degree of overlap between “daf2,” “Stress,” and “State” suggests that the transition between early states of aging is not predominantly a response to oxidative stress or daf2 signaling. The degree of overlap between “State” and “Aging” suggests that similarly to insulin signaling and stress response, the first state transition is a separate component of a broader and more general view of aging.
Fig. 4.

Venn diagrams compare gene list overlap between studies of daf2-mutant worms (daf-2 (Murphy et al. 2003)), aging time course (Aging, (Budovskaya et al. 2008)), hyperbaric oxygen (Stress, (Park et al. 2009)), and this study (State). a Comparison of daf-2 (blue), Aging (yellow), and Stress (green) significant gene lists. b Comparison of daf-2 (blue), Aging (yellow), Stress (green), and State (red) significant gene lists
Functional gene groups active during transition to middle age
To categorize the list of genes significantly regulated during the transition to middle age into functional groups, we used the database for annotation, visualization, and interactive discovery (DAVID v. 6.7 (Huang et al. 2009a; Huang et al. 2009b). To classify our gene set into functional clusters, we repeatedly ran the gene functional classification tool, utilizing all five predefined stringency parameters. These parameter sets resulted in 11 independent functional clusters of genes, presented in weighted rank order in Table 2. Two clusters contain genes of unknown functions: short chain dehydrogenases and secreted, cysteine-rich proteins. Interestingly, some of the genes in these clusters had been identified previously in other microarray analyses (Table 3).
Other clusters included four broad functional categories known to be involved in the aging process: heat-shock proteins (HSPs), cytochrome P450 family oxidases (P450 and sterol oxidases), insulin/IGF-1 signaling pathway components (Lund et al. 2002; Murphy et al. 2003; McElwee et al. 2004, and genes broadly affecting mitochondrial function (Feng et al. 2001; Lee et al. 2003; Dillin et al. 2002). In each functional cluster, our gene list included a number of genes not previously identified in other microarray studies of aging. Sorting individual animals by age state can reveal additional genes involved in aging compared to studies focused on chronological age alone.
We found components of the innate immune response in two other clusters: C-lectin and saposin-like genes (Nicholas and Hodgkin 2004). Although some of the member genes had been identified as significant in other microarray studies, we discovered at least one additional player in each of those functional clusters. Numerous antibacterial factors, namely, caenacin (CNC) proteins and lysozymes (LYS), were also found in our list, although they were not identified as significant functional clusters. These findings support an important role for antibacterial factors in the aging process, as suggested by Sánchez-Blanco and Kim (2011).
The discovery of an E3 ubiquitin ligase working through DAF16 (Li et al. 2007) precipitated a thorough evaluation of the involvement of Cullin and SKR (Skp-1 related) genes in lifespan determination (Ghazi et al. 2007). Although RNAi targeting of all of the Cullins and most of the SKR genes had no effect on wild-type animals' lifespan, we found that 8/21 SKR genes are significantly down-regulated during the transition to state II. This observation suggests that lifespan may not be directly impacted by interventions affecting this early transition. The three remaining functional groups found here include genes that code for proteins found directly complexed with substrates for E3 ubiquitin ligase: F-box, BTB, and Skp-1-related proteins. One cluster contains over a dozen F-box proteins, while another consists of genes that contain the MATH dimerization motif and the BTB-Tramtrack homology domain. BTB motifs have been found in numerous proteins associated with cullin-3 and ubiquitin E3 ligases (Xu et al. 2003). Finally, we also found a separate group that includes an E3 ligase (apc-11) and 2 ubiquitin-like proteins (ubl-5 and tag-277), as well as several Skp1-related proteins. The presence of all three types of proteasome targeting adapters suggests that proteolysis plays a significant role in regulating aging transitions.
Discussion
Imaging and machine vision have provided a novel way to measure aspects of sarcopenia in the C. elegans pharynx by using texture entropy, directionality (Shamir et al. 2009), and other low-level image descriptors. These measurements indicate that throughout their lifespan, individuals in a population tend to occupy a few discrete physiological states rather than exist in a continuum of physiologies. We have demonstrated here (Fig. 1) and in previous work (Johnston et al. 2008) that a mixture of at least two aging states is likely to be found in all groups of animals assayed at a given chronological age. In late life, individual variation in response to stress within an isogenic population has been previously observed by others and described as hidden heterogeneity (D. Wu et al. 2006). A model consisting of two sub-populations was consistent with the observations, where a long-lived sub-population showed a robust heat-shock response and a shorter-lived sub-population had a weaker heat-shock response. Ubiquitin-mediated proteolysis to maintain proteostasis was later shown to play an important role in the long-lived population (Ben-Zvi et al. 2009). We have demonstrated heterogeneity much earlier in the lifespan. This heterogeneity potentially complicates the interpretation of microarray studies of aging that incorporate many individuals at sampled timepoints (Lund et al. 2002; Budovskaya et al. 2008; McElwee et al. 2004).
Our ability to detect these discrete sub-populations allowed us to isolate them and compare their transcriptional profiles, where hierarchical clustering and PCA showed that the two sub-populations were indeed distinct. If pharynx morphology was not reflective of the physiology of the entire organism, we would not have been able to observe these differences in transcriptional states. Synchronized transitions must be taking place throughout the organism, implying tissue-to-tissue communication. A recent study (Durieux et al. 2011) showed that mitochondrial signals from neurons can affect the organism's lifespan through their action in the intestine. This mitokine action depends on the presence of ubl-5 in early adulthood. We find that this gene was significantly down-regulated in state II (Table 2, gene group 2), suggesting that this mitokine's action may be restricted to early adulthood, a result consistent with previous findings. This mitokine may be involved in synchronizing the transition among the body's tissues. Additionally, we discovered a functional group of small cysteine-rich proteins with signal peptides, potentially implicating them in similar cell non-autonomous effects.
We do not expect that worms in state I at day 5 would have measurably longer lifespans than those in state II because the bulk of the population undergoes the transition in less than 2 days. Furthermore, because the transition time for individual animals may be significantly shorter than 2 days, the average separation between individual worms in state I and state II may only be a matter of hours. Considering that the majority of the lifespan and opportunities for further loss of synchrony are still ahead at day 5, a measurable difference in lifespan between the two sub-populations at this timepoint is not expected. On the other hand, it is expected that manipulation of genes found in this study by over-expression or RNAi will lead to significant alterations in the timing of this transition, in turn leading to significant lifespan effects.
The molecular mechanism of the transition from state I to state II remains to be determined. Modeling this mechanism as a bulk reaction by measuring the temperature sensitivity of the transition timing shows that this process is temperature compensated. The existence of temperature compensation implies that this transition is regulated by a mechanism more complex than a simple rate-limited reaction. The classic example of a temperature-compensated process is that of circadian rhythms. In this case, while the temperature compensation effect may be a direct consequence of a requirement to uncouple short-term temperature fluctuations from cycle frequency, it may also be an indirect consequence of a more general requirement for the timing to be resistant to fluctuations in the kinetics of its underlying reactions due to, for example, small differences in gene expression levels. Thus, as with circadian rhythms, the temperature compensation in this age-state transition may be an indication of a robust timing mechanism that is not entirely dependent on a precise balance of underlying reaction rates (Hong et al. 2007).
The transition between states may depend on the up-regulation of heat-shock genes and detoxification enzymes (cytochrome P450s, glutaredoxin, glutathione-S-transferases, and peroxidases) because an aging organism marshals a response to deal with accumulating metabolic waste, as posited by the green theory of aging (Gems and McElwee 2005). Many genes in these classes were enriched in our gene functional classification analyses.
Ubiquitin-mediated protein degradation is the most highly enriched functional category within our set of significantly regulated genes, suggesting that targeted proteolysis is crucial to the onset of senescence early in post-developmental animals, as proposed in a recent review of proteostasis (Kirstein-Miles and Morimoto 2010). Proteolysis is also a theme shared by circadian rhythms and cell cycle regulation, providing a driving force for regulated transitions between distinct states (e.g., dark and light, metaphase and anaphase). Targeted proteolysis of Per and Tim proteins appears to ensure the maintenance of circadian rhythm in several organisms (Hunt and Sassone-Corsi 2007; Eide et al. 2005). Similarly, the anaphase promoting complex/cyclosome (APC/C) is an E3 ubiquitin ligase complex that triggers the metaphase–anaphase transition by dissolving the connections between sister chromatids after chromosome congression is complete (S. Kim and Yu 2011). Specific proteolysis of short-lived proteins is mediated by the proteasome, similarly to general proteolysis. In contrast, targeted proteolysis also requires an elaborate set of targeting adaptors (Skp1-related proteins, F-box, and BTB domain proteins) to identify the appropriate substrates for ubiquitination by E3 ligases. All three adaptors are represented in our list of significantly regulated functional gene groups. Targeted proteolysis appears to be an important theme of the transition that we have begun to characterize in this study.
Electronic supplementary material
(PDF 7 kb)
Acknowledgements
This work was supported entirely by the Intramural Research Program of the National Institutes of Health, National Institute on Aging.
References
- Benjamin H. Biologic versus chronologic age. J Gerontol. 1947;2(3):217–227. doi: 10.1093/geronj/2.3.217. [DOI] [PubMed] [Google Scholar]
- Ben-Zvi A, Miller EA, Morimoto RI. Collapse of proteostasis represents an early molecular event in Caenorhabditis elegans aging. Proc Natl Acad Sci U S A. 2009;106(35):14914–14919. doi: 10.1073/pnas.0902882106. [DOI] [PMC free article] [PubMed] [Google Scholar]
- Budovskaya YV, et al. An elt-3/elt-5/elt-6 GATA transcription circuit guides aging in C. elegans. Cell. 2008;134(2):291–303. doi: 10.1016/j.cell.2008.05.044. [DOI] [PMC free article] [PubMed] [Google Scholar]
- Cheadle C, et al. Analysis of microarray data using Z score transformation. J Mol Diagn: JMD. 2003;5(2):73–81. doi: 10.1016/S1525-1578(10)60455-2. [DOI] [PMC free article] [PubMed] [Google Scholar]
- Chow DK, et al. Sarcopenia in the Caenorhabditis elegans pharynx correlates with muscle contraction rate over lifespan. Exp Gerontol. 2006;41(3):252–260. doi: 10.1016/j.exger.2005.12.004. [DOI] [PMC free article] [PubMed] [Google Scholar]
- Dillin A, et al. Rates of behavior and aging specified by mitochondrial function during development. Science. 2002;298(5602):2398–2401. doi: 10.1126/science.1077780. [DOI] [PubMed] [Google Scholar]
- Durieux J, Wolff S, Dillin A. The cell-non-autonomous nature of electron transport chain-mediated longevity. Cell. 2011;144(1):79–91. doi: 10.1016/j.cell.2010.12.016. [DOI] [PMC free article] [PubMed] [Google Scholar]
- Eide EJ, et al. Control of mammalian circadian rhythm by CKIε-regulated proteasome-mediated PER2 degradation. Mol Cell Biol. 2005;25(7):2795–2807. doi: 10.1128/MCB.25.7.2795-2807.2005. [DOI] [PMC free article] [PubMed] [Google Scholar]
- Feng J, Bussière F, Hekimi S. Mitochondrial electron transport is a key determinant of life span in Caenorhabditis elegans. Dev Cell. 2001;1(5):633–644. doi: 10.1016/S1534-5807(01)00071-5. [DOI] [PubMed] [Google Scholar]
- Friedman DB, Johnson TE. A mutation in the age-1 gene in Caenorhabditis elegans lengthens life and reduces hermaphrodite fertility. Genetics. 1988;118(1):75–86. doi: 10.1093/genetics/118.1.75. [DOI] [PMC free article] [PubMed] [Google Scholar]
- Friedman DB, Johnson TE. Three mutants that extend both mean and maximum life span of the nematode, Caenorhabditis elegans, define the age-1 gene. J Gerontol. 1988;43(4):B102–109. doi: 10.1093/geronj/43.4.B102. [DOI] [PubMed] [Google Scholar]
- Gems D, McElwee JJ. Broad spectrum detoxification: the major longevity assurance process regulated by insulin/IGF-1 signaling? Mech Ageing Dev. 2005;126(3):381–387. doi: 10.1016/j.mad.2004.09.001. [DOI] [PubMed] [Google Scholar]
- Ghazi A, Henis-Korenblit S, Kenyon C. Regulation of Caenorhabditis elegans lifespan by a proteasomal E3 ligase complex. Proc Natl Acad Sci. 2007;104(14):5947–5952. doi: 10.1073/pnas.0700638104. [DOI] [PMC free article] [PubMed] [Google Scholar]
- Golden TR, Melov S. Microarray analysis of gene expression with age in individual nematodes. Aging Cell. 2004;3(3):111–124. doi: 10.1111/j.1474-9728.2004.00095.x. [DOI] [PubMed] [Google Scholar]
- Golden TR, et al. Age-related behaviors have distinct transcriptional profiles in Caenorhabditis elegans. Aging Cell. 2008;7(6):850–865. doi: 10.1111/j.1474-9726.2008.00433.x. [DOI] [PMC free article] [PubMed] [Google Scholar]
- Harman D. Aging: a theory based on free radical and radiation chemistry. J Gerontol. 1956;11(3):298–300. doi: 10.1093/geronj/11.3.298. [DOI] [PubMed] [Google Scholar]
- Hong CI, Conrad ED, Tyson JJ. A proposal for robust temperature compensation of circadian rhythms. Proc Natl Acad Sci. 2007;104(4):1195–1200. doi: 10.1073/pnas.0601378104. [DOI] [PMC free article] [PubMed] [Google Scholar]
- Huang DW, Sherman BT, Lempicki RA. Bioinformatics enrichment tools: paths toward the comprehensive functional analysis of large gene lists. Nucleic Acids Res. 2009;37(1):1–13. doi: 10.1093/nar/gkn923. [DOI] [PMC free article] [PubMed] [Google Scholar]
- Huang DW, Sherman BT, Lempicki RA. Systematic and integrative analysis of large gene lists using DAVID bioinformatics resources. Nat Protoc. 2009;4(1):44–57. doi: 10.1038/nprot.2008.211. [DOI] [PubMed] [Google Scholar]
- Hunt T, Sassone-Corsi P. Riding tandem: circadian clocks and the cell cycle. Cell. 2007;129(3):461–464. doi: 10.1016/j.cell.2007.04.015. [DOI] [PubMed] [Google Scholar]
- Johnson TE. Aging can be genetically dissected into component processes using long-lived lines of Caenorhabditis elegans. Proc Natl Acad Sci U S A. 1987;84(11):3777–3781. doi: 10.1073/pnas.84.11.3777. [DOI] [PMC free article] [PubMed] [Google Scholar]
- Johnston J, et al. Quantitative image analysis reveals distinct structural transitions during aging in Caenorhabditis elegans tissues. PLoS One. 2008;3(7):e2821. doi: 10.1371/journal.pone.0002821. [DOI] [PMC free article] [PubMed] [Google Scholar]
- Kenyon C, et al. A C. elegans mutant that lives twice as long as wild type. Nature. 1993;366(6454):461–464. doi: 10.1038/366461a0. [DOI] [PubMed] [Google Scholar]
- Kim S, Yu H. Mutual regulation between the spindle checkpoint and APC/C. Semin Cell Dev Biol. 2011;22(6):551–558. doi: 10.1016/j.semcdb.2011.03.008. [DOI] [PMC free article] [PubMed] [Google Scholar]
- Kirkwood TB, Rose MR. Evolution of senescence: late survival sacrificed for reproduction. Philosophical transactions of the royal society of London. Ser B Biol Sci. 1991;332(1262):15–24. doi: 10.1098/rstb.1991.0028. [DOI] [PubMed] [Google Scholar]
- Kirstein-Miles J, Morimoto RI. Caenorhabditis elegans as a model system to study intercompartmental proteostasis: interrelation of mitochondrial function, longevity, and neurodegenerative diseases. Dev Dyn: An Official Publ of the American Assoc of Anatomists. 2010;239(5):1529–1538. doi: 10.1002/dvdy.22292. [DOI] [PMC free article] [PubMed] [Google Scholar]
- Lee SS, et al. A systematic RNAi screen identifies a critical role for mitochondria in C. elegans longevity. Nat Genet. 2003;33(1):40–48. doi: 10.1038/ng1056. [DOI] [PubMed] [Google Scholar]
- Li W, et al. RLE-1, an E3 ubiquitin ligase, regulates C. elegans aging by catalyzing DAF-16 polyubiquitination. Dev Cell. 2007;12(2):235–246. doi: 10.1016/j.devcel.2006.12.002. [DOI] [PubMed] [Google Scholar]
- Lund J, et al. Transcriptional profile of aging in C. elegans. Curr Biol. 2002;12(18):1566–1573. doi: 10.1016/S0960-9822(02)01146-6. [DOI] [PubMed] [Google Scholar]
- McElwee JJ, et al. Shared transcriptional signature in Caenorhabditis elegans Dauer larvae and long-lived daf-2 mutants implicates detoxification system in longevity assurance. J Biol Chem. 2004;279(43):44533–44543. doi: 10.1074/jbc.M406207200. [DOI] [PubMed] [Google Scholar]
- Murphy CT, et al. Genes that act downstream of DAF-16 to influence the lifespan of Caenorhabditis elegans. Nature. 2003;424(6946):277–283. doi: 10.1038/nature01789. [DOI] [PubMed] [Google Scholar]
- Nicholas HR, Hodgkin J. Responses to infection and possible recognition strategies in the innate immune system of Caenorhabditis elegans. Mol Immunol. 2004;41(5):479–493. doi: 10.1016/j.molimm.2004.03.037. [DOI] [PubMed] [Google Scholar]
- Oh SW, et al. Identification of direct DAF-16 targets controlling longevity, metabolism and diapause by chromatin immunoprecipitation. Nat Genet. 2006;38(2):251–257. doi: 10.1038/ng1723. [DOI] [PubMed] [Google Scholar]
- Oliveros, JC, 2007. Available at: http://bioinfogp.cnb.csic.es/tools/venny/index.html
- Orlov N, et al. WND-CHARM: multi-purpose image classification using compound image transforms. Pattern Recognit Lett. 2008;29(11):1684–1693. doi: 10.1016/j.patrec.2008.04.013. [DOI] [PMC free article] [PubMed] [Google Scholar]
- Park S-K, Tedesco PM, Johnson TE. Oxidative stress and longevity in Caenorhabditis elegans as mediated by SKN-1. Aging Cell. 2009;8(3):258–269. doi: 10.1111/j.1474-9726.2009.00473.x. [DOI] [PMC free article] [PubMed] [Google Scholar]
- Pincus Z, Slack FJ. Transcriptional (dys)regulation and aging in Caenorhabditis elegans. Genome Biol. 2008;9(9):233. doi: 10.1186/gb-2008-9-9-233. [DOI] [PMC free article] [PubMed] [Google Scholar]
- Pincus Z, Slack FJ. Developmental biomarkers of aging in Caenorhabditis elegans. Dev Dyn: An Official Publ of the American Association of Anatomists. 2010;239(5):1306–1314. doi: 10.1002/dvdy.22224. [DOI] [PMC free article] [PubMed] [Google Scholar]
- Pittendrigh CS. Circadian rhythms and the circadian organization of living systems. Cold Spring Harb Symp Quant Biol. 1960;25:159–184. doi: 10.1101/SQB.1960.025.01.015. [DOI] [PubMed] [Google Scholar]
- Rea SL, et al. A stress-sensitive reporter predicts longevity in isogenic populations of Caenorhabditis elegans. Nat Genet. 2005;37(8):894–898. doi: 10.1038/ng1608. [DOI] [PMC free article] [PubMed] [Google Scholar]
- Ruoff P, Rensing L. Temperature effects on circadian clocks. J Therm Biol. 2004;29(7–8):445–456. doi: 10.1016/j.jtherbio.2004.07.004. [DOI] [Google Scholar]
- Sánchez-Blanco A, Kim SK. Variable pathogenicity determines individual lifespan in Caenorhabditis elegans. PLoS Genet. 2011;7(4):e1002047. doi: 10.1371/journal.pgen.1002047. [DOI] [PMC free article] [PubMed] [Google Scholar]
- Schuster E, et al. DamID in C. elegans reveals longevity-associated targets of DAF-16/FoxO. Mol Syst Biol. 2010;6:399. doi: 10.1038/msb.2010.54. [DOI] [PMC free article] [PubMed] [Google Scholar]
- Shamir L, Wolkow CA, Goldberg IG. Quantitative measurement of aging using image texture entropy. Bioinformatics (Oxford, England) 2009;25(23):3060–3063. doi: 10.1093/bioinformatics/btp571. [DOI] [PMC free article] [PubMed] [Google Scholar]
- Simm A, Johnson TE. Biomarkers of ageing: a challenge for the future. Exp Gerontol. 2010;45(10):731–732. doi: 10.1016/j.exger.2010.08.006. [DOI] [PubMed] [Google Scholar]
- Simonetta SH, et al. Timing of locomotor activity circadian rhythms in Caenorhabditis elegans. PLoS One. 2009;4(10):e7571. doi: 10.1371/journal.pone.0007571. [DOI] [PMC free article] [PubMed] [Google Scholar]
- Walker RF. Developmental theory of aging revisited: focus on causal and mechanistic links between development and senescence. Rejuvenation Res. 2011;14(4):429–436. doi: 10.1089/rej.2011.1162. [DOI] [PubMed] [Google Scholar]
- Weissman A. The duration of life. In Weissman on Heredity. London: Oxford University Press; 1891. [Google Scholar]
- Whittenberger JL. The nature of the response to stress with aging. Bull N Y Acad Med. 1956;32(5):329–336. [PMC free article] [PubMed] [Google Scholar]
- Williams GC. Pleiotropy, natural selection and the evolution of senescence. Evolution. 1957;11(4):398–411. doi: 10.2307/2406060. [DOI] [Google Scholar]
- Wu D, et al. Visualizing hidden heterogeneity in isogenic populations of C. elegans. Exp Gerontol. 2006;41(3):261–270. doi: 10.1016/j.exger.2006.01.003. [DOI] [PubMed] [Google Scholar]
- Xu L, et al. BTB proteins are substrate-specific adaptors in an SCF-like modular ubiquitin ligase containing CUL-3. Nature. 2003;425(6955):316–321. doi: 10.1038/nature01985. [DOI] [PubMed] [Google Scholar]
- Yu S, Driscoll M. EGF signaling comes of age: promotion of healthy aging in C. elegans. Exp Gerontol. 2011;46(2-3):129–34. doi: 10.1016/j.exger.2010.10.010. [DOI] [PMC free article] [PubMed] [Google Scholar]
Associated Data
This section collects any data citations, data availability statements, or supplementary materials included in this article.
Supplementary Materials
(PDF 7 kb)