

Abstract
Amphibian oocytes have the special ability to directly induce the transcription of pluripotency and other genes in transplanted somatic nuclei. To this extent, oocytes induce a stem cell-like pattern of transcription in somatic cell nuclei. We ask whether the induced transcription in transplanted nuclei reflects the normal transcriptional activity of oocyte genes. We describe here the transcript content of a wide range of genes in Xenopus tropicalis oocytes. Using accurate quantitation, we find that each mature oocyte has accumulated several hundred transcripts of cell-type specific genes. This value is several orders of magnitude greater than the “leakage” level found in most somatic cells and about the same level found in somatic cells where these genes are fully expressed. Illumina sequencing confirms the high transcript content of a mature Xenopus oocyte. Most of the transcripts from these highly expressed genes in oocytes are correctly and efficiently spliced. Our results contribute a more quantitative view of certain amphibian oocyte transcripts than previously available. Our results also show that transplanted somatic nuclei conform, with respect to the genes analyzed, to the transcriptional characteristics of the recipient oocytes.
Introduction
For over 100 years, people have been fascinated by the remarkable structure of lampbrush chromosomes, localized in the nucleus [germinal vesicle (GV)] of an amphibian oocyte. Lampbrush chromosomes [1] have been described as structures with a multitude of extended loops where transcription is active [2–6]. Several studies have shown that the RNA polymerases II and III and several RNA-processing components are associated with the nascent transcripts on the loops of all lampbrush chromosomes, suggesting that the amphibian oocyte may be a very unusual cell in which a wide variety of genes are actively transcribed [7]. In contrast, Davidson proposed a different interpretation of lampbrush chromosomes where most of the genes are not actively transcribed, as is the case for somatic cells [8,9]. Therefore, the range of genes transcribed in these oocytes is not clear. This question has acquired a new interest in view of the surprisingly wide range of genes transcribed by somatic nuclei that have been transplanted to Xenopus oocytes [10]. Does this reflect the normal state of oocyte transcription, or is it an artifact of nuclear transfer? Several years ago, Rosbash and others described, in Xenopus laevis, the presence of 200,000 globin transcripts per oocyte [11]. More recently, microarray analysis has been performed to compare gene expression in the mouse, cow, and frog oocytes [12], and a very wide range of transcripts were detected. However, an accurate quantitative analysis of amphibian oocyte transcripts has not been made so far.
Taking advantage of current methodology, we focused on the transcript content of Xenopus tropicalis, whose genome has been recently fully sequenced (August 2005; www.ncbi.nlm.nih.gov/projects/genome/guide/frog/). We first started to look for the presence of a selection of lineage-determining and terminal differentiation transcripts as well as oocyte-specific transcripts. Surprisingly, we found transcripts of myogenic, neurogenic, and terminal cell-type lineages, not expected to be seen at the oocyte stage. We also isolated transcripts from ribosomal depleted RNA for deep sequencing on the Illumina platform and found a very wide range of transcripts, compared with somatic cells. We conclude that an amphibian oocyte is a very unusual cell with respect to the range of genes whose transcripts are present at a high level. This helps to explain why the nuclei of somatic cells are induced to transcribe so many different kinds of genes, including those for pluripotency, when transplanted to Xenopus oocytes. We suggest that the genome of an amphibian oocyte is widely transcribed and that this characteristic may be related to the preparation of the genome, in early embryos, for a rapid lineage selection by the expression of alternative differentiation pathways.
Methods
Oocytes maintenance and Hoechst staining
After removal from the X. tropicalis ovary, oocytes were kept at 23°C in modified Barth saline (MBS) medium [88 mM NaCl, 1 mM KCl, 2.4 mM NaHCO3, 10 mM Hepes, pH 7.5, 0.82 mM MgSO4, 0.33 mM Ca(NO3)2, and 0.41 mM CaCl2]. Three milliliters of packed oocytes, to which is added 9.5 mL of MBS medium and 7 U of liberase (Roche), was incubated with gentle shaking for 2 h at room temperature to remove the follicular cell layers [13]. Oocytes were incubated in 1×MBS + 1 μL of Hoechst (from stock 10 μg/μL) for 10 min to stain the follicular cell nuclei.
Cell lines
Embryonic stem (ES) cells were kindly provided by Prof. A. Surani. The C2C12 cell line was purchased from the American Tissue Culture Collection.
High-throughput sequencing analysis
Starting from 200 X. tropicalis oocytes, ∼200 μg of total RNA have been recovered (∼1 μg of total RNA per X. tropicalis oocyte). Ribosomal-depleted RNA was obtained using RiboMinus (Invitrogen) and fragmented using fragmentation reagents (Ambion). After RNA precipitation and purification, reverse transcription was performed and double-stranded cDNA has been obtained. End repair and 3′ adenylation were performed before Illumina adaptor ligation. The obtained cDNA was then purified and size selected before polymerase chain reaction (PCR). The quality of the final library was checked by Bioanalyzer (Agilent) and Qubit (Invitrogen). Clusters were generated and sequenced as 36 bp single reads on a GAIIx. The oocyte RNA expression profile was analyzed in the following way: the set of Illumina sequence reads was first searched against a database of Xenopus ribosomal RNA sequences and matching reads were discarded. Next, the set of X. tropicalis transcript sequences was downloaded from the Ensembl BioMart database in fasta format. The set of Illumina sequence reads was mapped against this using SSAHA2 with the scoring limit relaxed to allow up to 2 mismatches. Reads that matched transcript sequences from more than one gene were discarded. Allowing for multiple transcripts for some genes, the number of unique reads matching each gene was counted and the average transcript length for each gene was calculated. The read counts were then normalized according to transcript length and sample size following the method of Mortazavi et al. [14], to give a value for reads per kb per million reads (RPKM) according to the following formula: RPKM=(unique reads per gene)/{((average transcript length for gene)/103)×((total mapped reads in sample)/106)}.
RNA extraction and reverse transcription
RNA was extracted from 8 full size (800 μm diameter) X. tropicalis oocytes using the RNeasy kit (Qiagen) following the instructions of the manufacturer. The RNA was eluted in 27 μL RNase-free water and used for reverse transcription in a final volume of 50 μL. For reverse transcription, either gene-specific or random hexamer primers were used. cDNA was diluted to 100 μL, aliquoted, and stored at −80°C. Spike-in experiments were done in the presence of tRNA as RNA carrier and 0.1% bovine serum albumin.
PCR/quantitative PCR
Semiquantitative PCR (semi-qPCR) was used to amplify part of the sequence of the chosen genes to be used as a standard curve. For this purpose, the forward and reverse primers contain the T7 and T3 sequences (capital letters) to make mRNA and subsequently cDNA. The following X. tropicalis primers were used for semi-qPCR:
Arg1 F: GCTTGATTCTAATACGACTCACTATAGGGtg gtctggacccaagtat
Arg1 R: AAAGTCATGTCAAGCGCAGTGT
B4 F: GCTTGATTCTAATACGACTCACTATAGGGtgaaa ccccaaaagaagg
B4 R: ATGATTATGGTCACTTCTTCCCTTTC
Beta globin F: GCTTGATTCTAATACGACTCACTATAG GGatggttaatctgacagca
Beta globin R: TTGCGGCCGCTAATTAACCCTCACTAA AGGGgtggtaacccttgccaag
Brachyury F: GCTTGAATTCTAATACGACTCACTATAG GGatgagtgtaagtgccacc
Brachyury R: TTGCGGCCGCTAATTAACCCTCACTAA AGGGccctttactacgtgcagg
Brachyury F1: GCTTGAATTCTAATACGACTCACTAT AGGGtagcagataattcttcag
Brachyury R1: ACGTCATACTGGTTTTCTGCTATTTC
Eomesodermin F: GCTTGATTCTAATACGACTCACTA TAGGGggatctgaacgactctgct, Eomesodermin R: TGCCCCC ATGTCCAGTTTAT;
Myf4 F: GCTTGATATCTAATACGACTCACTATAGGGa tggagctttttgaacc,
Myf4 R: TTGCGGCCGCTAATTAACCCTCACTAAAGG Gttctagcagggttatgta;
Myf5 F: TGATATCTAATACGACTCACTATAGGGatgga gatggtagatacc,
Myf5 R: TTGCGGCCGCTAATTAACCCTCACTAAAGG Gtagtacatggtagattgg;
MyoD F: GCTTGATATCTAATACGACTCACTATAGGG atggagctgttgccccca,
MyoD R: TTGCGGCCGCTAATTAACCCTCACTAAAGG Ggagtatgggctgaaggaa;
NeuroD1 F:GCTTGAATTCTAATACGACTCACTATAGG Gcttatatattattatgtg,
NeuroD1 R:TTGCGGCCGCTAATTAACCCTCACTAAA GGGtcgtgaaagatggcatta;
Pou25 F: GCTTGATTCTAATACGACTCACTATAGGGa tgtacagccaacagccc;
Pou25 R: TTGCGGCCGCTAATTAACCCTCACTAAAGG Gtatagagaggttgggcaa;
POU60 F: GCTTGATTCTAATACGACTCACTATAGGGa tggctccagcagggcca,
POU60 R: TTGCGGCCGCTAATTAACCCTCACTAAAG GGagacagcagctgttgcag;
PRC1: F: GCTTGATTCTAATACGACTCACTATAGGGg cagcttgaggaggaaatgtattat,
PRC1: R: TTGCGGCCGCTAATTAACCCTCACTAAAGG Gtccattcaactcggacatattctctt;
Sox3: F: GCTTGATTCTAATACGACTCACTATAGGGaa aggcaatgcttctatc,
Sox3: R: GGGCAGGTACATGCTGATCA;
Thy1 F: GCTTGATTCTAATACGACTCACTATAGGGttg tatacctgcaatttg,
Thy1 R: AAGTGAAAGTAGGAAGGCAAATGG.
Real-time PCR primers are listed in Supplementary Fig. S2. The Applied Biosystems 7300 real-time PCR system in a 96-well format with Power SYBR Green PCR Master Mix (AB) was used for quantitative analysis. The number of transcripts per oocyte was obtained in the following way. We generated a standard curve using a known amount of cDNA containing the appropriate sequences. We divided the amount of DNA (in the range of 1,000 fg to 0.1 fg for low abundant transcripts and in the range of 10 ng to 100 fg for highly abundant transcripts) by its molecular weight (base pair×660 g/mol). This value was multiplied by the Avogadro's number (6.022×10²³) to obtain the absolute number of transcripts. To estimate the absolute number of transcripts, we compared the Ct value of the transcripts present in the oocyte to the Ct values of the standard curve. This value was then corrected for the number of oocytes used and the dilutions of the sample starting from the RNA extraction step. Samples were normalized against the total amount of RNA.
Results
Follicle cells can be completely removed from X. tropicalis oocytes
To analyze an oocyte's transcript content, we chose to use X. tropicalis oocytes, as its genome has been fully sequenced. X. tropicalis oocytes, like X. laevis oocytes, can be easily collected from the frog ovary at stages V and VI [15], in first meiotic prophase. Each oocyte was wrapped in about 5 transparent layers of about 10,000 follicular cells, not visible under normal light (Fig. 1a). The presence of the follicular cell layers would interfere with the precise quantitation of the transcripts present in the oocyte itself. As the nucleus of the oocyte (GV) contains only one tetraploid chromosome set, even a few transcriptionally active follicle cells not removed from an oocyte could distort the results. For this reason, before all experiments, we removed the follicular cells by treating oocytes with an enzyme preparation, liberase, which loosens the cell layers surrounding the oocyte [13]. Oocytes were incubated either in the presence or absence of liberase for 2 h at room temperature before they were stained with Hoechst. In the absence of liberase, thousands of follicular cell nuclei were visible, under ultraviolet light, surrounding each oocyte (Fig. 1b). Liberase treatment is very effective in removing the follicular cells as a largely entire layer rather than releasing single follicle cells (Fig. 1c). This leaves the oocytes with almost no attached follicular cells (even a single remaining follicular cell is easily visible) (Fig. 1d). Only liberase-treated oocytes, checked for the lack of even a single follicle cell, have been used for all the following experiments. To further check that follicle cells do not contribute to the transcript values that we find in oocytes, we analyzed transcripts in samples consisting only of different numbers of follicle cells. We detected only a minimal number of transcripts for many of the oocyte transcribed genes, even in 100,000 follicle cells collected from 10 oocytes (Table 1). As expected, follicle cell layers contain an abundance of globin transcripts. This result further demonstrates that even the presence of few follicle cells cannot interfere with the accurate measurement of the oocyte transcripts.
FIG. 1.
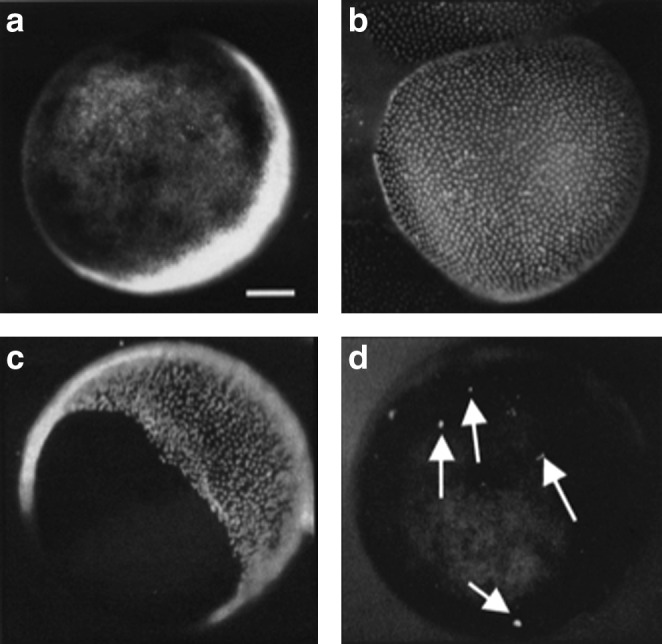
The follicular cell layers surrounding the Xenopus tropicalis oocytes do not interfere with the quantitation of the specific oocyte transcripts. Liberase treatment efficiently removes follicle cells from oocytes. Oocytes are checked under a stereomicroscope with either normal light (a) or ultraviolet light (b–d) after Hoechst staining to detect the presence of follicular cells. (b) Thousands of follicular cell nuclei surrounding a single oocyte are visible after Hoechst staining. (c) Follicular cells are partially detached as a whole layer during liberase treatment. (d) After liberase treatment, very rarely, a few follicular cells remain attached to the oocyte. These can be seen, and such oocytes were discarded. Arrows (in d) point to 4 follicular cells. In all panels, oocytes are positioned with the brown-pigmented animal cap facing up and to the left and the white vegetal pole facing down to the right. Scale bar: 100 μm. All the tested transcripts (apart from globin) that are abundantly present in the oocyte are absent in the follicle cells (see Table 1).
Table 1.
Transcripts in Isolated Follicle Cell Layers
| |
No. of total transcripts |
|
|---|---|---|
| Gene | Follicle cells collected from 10 oocytes (105cells) | In a single follicle cell |
| Pou-25 | 300 | 0.003 |
| PRC-1 | 0 | 0 |
| MyoD1 | 450 | 0.005 |
| NeuroD | 150 | 0.002 |
| Brachyury | 150 | 0.002 |
| Globin | 10.9×10⁶ | 110 |
RNA from oocyte-specific genes, pluripotency genes, and lineage-determining genes were assayed by real-time polymerase chain reaction in isolated follicle cells. Primers within 1 exon were used to determine the presence of the represented transcripts.
We have tested the efficiency of RNA recovery in all our experiments using a “spike-in” addition of mouse RNA determined from the optical density of large amounts of purified mRNA. A known number of transcripts of mouse neurogenin were added to samples of 8 oocytes. Following RNA extraction, cDNA synthesis, and real-time PCR, we recovered an average of 90%–95% of the total added mouse neurogenin RNA even for concentrations lower than 1 fg (Supplementary Fig. S1; Supplementary Data are available online at www.liebertonline.com/scd). Concentrations of mouse neurogenin higher than 60 pg were fully recovered after real-time PCR. The average percentage of RNA recovery (93%) was used to correct our values for detectable oocyte transcripts in our RNA extraction experiments.
Xenopus tropicalis oocytes contain a wide variety of transcripts including those for lineage determination and terminal differentiation
To establish whether transcripts representative of different somatic cell lineages are present in a Xenopus oocyte, we tested MyoD1 [16], Myf4 [17] and Myf5 [18], Xbrachyury [19], eomesodermin [20], and beta globin [21] as representative of the mesodermal lineage, NeuroD1 [22], FoxD1 [23], and Sox3 [24] representing the ectodermal lineage, Arg1 [25] representing the endodermal lineage, Pou25 [26] and Pou60 [27] representing pluripotency genes, B4 as an oocyte-specific gene [28], and PRC1 [29] as a representative of cytokinesis regulators (Table 2). We found that transcripts of all these lineages, mostly somatic, are present in lampbrush-stage oocytes.
Table 2.
Genes Whose Transcripts Were Assayed in Xenopus tropicalis Oocytes
| Gene | Class of gene | Accession number |
|---|---|---|
| B4 | Histone | 549145:b4|CR761180.2 |
| PRC1 | Cytokinesis regulator | 100216075:prc1|NM_001142060.1 |
| Pou25 | Pluripotency | 100170181:pou5f1.1|NM_001129934.1 |
| Pou60 | Pluripotency | 100126212:pou6f1|NM_001110050.1 |
| Sox3 | Ectoderm | 493228:sox3|NM_001007501.1 |
| FoxD1 | Neurogenic | 493510:foxd1|NM_001008147.1 |
| Brachyury | Early zygotic | 493501:t|NM_001008138 |
| Eomes | Early zygotic | 100038065:eomes|CT025431.2 |
| β-Globin | Blood | 394453:LOC394453 |
| Thy1 | Thymocyte | XM_002935007.1 |
| Arg1 | Liver lineage determining | 448355:arg1|NM_001006713.1 |
| MyoD1 | Myogenic | 394569:myod1NM_203641 |
| NeuroD1 | Myogenic | 100038290:neurod1|NM_001097399 |
| Myf4 | Myogenic | 549479:myog|NM_001016725 |
| Myf5 | Myogenic | 394529:myf5|NM_203601 |
We measured the absolute number of transcripts for each selected gene using real-time PCR (see list of qPCR primers in Supplementary Fig. S2). The use of primers within an exon allowed us to determine the total amount of transcripts, spliced and unspliced. As expected, we detected a very high number (47 million) of the oocyte-specific linker histone B4 transcripts (Table 3). Sox3, Pou25, Pou60, and PRC1 are also very abundant (hundreds of thousands per oocyte). Transcripts characteristic of terminal differentiation such as Thy1 (thymocytes) and Arg1 (liver), transcripts of lineage determination genes such as MyoD1, Myf4, Myf5, and NeuroD1, and transcripts of early embryo genes such as Xbra and Eomes are present in the oocyte with an absolute number of transcripts ranging from 240 to 1,200. β-globin transcripts are unexpectedly abundant (see Discussion section). A summary of these data is presented in Table 3.
Table 3.
Transcripts Detected by Real-Time Polymerase Chain Reaction
| Gene | Total amount of transcripts/oocyte | Absolute no. of transcripts/oocyte |
|---|---|---|
| B4 | 61.4±12.8 pg | 4.7×10⁷ |
| Sox3 | 1585.0±14.0 fg | 34.0×10⁵ |
| Pou25 | 1050.0±212.0 fg | 10.8×10⁵ |
| Pou60 | 168.0±13.0 fg | 10.8×10⁵ |
| PRC1 | 335.0±7.0 fg | 3.8×10⁵ |
| β-Globin | 66.2±4.5 fg | 8.4×10⁴ |
| MyoD1 | 1.0±0.7 fg | 1,083 |
| Myf4 | 1.7±0.5 fg | 723 |
| Myf5 | 0.25±0.0 fg | 241 |
| Bra | 0.3±0.28 fg | 753 |
| Eomes | 1.8±1.0 fg | 1,204 |
| NeuroD1 | 0.5±0.1 fg | 295 |
| Arg1 | 0.3±0.3 fg | 301 |
| Thy1 | 1.0±0.6 fg | 301 |
See Fig. 2A for a diagram explaining the choice of primers. The total amounts of transcripts have been converted into absolute numbers per oocyte. Results are mean±standard deviation of 3 independent experiments.
We conclude that, in X. tropicalis oocytes, transcripts that appear to be not required at the oocyte stage are nevertheless present, albeit in different amounts.
Transcripts are mostly present in spliced form in the oocyte
To understand why the oocyte contains transcripts that could encode proteins thought to be not required at the oocyte stage, we designed primers on introns to discriminate between spliced and unspliced transcripts (Fig. 2A). It seems possible that splicing could be very inefficient and that primary transcripts would not yield proteins. Our results show that, for all the analyzed genes, transcripts are mainly present in the oocyte in a spliced form (Fig. 2B, C). In particular, the most abundant transcripts do not show any detectable unspliced transcripts. Some of the less abundant transcripts, such as MyoD1 and NeuroD, have a significant proportion of unspliced transcripts (Fig. 2B, C).
FIG. 2.

Most transcripts are efficiently spliced. (A) Primers (F, forward; R, reverse) were chosen in the same exon to detect both spliced and unspliced transcripts. Primers in the same intron were used to measure unspliced transcripts alone. (B) The amount of the unspliced transcripts (pg or fg) has been converted into absolute numbers of unspliced transcripts per oocyte. Unspliced transcripts have been also represented as a percentage of the total transcripts. (C) The majority of total transcripts are correctly spliced. Black and gray bars represent total and unspliced transcripts, respectively. Results are mean±standard deviation of 3 independent experiments (oocytes isolated and processed from 3 frogs). Note that Sox3 does not include any unspliced transcripts because of the absence of introns. The most abundant transcripts are represented in single charts. The low abundant transcripts are represented together in a chart at the bottom right of the figure.
The experiments described so far were performed by real-time PCR using sets of primers designed to recognize either the same exon or the same intron. Primers were close to the 3' region of each transcript. To check that the efficiency of splicing does not vary between different introns in the same gene, we used another set of primers designed for genes containing one or more introns (Fig. 3A, F+R and F1+R are examples of primer pairs). For these sets of experiments, we used semi-qPCR with the same batches of X. tropicalis oocytes as for the previous real-time PCR experiments. These results confirm the previous conclusions that almost all transcripts are present in the oocyte in spliced form (Fig. 3B). We conclude that oocytes have a generally effective splicing capacity even for transcripts that would not seem to be required for oogenesis.
FIG. 3.

Introns are efficiently spliced out in X. tropicalis oocytes. (A) Diagram showing primer position for splicing events that are not adjacent. (B) A selection of primer sets has been designed for adjacent or distant exons to test whether different introns are spliced out with the same efficiency. Myf5 1 represents primers for Myf5 transcripts that spread between exon 1 and exon 2. A similar design has been used for the other genes. β-Globin: 1, exon 1– exon 2; 2, exon 2 – exon 3; Pou25: 1, exon 1 – exon 2; 2, exon 3 – exon 4; 3, exon 4 – exon 5; Pou60: 1, exon 2 – exon 3; B4: 1, exon 1 – exon 2; 2, exon 2 – exon 3; PRC1: 1, exon 9 – exon 19; 2, exon 10 – exon 11; 3, exon 11 – exon 12; Xbra: 1, exon 1 – exon 2; 2, exon 7 – exon 8; 3, exon 6 – exon 8. Weak bands exist near the bottom of the tracks for Pou60.1 and PRC1.1. All DNA bands present on the agarose gel represent spliced transcripts in accord with their small sizes. M, marker track for size recognition.
We considered the possibility that oocytes might fail to transport their unexpected transcripts to the cytoplasm and so not translate these transcripts into proteins. We dissected 30 GVs in oil to avoid loss during aqueous isolation [30] and tested MyoD1, Myf4, Neurogenin 1a, and beta-globin transcripts. Transcripts are present in the cytoplasm at about a 30 times higher level than in the GV of the same oocyte (not shown) and therefore at a similar concentration throughout the oocyte. The transfer of transcripts from nucleus to cytoplasm is therefore about as efficient in oocytes as in somatic cells [31].
We conclude that the oocyte is an unusual cell that contains a representation of transcripts characteristic of several specialized somatic cell types and that these primary transcripts are efficiently spliced and transplanted to the cytoplasm, as in most cell types.
Xenopus oocytes have an unusual transcript content by comparison with somatic cells
To understand the general significance of transcripts not obviously required for oogenesis, we compared the number of transcripts found in X. tropicalis oocytes with those in other cell types. Values are included in Table 4 for mouse T101/2 cells, mouse proliferating and differentiated C2C12 cultured cells, mouse thymus cells, and mouse ES cells. We found that ES cells, as expected, have a high content of Oct4 transcripts and a significant content of other gene transcripts, in accord with the results of Efroni et al. [32]. C2C12 cells are related to mesodermal and muscle differentiation [33] and, as expected, have a substantial content of MyoD. Thymocytes contain many transcripts of Thyl, but not of the other markers tested. X. tropicalis oocytes therefore have a high content of the cell-type–specific transcripts assayed. In contrast, somatic cells, as represented by 10T1/2, C2C12 cells, and thymocytes, do not contain a significant number of other tissue-specific transcripts. Nevertheless, because of the large size of an oocyte, the concentration of somatic-specific transcripts in an oocyte is not unusual. Rather it is the number of these transcripts per cell that is exceptional, and this point is elaborated in the Discussion section.
Table 4.
Transcript Numbers per Cell
| Gene | Mouse 10T1/2 | Mouse C2C12 proliferating | Mouse C2C12 differentiated | Mouse thymocytes | Mouse ES cell | Xenopus tropicalis oocyte |
|---|---|---|---|---|---|---|
| MyoD | 0.3 | 20–50 | 200 | 0 | 1 | 1,080 |
| Myogenin | 0 | 5–7 | 30 | 0 | 0.5 | 725 |
| NeuroD | 0 | 0 | 0 | 0 | 15 | 295 |
| Thy-1 | 5 | 0 | 0 | 250 | 6 | 300 |
| Oct4a | 0b | 0 | 0 | 0b | 420 | 11×105 |
The absolute number of total transcripts per single cell was determined by real-time quantitative polymerase chain reaction. 10T1/2, C2C12 thymocytes, and embryonic stem (ES) cells are mouse cell lines. Results are the average of 3 independent experiments. Values for X. tropicalis oocytes are shown for easy comparison and were taken from Table 3.
Semiquantitative PCR (semi-qPCR).
Same as Pou60/Pou25 for X. tropicalis.
To relate the level of transcripts in an oocyte to that in somatic cells where a gene is presumed to have an essential function, we analyzed MyoD1 transcripts in more detail. We tested the presence of MyoD not only at the oocyte stage but also in the unfertilized egg and at other developmental stages (Fig. 4). The amount of MyoD transcripts present at the oocyte stage is progressively reduced from the unfertilized egg stage and is completely absent from the 2-cell stage up to stage 7. MyoD1 transcripts then start to reappear after stage 8, soon after the midblastula transition (Fig. 4). A Xenopus embryo at stage 26 has around 120,000 cells. If we consider that 5% of the total number of cells in an embryo is represented by functional muscle cells, each muscle cell contains about 0.04 fg or 200 transcripts of MyoD (Fig. 4). An oocyte therefore contains more MyoD transcripts (over 1,000) than a functional muscle cell (Table 3).
FIG. 4.
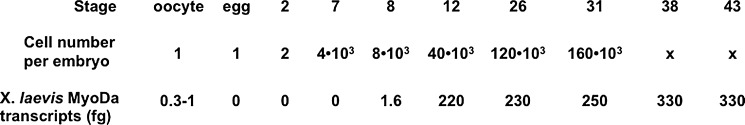
Analysis of Xenopus transcripts at different stages of development. MyoDa transcripts were determined by real-time quantitative polymerase chain reaction (qPCR) in Xenopus laevis. MyoDa transcripts are present at the oocyte stage but are absent in an unfertilized egg, stage 2 cell, and stage 7. After the midblastula transition, MyoDa transcripts start to be accumulated as the percentage of muscle cells increases in the embryo. At stages 12–43, it is assumed that the cells that contain MyoD are 5% of the total cell number. Semi-qPCR has been performed to detect maternally or zygotically inherited transcripts. RNA was extracted from samples of 8 embryos. Reverse transcription was carried out by PCR. At stage 26, 5% of total cells (ie, 6,000) are assumed to be muscle, and altogether these contain ∼250 fg MyoD transcripts. This is equivalent to 0.04 fg or 200 transcripts of MyoD per cell.
One explanation for the presence of lineage-specific transcripts in an oocyte is that the level observed is no more than that of transcriptional leakage and that this level is what would be expected in any somatic cell. We have therefore carried out qPCR transcript assays on a range of somatic cell types, using the same primers and procedure as we have used for oocyte and somatic cell assays (Table 4). We found a substantial transcript content for lineage-specific genes in the appropriate cell type, as expected. Mouse ES cells, which were predisposed to differentiate in a neural direction, gave a value of 15 transcripts of neuroD per cell (Table 4). In all other cases, we did not find more than one transcript per cell. Because many tissues contain a variety of cell types, including fibroblasts, we analyzed blood cells, which are relatively homogeneous with respect to blood cell types for a range of transcripts. We recorded 1.5 transcripts per cell for Arg1, 1.3 transcripts per cell for Pou60, and nil transcripts per cell for B4, Pou25, Sox3, Eomes, MyoD, NeuroD, Myf4, and Myf5 (data not shown). The nil values were generally around Ct38 and therefore well below a Ct value of about 30 for 1 transcript per cell. Most of these “nil” values amounted to less than an average of 1 transcript per 100 cells. As a positive control, we recorded well over 100 transcripts for β-globin in an average blood cell. We conclude that, using our methods, the leakage level is <1 transcript per cell for all cell types tested with respect to 14 different genes. The transcript level for these genes in an oocyte is therefore several hundred times greater than the negligible leakage level seen in other cell types.
We should comment on the anomalous position of 100,000–200,000 β-globin transcripts per oocyte ([11] and Table 3). An explanation we can offer for this is that these transcripts are transferred into the oocyte from the blood supply that surrounds each oocyte. It is known that half of the total content of an oocyte, namely the yolk, is synthesized as protein in the liver and is transferred into the oocytes through the blood supply and through the follicle cells [34,35]. We suggest that some of the globin transcripts in the blood are taken up, as it were inadvertently, by the oocytes when they absorb protein, and probably degradation products of dying blood cells, from the blood supply.
Transcriptome analysis of X. tropicalis oocytes using high-throughput sequencing
So far we have made a quantitative description of a limited number of gene transcripts. We now ask whether these characteristics of oocyte transcription are widely applicable to other genes. To obtain a full survey of transcripts present in the X. tropicalis oocyte, we prepared an RNA library to be sequenced by Illumina, a current sequencing platform. We extracted total RNA from 200 defolliculated (liberase treated) X. tropicalis oocytes. Total RNA was then depleted of the ribosomal RNAs, which represent more than 80% of the total RNAs of an oocyte. Figure 5A shows how the experiment has been designed for the Illumina library construction.
FIG. 5.

Illumina sequencing. (A) Library construction after ribosomal RNA depletion using adaptors for the Illumina platform. (B) A graph showing the degree of colinearity between gene expression levels measured by qRT-PCR and by deep sequencing for our set of genes of interest (see also Table 2). Vertical axis: Normalized reads per kb per million reads (RPKM) calculated from reads mapped to transcript sequences, from 1 lane of Illumina RNA-seq data, estimated by the method of Mortazavi et al. (2008) (see Methods section). Horizontal axis: Transcripts per oocyte estimated by quantitative reverse transcriptase-polymerase chain reaction (qRT-PCR) data and amplicon lengths for each gene. The straight line corresponds to a linear relationship on the log/log scales of the chart (slope=1). (C) Expression level distribution of ∼11,800 genes detected by Illumina RNA-seq of oocyte RNA samples treated with a ribominus reagent. Superimposed are values for 30 genes found to be the likely Xenopus orthologs of “tissue-specific” human genes from the TiGER database. We analyzed the most enriched genes representing 10 different tissues. The horizontal scale shows the number of different genes: serial number of gene in distribution, with highest expression levels on the left. The vertical scale shows normalized RPKM from 1 lane of Illumina RNA-seq data.
To ensure that our Illumina procedure correctly estimates the abundance of different kinds of transcript, we compared our results with those obtained by qPCR. The quantity of RNA transcripts indicated by Illumina was estimated from the frequency with which different sequences from the same gene were obtained. We found a good agreement between the accurate quantitation by qPCR and the estimation of the abundance of the same transcripts by Illumina sequencing (Fig. 5B).
We also asked whether there is evidence that genes for which there is no obvious need in the oocyte (eg, adult tissue-specific genes) are expressed over a wide range of transcript abundance levels. Figure 5C shows that this is the case. For this analysis, we selected the top 10 genes by “enrichment factor” from 10 tissues from the TiGER database [36] and looked for their likely Xenopus orthologs in our Illumina sequence data. We found that many of these genes were either strongly or weakly expressed over a wide range of expression levels in the X. tropicalis oocyte. This supports the point that a number of the genes expressed in the X. tropicalis oocyte, some at quite high levels, are the ones that are regarded as tissue specific in the human genome.
We obtained values for the abundance of 11,000 different transcripts in X. tropicalis oocytes by deep sequencing (full list in Supplementary Table S1 and most abundant 500 in Supplementary Table S2). Summarizing the general conclusions from this list, we can say that 50% of all transcripts are synthesized by 10% of genes and that the 1% of the most strongly expressed genes account for about 15% of detected transcripts. We see that 7% of all genes (780) each contribute over 500 transcripts per oocyte. In Table 5, we exemplify a range of genes that are very strongly transcribed in oocytes as judged by the Illumina analysis. The main conclusion from this analysis is that it agrees with the more accurate quantitation by qPCR—this is that a wide range of genes in lampbrush chromosomes accumulate a large number of transcripts.
Table 5.
Examples of Highly Transcribed Genes in Xenopus tropicalis Oocytes
| Gene | Transcripts per oocyte (×10−6) |
|---|---|
| Cyclin B4 | 42 |
| HMG box 2 | 38 |
| Cyclin B1 | 32 |
| ODC1 | 29 |
| Histone B4 | 27 |
| GAPDH | 27 |
| Heat stock protein 70 kDa | 23 |
| DNA methyl transferase (DNMT1) | 19 |
| Nucleophosmin (nucleoplasmin family) | 18 |
| Cytoplasmic actin type 5 | 16 |
| Translationally controlled tumor protein (Tpt1) | 14 |
| Elongation factor EFIB | 13 |
| Small nucleolar RNA U3 | 10 |
| CTCF | 10 |
| Tubulin | 10 |
| Profilin | 9 |
| Ribosomal protein L19 | 6 |
| Heatshock protein 1 | 6 |
| Lim domain-binding protein | 5 |
| Total number of genes=360 | 5–20 |
A selection of abundant transcripts found in X. tropicalis oocytes by illumina sequencing is listed. A total of 360 genes contained from 5 to 20×106 transcripts per oocyte.
Discussion
The main conclusion from this work is that a wide range of genes make transcripts, mostly correctly spliced, in the oocyte and that many of these genes are ones that are normally transcribed only in cell-type–specific lineages that arise during development. Our results support the view that the lampbrush state of oocyte chromosomes leads them to be transcriptionally active. This is in accord with the view that the lampbrush chromosomes are in a strongly decondensed and derepressed state and are therefore transcribed by the highly active transcriptional components of the oocyte.
What is the significance of this widespread transcription in oocytes? We have noted that the transcripts required for the very abundant proteins of oocytes, such as the linker histone B4, are extremely numerous. The unexpected and cell-type–specific transcripts in oocytes are about 1,000 times less abundant. Therefore, the concentration of these transcripts in the huge oocyte is very low. If these transcripts were to be translated into proteins, the concentration of such proteins would be negligible in the oocyte. What is remarkable is the accumulation of these transcripts. In Table 4, we show that the abundance of unexpected transcripts is between 100 and 1,000 in each oocyte and this level of transcripts is produced by one tetraploid nucleus. When we consider the production of such transcripts by the oocyte nucleus, this means that the oocyte nucleus is between 100 and 1,000 times more active in accumulating these transcripts than is a typical cell (Table 4). We cannot deduce a rate of transcription from an accumulated content. The average half life of transcripts from nuclei transplanted to oocytes is about 12 h. Even if the half life of transcripts from lampbrush chromosomes should turn out to be 10 times longer (5 days), this would still require very active transcription from lampbrush chromosomes, as has been indeed observed [6,9]. This high accumulated content of transcripts may reflect the decondensed state of the amphibian oocyte chromosomes. We suggest that those genes whose transcripts are extraordinarily abundant (106 per oocyte) are either present in multiple copies or are transcribed by a special oocyte-specific mechanism. We asked at the outset of this work whether the unexpected transcription of several embryo-specific and cell-type–specific transcripts in somatic nuclei transplanted to oocytes is an artifact of nuclear transfer or whether this reflects an extent to which somatic nuclei are reprogrammed to conform to the transcriptional state of a normal oocyte. The results here favor the second interpretation. It is interesting that one of the few genes not activated in somatic nuclei transplanted to oocytes is adult globin [10]. If our interpretation of the high content of adult globin transcripts in oocytes as a result of transmission from the blood stream is correct, adult globin genes may be quiescent in the oocyte—this would explain why globin transcription is not induced to a significant extent in transplanted somatic nuclei.
Supplementary Material
Acknowledgments
This work was funded by the Wellcome Trust and the “Cell into Organs” Network of Excellence of the European Union. The authors thank David Simpson for technical support and Richard Halley-Stott for real-time PCR advice and for the supply of the mouse Oct4 RNA. The authors also thank Dr. Kim Brugger and Dr. Anthony Rogers from the EASIH lab for their interpretations of some Illumina results. The authors also thank Dr. J. Gall for comments.
Author Disclosure Statement
No competing financial interests exist.
References
- 1.Flemming W. Zell substanz, Kern, und Zelltheilung. F.C.W. Vogel; Leipzig: 1882. [Google Scholar]
- 2.Callan HG. The nature of lampbrush chromosomes. Int Rev Cytol. 1963;15:1–34. doi: 10.1016/s0074-7696(08)61114-6. [DOI] [PubMed] [Google Scholar]
- 3.Callan HG. Lampbrush chromosomes. Mol Biol Biochem Biophys. 1986;36:1–252. [PubMed] [Google Scholar]
- 4.Callan HG. Gall JG. Berg CA. The lampbrush chromosomes of Xenopus laevis: preparation, identification, and distribution of 5S DNA sequences. Chromosoma. 1987;95:236–250. doi: 10.1007/BF00294780. [DOI] [PubMed] [Google Scholar]
- 5.Gall JG. Murphy C. Assembly of lampbrush chromosomes from sperm chromatin. Mol Biol Cell. 1998;9:733–747. doi: 10.1091/mbc.9.4.733. [DOI] [PMC free article] [PubMed] [Google Scholar]
- 6.Gall JG. Wu Z. Examining the contents of isolated Xenopus germinal vesicles. Methods. 2010;51:45–51. doi: 10.1016/j.ymeth.2009.12.010. [DOI] [PMC free article] [PubMed] [Google Scholar]
- 7.Morgan GT. Lampbrush chromosomes and associated bodies: new insights into principles of nuclear structure and function. Chromosome Res. 2002;10:177–200. doi: 10.1023/a:1015227020652. [DOI] [PubMed] [Google Scholar]
- 8.Davidson EH. Crippa M. Kramer FR. Mirsky AE. Genomic function during the lampbrush chromosome stage of amphibian oogenesis. Proc Natl Acad Sci U S A. 1966;56:856–863. doi: 10.1073/pnas.56.3.856. [DOI] [PMC free article] [PubMed] [Google Scholar]
- 9.Davidson EH. Gene Activity in Early Development. 3rd. Academic Press, Elsevier; 1986. [Google Scholar]
- 10.Biddle A. Simeoni I. Gurdon JB. Xenopus oocytes reactivate muscle gene transcription in transplanted somatic nuclei independently of myogenic factors. Development. 2009;136:2695–2703. doi: 10.1242/dev.036327. [DOI] [PMC free article] [PubMed] [Google Scholar]
- 11.Perlman SM. Ford PJ. Rosbash MM. Prescence of tadpole and adult globin RNA sequences in oocytes of Xenopus laevis. Proc Natl Acad Sci U S A. 1977;74:3835–3839. doi: 10.1073/pnas.74.9.3835. [DOI] [PMC free article] [PubMed] [Google Scholar]
- 12.Vallee M. Aiba K. Piao Y. Palin MF. Ko MS. Sirard MA. Comparative analysis of oocyte transcript profiles reveals a high degree of conservation among species. Reproduction. 2008;135:439–448. doi: 10.1530/REP-07-0342. [DOI] [PubMed] [Google Scholar]
- 13.Astrand C. Belikov S. Wrange O. Histone acetylation characterizes chromatin presetting by NF1 and Oct1 and enhances glucocorticoid receptor binding to the MMTV promoter. Exp Cell Res. 2009;315:2604–2615. doi: 10.1016/j.yexcr.2009.05.012. [DOI] [PubMed] [Google Scholar]
- 14.Mortazavi A. Williams BA. McCue K. Schaeffer L. Wold B. Mapping and quantifying mammalian transcriptomes by RNA-Seq. Nat Methods. 2008;5:621–628. doi: 10.1038/nmeth.1226. [DOI] [PubMed] [Google Scholar]
- 15.Dumont JN. Oogenesis in Xenopus laevis (Daudin). I. Stages of oocyte development in laboratory maintained animals. J Morphol. 1972;136:153–179. doi: 10.1002/jmor.1051360203. [DOI] [PubMed] [Google Scholar]
- 16.Fisher ME. Peck W. Branney PA. Pownall ME. Cloning and characterisation of Myf5 and MyoD orthologues in Xenopus tropicalis. Biol Cell. 2003;95:555–561. doi: 10.1016/j.biolcel.2003.09.002. [DOI] [PubMed] [Google Scholar]
- 17.Jennings CG. Expression of the myogenic gene MRF4 during Xenopus development. Dev Biol. 1992;151:319–332. [PubMed] [Google Scholar]
- 18.Braun T. Buschhausen-Denker G. Bober E. Tannich E. Arnold HH. A novel human muscle factor related to but distinct from MyoD1 induces myogenic conversion in 10T1/2 fibroblasts. EMBO J. 1989;8:701–709. doi: 10.1002/j.1460-2075.1989.tb03429.x. [DOI] [PMC free article] [PubMed] [Google Scholar]
- 19.Smith JC. Price BM. Green JB. Weigel D. Herrmann BG. Expression of a Xenopus homolog of Brachyury (T) is an immediate-early response to mesoderm induction. Cell. 1991;67:79–87. doi: 10.1016/0092-8674(91)90573-h. [DOI] [PubMed] [Google Scholar]
- 20.Ryan K. Garrett N. Mitchell A. Gurdon JB. Eomesodermin, a key early gene in Xenopus mesoderm differentiation. Cell. 1996;87:989–1000. doi: 10.1016/s0092-8674(00)81794-8. [DOI] [PubMed] [Google Scholar]
- 21.Williams JG. Kay RM. Patient RK. The nucleotide sequence of the major beta-globin mRNA from Xenopus laevis. Nucleic Acids Res. 1980;8:4247–4258. doi: 10.1093/nar/8.18.4247. [DOI] [PMC free article] [PubMed] [Google Scholar]
- 22.Lee JE. Hollenberg SM. Snider L. Turner DL. Lipnick N. Weintraub H. Conversion of Xenopus ectoderm into neurons by NeuroD, a basic helix-loop-helix protein. Science. 1995;268:836–844. doi: 10.1126/science.7754368. [DOI] [PubMed] [Google Scholar]
- 23.Mariani FV. Harland RM. XBF-2 is a transcriptional repressor that converts ectoderm into neural tissue. Development. 1998;125:5019–5031. doi: 10.1242/dev.125.24.5019. [DOI] [PubMed] [Google Scholar]
- 24.Koyano S. Ito M. Takamatsu N. Takiguchi S. Shiba T. The Xenopus Sox3 gene expressed in oocytes of early stages. Gene. 1997;188:101–107. doi: 10.1016/s0378-1119(96)00790-1. [DOI] [PubMed] [Google Scholar]
- 25.Patterton D. Shi YB. Thyroid hormone-dependent differential regulation of multiple arginase genes during amphibian metamorphosis. J Biol Chem. 1994;269:25328–25334. [PubMed] [Google Scholar]
- 26.Hinkley CS. Martin JF. Leibham D. Perry M. Sequential expression of multiple POU proteins during amphibian early development. Mol Cell Biol. 1992;12:638–649. doi: 10.1128/mcb.12.2.638. [DOI] [PMC free article] [PubMed] [Google Scholar]
- 27.Whitfield T. Heasman J. Wylie C. XLPOU-60, a Xenopus POU-domain mRNA, is oocyte-specific from very early stages of oogenesis, and localised to presumptive mesoderm and ectoderm in the blastula. Dev Biol. 1993;155:361–370. doi: 10.1006/dbio.1993.1035. [DOI] [PubMed] [Google Scholar]
- 28.Cho H. Wolffe AP. Xenopus laevis B4, an intron-containing oocyte-specific linker histone-encoding gene. Gene. 1994;143:233–238. doi: 10.1016/0378-1119(94)90102-3. [DOI] [PubMed] [Google Scholar]
- 29.Kieserman EK. Glotzer M. Wallingford JB. Developmental regulation of central spindle assembly and cytokinesis during vertebrate embryogenesis. Curr Biol. 2008;18:116–123. doi: 10.1016/j.cub.2007.12.028. [DOI] [PubMed] [Google Scholar]
- 30.Lund E. Dahlberg JE. In vitro synthesis of vertebrate U1 snRNA. EMBO J. 1989;8:287–292. doi: 10.1002/j.1460-2075.1989.tb03375.x. [DOI] [PMC free article] [PubMed] [Google Scholar]
- 31.Kohler A. Hurt E. Exporting RNA from the nucleus to the cytoplasm. Nat Rev Mol Cell Biol. 2007;8:761–773. doi: 10.1038/nrm2255. [DOI] [PubMed] [Google Scholar]
- 32.Efroni S. Duttagupta R. Cheng J. Dehghani H. Hoeppner DJ. Dash C. Bazett-Jones DP. Le Grice S. McKay RD, et al. Global transcription in pluripotent embryonic stem cells. Cell Stem Cell. 2008;2:437–447. doi: 10.1016/j.stem.2008.03.021. [DOI] [PMC free article] [PubMed] [Google Scholar]
- 33.Yaffe D. Saxel O. Serial passaging and differentiation of myogenic cells isolated from dystrophic mouse muscle. Nature. 1977;270:725–727. doi: 10.1038/270725a0. [DOI] [PubMed] [Google Scholar]
- 34.Flickinger RA. Rounds DE. The maternal synthesis of egg yolk proteins as demonstrated by isotopic and serological means. Biochim Biophys Acta. 1956;22:38–42. doi: 10.1016/0006-3002(56)90220-7. [DOI] [PubMed] [Google Scholar]
- 35.Wallace RA. Nickol JM. Ho T. Jared DW. Studies on amphibian yolk. X. The relative roles of autosynthetic and heterosynthetic processes during yolk protein assembly by isolated oocytes. Dev Biol. 1972;29:255–272. doi: 10.1016/0012-1606(72)90066-8. [DOI] [PubMed] [Google Scholar]
- 36.Liu X. Yu X. Zack DJ. Zhu H. Qian J. TiGER: a database for tissue-specific gene expression and regulation. BMC Bioinform. 2008;9:271–276. doi: 10.1186/1471-2105-9-271. [DOI] [PMC free article] [PubMed] [Google Scholar]
Associated Data
This section collects any data citations, data availability statements, or supplementary materials included in this article.