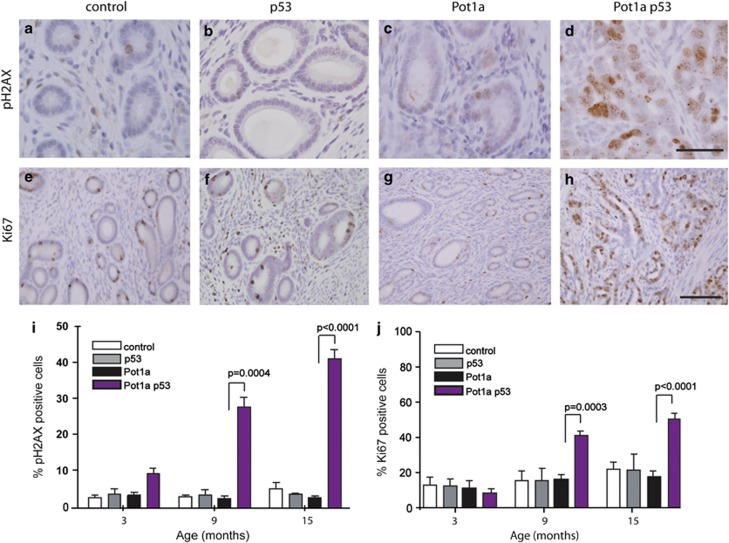
Figure 3.
Double-strand DNA breaks in Pot1a p53 tumors. (a–d), γ-H2AX immunohistochemistry, 15-month-old animals. (a) Pot1aL/L control. (b) Sprr2f-Cre; p53L/L. (c) Sprr2f-Cre; Pot1aL/L. (d) Sprr2f-Cre; Pot1aL/L; p53L/L. (e–h) Ki67 immunohistochemistry, 15-month-old animals. (e) Pot1aL/L controls. (f) Sprr2f-Cre; p53L/L. (g) Sprr2f-Cre; Pot1aL/L. (h) Sprr2f-Cre; Pot1aL/L; p53L/L. (i, j) Percentage of immunopositive nuclei plotted for each genotype at 3, 9 and 15 months (n=5 for each time point). (i) γ-H2AX. (j) Ki67. Size bars=50 μℳ for (a–d) and 100 μℳ for (e–h).

