

Abstract
Myeloperoxidase-derived HOCl reacts with the vinyl ether bond of plasmalogens yielding α-chlorofatty aldehydes. These chlorinated aldehydes can be purified using thin-layer chromatography, which is essential for subsequent analysis of extracts from some tissues such as myocardium. The α-chlorofatty aldehyde 2-chlorohexadecanal (2-ClHDA) is quantified after conversion to its pentafluorobenzyl oxime derivative using gas chromatography–mass spectrometry and negative-ion chemical ionization detection. 2-ClHDA accumulates in activated human neutrophils and monocytes, as well as in atherosclerotic lesions and infarcted myocardium. Metabolites of 2-ClHDA have also been identified, including the oxidation product, 2-chlorohexadecanoic acid (2-ClHA), and the reduction product, 2-chlorohexadecanol. 2-ClHA can be quantified using LC–MS with selected reaction monitoring (SRM) detection. 2-ClHA can be ω-oxidized by hepatocytes and subsequently β-oxidized from the ω-end, leading to the production of the dicarboxylic acid, 2-chloroadipic acid. This dicarboxylic acid is excreted in the urine and can also be quantified using LC–MS methods with SRM detection. Quantitative analyses of these novel chlorinated lipids are essential to identify the role of these lipids in leukocyte-mediated injury and disease.
Keywords: Myeloperoxidase, Hypochlorous acid, Fatty aldehydes, Fatty acids, Free radicals
Introduction
Inflammatory reactions mediated by myeloperoxidase (MPO)-enriched phagocytes including neutrophils, monocytes, and some macrophages contribute to the pathogenesis of atherosclerosis, ischemic/reperfusion injury to numerous tissues, and other disorders. MPO released from activated phagocytes leads to the formation of the reactive chlorinating species HOCl, via the peroxidation of chloride ions [1,2]. The chemical reactivity of HOCl gives it potent antimicrobial and cytotoxic properties, which are important for the immune response, but also has the potential to mediate pathogenesis in many diseases and disorders [3,4]. HOCl is a two-electron oxidant of proteins and lipids. Lipids can potentially be chlorinated by HOCl at amine, alkene, and vinyl ether functional groups.
Plasmalogens are preferentially targeted by HOCl because of the relatively high rate constant for reactions with the vinyl ether bond compared to other reactive targets including alkenes [5]. Plasmalogens are abundant phospholipid components in many cell types, including endothelial cells, macrophages, neutrophils, smooth muscle cells, cardiac myocytes, neurons, and glia [6-8]. Although plasmalogens have been described as having antioxidant capabilities [9,10], their reactivity with HOCl leads to the production of reaction products that have been associated with cardiovascular disease. Plasmalogens react with HOCl leading to the production of α-chlorofatty aldehydes (α-ClFALD) and lysophospholipids (Fig. 1). The α-ClFALD can be further metabolized to α-chlorofatty acid (α-ClFA) and α-chlorofatty alcohol (α-ClFOH). Oxidation of the aldehyde to the α-ClFA metabolite is catalyzed by a fatty aldehyde dehydrogenase [11]. α-ClFA can be further catabolized by ω-oxidation, which is initiated by an ω-hydroxylation step, followed by conversion of the intermediate to an α-chlorodicarboxylic acid. Sequential β-oxidation from the ω-end of the dicarboxylic acids (through multiple dicarboxylic acid intermediates) leads to the eventual production of 2-chloroadipic acid (2-ClAdA). The in vivo metabolism of α-ClFA to 2-ClAdA is efficient, with the final product 2-ClAdA being excreted in the urine [12].
Fig. 1.
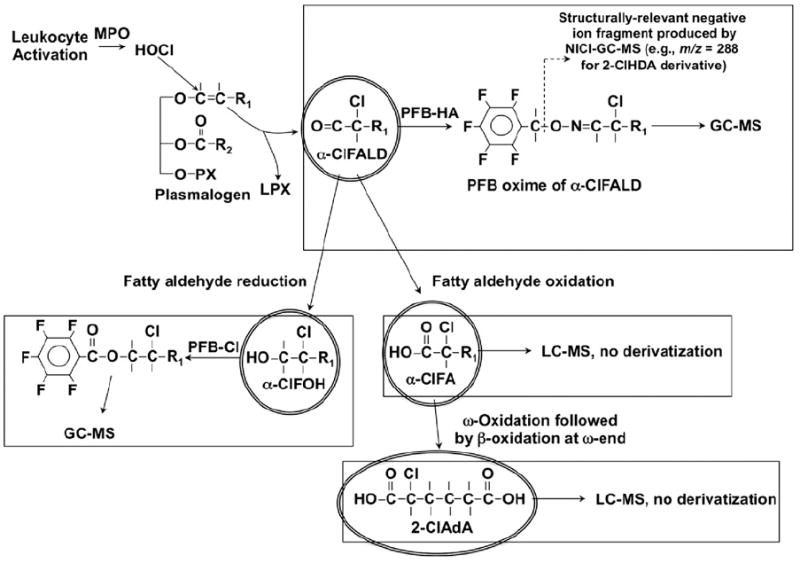
Structures of the members of the chlorinated lipidome derived from HOCl oxidation of plasmalogens and abbreviated strategies for their quantification. PX, LPX, PFB-HA, and PFB-Cl are the abbreviations for phospho-head group (e.g., phosphorylcholine), lysophospholipids, pentafluorobenzyl hydroxylamine, and pentafluorobenzoyl chloride.
Chlorinated lipids have been identified under several pathophysiological and physiological conditions involving MPO-laden phagocytes. Activated neutrophils and monocytes transiently accumulate α-ClFALD [13,14]. Human aortic atherosclerotic plaques show a nearly 1400-fold increase in levels of the α-ClFALD, 2-chlorohexadecanal (2-ClHDA), compared to normal aortic tissue [15]. Additionally, 2-ClHDA acts as a chemoattractant to neutrophils, suggesting that it may play a role in the recruitment of neutrophils to sites of inflammation [14]. Both unsaturated molecular species of lysophosphatidylcholine (the accompanying product from the degradation of plasmalogens by HOCl) and lysophosphatidylcholine-chlorohydrin, a product of HOCl attack of alkenes present in the sn-2 aliphatic chain of unsaturated lysophosphatidylcholine molecular species, induce P-selectin surface expression on human coronary artery endothelial cells [16]. Endothelial cells show inhibition of endothelial nitric oxide synthase (eNOS) expression caused by 2-ClHDA, as well as reduced eNOS expression localized to the plasma membrane [17]. 2-ClHDA has been shown to increase in infarcted myocardial tissue and can depress contractile function [18]. Furthermore, both 2-ClHDA and 2-chlorohexadecanoic acid (2-ClHA) induce COX-2 expression in human coronary artery endothelial cells [19]. Thus, it is clear that chlorinated lipids accumulate in an array of cardiovascular pathophysiological conditions, and the accurate measurement of these novel lipids is essential and may lead to further insights into the role of these compounds either as putative biomarkers or mediators of proinflammatory mechanisms.
Several mass spectrometry-based methods have been developed to detect and accurately quantify these chlorinated lipids (see Fig. 2 for flowchart of these quantification strategies and Fig. 1 for the structures that are quantified). The choices of (1) whether to derivatize the chlorinated lipids, (2) the type of chromatography, and (3) the mass spectrometry (MS) scan mode are dependent on the functional groups of the analytes that dictate their chromatographic characteristics and ionization by mass spectrometry. Accordingly, in this review of the methodological strategies employed to measure chlorinated lipids, the quantification of (1) α-chlorofatty aldehydes as pentafluorobenzyl (PFB) oximes using gas chromatography (GC)–MS with negative ion chemical ionization (NICI), (2) α-ClFA by reversed-phase liquid chromatography (LC) with electrospray ionization (ESI)–MS and selected reaction monitoring (SRM) for detection, and (3) 2-ClAdA by reversed-phase LC with ESI–MS and SRM for detection will be detailed. For this review, we focus on the accurate measurement of three chlorinated lipids: the α-ClFALD 2-ClHDA, the α-ClFA 2-ClHA, and the α-Cl-dicarboxylic acid 2-ClAdA. These are the predominant chlorinated lipids that have been detected in vivo. Methods to quantify the less predominant chlorinated lipids, α-ClFOH (see Fig. 1) and lysophosphatidylcholine chlorohydrins, are available [11,16]. It should be appreciated that other molecular species of α-ClFALD and α-ClFA, including 2-chloro-octadecanal and 2-chloro-octadecanoic acid, can also be quantified by the methods described herein.
Fig. 2.
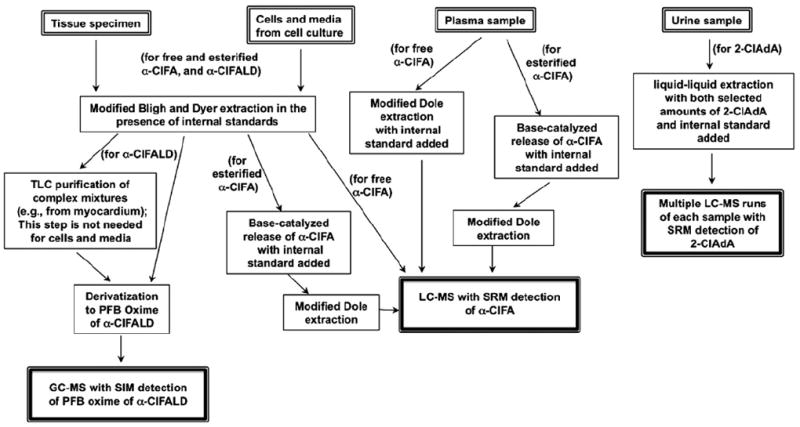
Flowchart of strategies to quantify members of the chlorinated lipidome.
Principles
Analysis of α-chlorofatty aldehydes
α-ClFALD are the products of chlorination of the sn-1 aliphatic chain of plasmalogens. Chlorinated fatty aldehydes form poor ions and are unstable under the conditions of ESI. Thus, derivatives that add an electron-withdrawing group, such as the PFB oxime derivative of the fatty aldehyde, greatly improve the sensitivity for α-ClFALD detection and quantification [20]. However, it should be recognized that the presence of masked aldehydes in plasmalogens, and other species that may be modified under the acidic PFB derivatization process, can be problematic. Accordingly, isolation of α-ClFALD using thin-layer chromatography (TLC) before derivatization can remove competing lipids (that might react with PFB hydroxylamine), while enriching α-ClFALD that can then be facilely converted to its PFB derivative. The PFB oxime of α-ClFALD can then be quantified using GC–MS by comparisons to stable isotope-labeled internal standards using NICI, which exploits the loss of HF from the PFB derivative to form excellent negative ions.
Analysis of α-chlorofatty acid
α-ClFALD can be further oxidized to an α-ClFA. The carboxylic acid functional group of α-ClFA forms excellent negatively charged ions that can be readily detected using ESI–MS. Reversed-phase high-performance liquid chromatography (HPLC) using an ammonium acetate buffer to neutralize the charge of the acid and enhance its binding efficiency to the column can be used to chromatographically resolve fatty acid molecular species. With MS/MS instrumentation, quantification by SRM of the loss of HCl from α-ClFA enables outstanding sensitivity for detection, even in highly complex mixtures [21].
Analysis of 2-chloroadipic acid
ω-Oxidation of the α-ClFA and subsequent sequential β-oxidation from the ω-end with the production of multiple dicarboxylic acid intermediates lead to the production of 2-ClAdA. This metabolite can also be analyzed by LC–MS/MS using principles similar to those that were described above for carboxylic acids (e.g., α-ClFA). 2-ClAdA is separated on a double-bonded column, again using an ammonium acetate buffer to enhance binding efficiency to the column. As with the α-ClFA, MS/MS analysis is performed using SRM of the loss of HCl to obtain excellent sensitivity.
Materials
Lipid extracts were prepared in borosilicate tubes from tissues and stored under nitrogen in borosilicate glass tubes with screwtops and polytetrafluoroethylene septa inserts. Burdick and Jackson methanol and chloroform were of HPLC grade and were purchased from Honeywell (Morristown, NJ, USA). Formic acid, pentafluorobenzyl hydroxylamine (Product No. P4190), and ammonium acetate were purchased from Sigma Chemical (St. Louis, MO, USA). Petroleum ether, ethyl ether, acetic acid, cyclohexane, and ethyl acetate were purchased from Fisher Scientific (Pittsburgh, PA, USA). All water used in these studies was purified through a Millipore Milli-Q Advantage A10 system with polishing with a Q-POD system (EMD Millipore, Billerica, MA, USA). [d4-3,3,4,4]-Adipic acid was from C/D/N Isotopes (Pointe-Claire, QC, Canada, Product No. D3269)
Instrumentation
GC–MS was performed using a DB-1 column (12.5 m, 0.2-mm inner diameter, 0.33-μm methyl silicone film coating; Agilent, Santa Clara, CA, USA, Product No. 128-1012) with an Agilent 6890 gas chromatograph and Agilent 5973 mass spectrometer with chemical ionization source (Agilent). GC–MS data analysis was performed using enhanced Chemstation software (Agilent). LC–MS was performed using the indicated columns (vide infra) with a Thermo Fisher Surveyor MS LC system and Thermo Fisher TSQ Quantum Ultra mass spectrometer (Thermo Fisher, Waltham, MA, USA). LC–MS data analysis was performed using XCalibur software (Thermo Fisher).
Protocols
Standards
For 2-ClHDA analysis, the internal standard used is 2-chloro-[d4-7,7,8,8]-hexadecanal (20 pmol per 50 mg heart tissue or 500,000 neutrophils extracted). See Thukkani et al. [14] for synthesis. For 2-ClHA analysis, the internal standard used is 2-chloro-[d4-7,7,8,8]-hexadecanoic acid. See Wildsmith et al. [22] for synthesis. For 2-ClAdA analysis, the internal standard used is [d4-3,3,4,4]-adipic acid.
Tissue lipid extraction for 2-ClHDA and 2-ClHA analyses
Homogenize or pulverize frozen tissue in a manner proper for the tissue of interest. Homogenize soft tissue (liver, nervous tissue, etc.) in ice-cold saline (0.154 M NaCl, 100 μl per 10 mg tissue wet wt) using a hand-held battery-powered pestle with a microcentrifuge tube. Tougher tissue can be frozen and pulverized at the temperature of liquid N2 using a stainless steel mortar and pestle. Extract the lipids from 10–50 mg of homogenized/pulverized tissue using a modification of the Bligh and Dyer method [23]. Quickly place the homogenized/pulverized tissue into a chilled 16 × 100-mm glass culture tube and add 3.5 ml of a methanol/saline (2.5/1, v/v) solution followed by vortex mixing. It is important to add methanol while the tissue is frozen to minimize metabolism. It is critical to avoid exposure to plastic with samples in organic solvent during any step. Add 1.25 ml of HPLC-grade chloroform and vortex to mix. Add internal standard in 100 μl of methanol and vortex. Incubate tissue extract at room temperature for 5 min with occasional vortexing. Add 1.25 ml of chloroform and 1 ml of saline to achieve a 1/1/0.8 ratio of methanol/chloroform/saline and vortex to mix. Centrifuge the tube at 500g for 2 min. Remove the lower chloroform layer, being careful not to disturb the protein disc, and add to a clean glass 16 × 125-mm screwtop tube. To the remaining upper phase, add 2.5 ml of chloroform and then vortex to mix well. Centrifuge the tube at 500g for 2 min. Remove the lower chloroform layer again and combine with the previous. Add 4 ml of saline to the combined chloroform extract and vortex at least three times, waiting 1 min between each vortexing. The lower chloroform layer should become clearer. Centrifuge at 500g for 2 min. Remove the lower chloroform layer into a clean glass screwtop test tube. Evaporate the chloroform under a stream of nitrogen. Resuspend the dried extract in 0.5 ml of chloroform, cap under nitrogen, and store at −20 °C until further analysis.
Lipid extraction from cultured cells for 2-ClHDA and 2-ClHA analyses
For a 60-mm culture dish, scrape cells into 1 ml of ice-cold saline (0.154 M NaCl). Transfer this to a 2-ml plastic tube, and then scrape the culture dish again with 1 ml of ice-cold saline. Combine this with the solution from the first scrape. Keep cells on ice, or freeze at −80 °C until ready to perform lipid extraction. For analysis, 1.5 ml (75% of total) of cell culture homogenate or cell culture medium is extracted by a modification of the method of Bligh and Dyer [23] with the addition of the appropriate internal standard. To a 16 × 100-mm culture tube, add 2.5 ml of HPLC-grade methanol, 1.25 ml of HPLC-grade chloroform, and 1.5 ml of cell homogenate or culture medium. Be careful not to allow any plastic to touch the organic solvent during any step. Add appropriate standards in 100 μl of methanol. Vortex and then incubate the cell culture extract at room temperature for 5 min with occasional vortexing. Add 0.5 ml of saline and 1.25 ml of chloroform and vortex to mix. Centrifuge the tube at 500g for 2 min. Remove the lower chloroform layer, being careful not to disturb the protein disc, and transfer to a clean glass 16 × 125-mm screwtop tube. Reextract the remaining upper phase by adding 2.5 ml of chloroform and vortexing. Centrifuge the tube at 500g for 2 min, remove the lower chloroform layer again, and combine this fraction with the previous. Add 4 ml of saline to the combined chloroform extract and vortex three times, waiting 2 min between each. The lower chloroform layer should become clearer. Centrifuge at 500g for 2 min. Remove the lower chloroform layer into a clean glass screwtop test tube. Evaporate the chloroform under a stream of nitrogen. For 2-ClHDA analysis, resuspend the dried extract in 300 μl of ethanol for PFB derivatization. For free 2-ClHA analysis, resuspend the dried extract in 200 μl of methanol/water (85/15, v/v) containing 0.1% formic acid. Vortex vigorously and transfer to an autosampler tube with an insert for analysis by LC–MS.
Hydrolysis of esterified 2-ClHA from tissue and cell culture lipid extracts
After the modified Bligh and Dyer extraction, dry the lipid extract under nitrogen and then resuspend in 180 μl of water. To initiate hydrolysis, add 200 μl of 1 M NaOH, cap the tube under nitrogen, and incubate the sample for 2 h at 60 °C. After incubation, cool the reaction to room temperature and add 120 μl of ice-cold 2 M HCl. Allow the reaction to sit for 10 min at room temperature, and then perform a modified Dole extraction [24] (see Plasma lipid extraction for free 2-ClHA, below).
Plasma lipid extraction for free 2-ClHA
Extract plasma using a modified Dole extraction [24] in the presence of a standard. Add 25 μl of plasma to a 16 × 100-mm glass culture tube containing the dried internal standard. Add 475 μl of saline and vortex. Add 2.5 ml of Dole reagent (made fresh; isopropanol/heptane/1 M H2SO4, 40/10/1, v/v/v), 1.5 ml of heptane, and 1 ml of water, in order. Vortex, then centrifuge at 500g for 2 min. Collect the upper phase into a clean 16 × 100-mm screwtop tube. Reextract the lower phase with 2 ml of heptane, vortex, and centrifuge at 500g for 2 min. Collect the upper phase, and combine it in a glass tube with the previously collected upper phase. Dry the heptane extracts under N2 and resuspend in 150 μl of methanol/water (85/15, v/v) containing 0.1% formic acid. Vortex vigorously and transfer the sample to an autosampler vial with an insert.
Plasma lipid extraction for esterified 2-ClHA
Add 25 μl of plasma to a test tube containing dried internal standard. Add 155 μl of water and vortex. Add 200 μl of NaOH (1 M), vortex, and cap under nitrogen. Incubate the sample in a water bath at 60 °C for 2 h. Remove from the water bath and allow the sample to cool to room temperature. Add 120 μl of cold HCl (2 M), vortex, and incubate the solution at room temperature for at least 10 min. Add 2.5 ml of Dole reagent (made fresh; isopropanol/heptane/1 M H2SO4, 40/10/1, v/v/v), then add 1.5 ml of heptane and 1 ml of water. Vortex the solution and then centrifuge at 500g for 2 min. Collect the upper phase into a clean 16 × 100-mm screwtop tube. Reextract the lower phase with 2 ml of heptane, vortex, and centrifuge at 500g for 2 min. Collect the upper phase, and combine it in a glass tube with the previously collected upper phase. Dry the heptane extracts under N2 and resuspend in 150 μl of methanol/water (85/15, v/v) containing 0.1% formic acid. Vortex vigorously, and transfer the sample to an autosampler vial with an insert.
TLC purification of 2-ClHDA and other α-ClFALD from tissue extracts
2-ClHDA from crude lipid extract suspended in chloroform is purified by TLC on a silica gel 60-Å plate using a mobile phase comprised of petroleum ether/ethyl ether/acetic acid (90/10/1, v/v/v). Scrape and extract the silica region corresponding to 2-ClHDA (relative migration 0.46). To the scraped silica, add 4 ml of methanol/chloroform (1/1, v/v). Vortex and then centrifuge for 5 min at 500g. Transfer the supernatant to an 18 × 150-mm tube. Reextract the silica with 0.8 ml of saline and 3 ml of methanol/chloroform (2/1, v/v). Vortex and then centrifuge for 5 min at 500g. Combine the supernatant with the previous in the 18 × 150-mm tube. Add 1 ml of chloroform and 2.4 ml of saline to the combined supernatants to bring the solution to a 1/1/0.8 ratio of methanol/chloroform/saline. Vortex and then centrifuge for 2 min at 500g. Remove the lower chloroform layer to a clean 16 × 100-mm tube. Reextract the upper phase with 4 ml of chloroform. Vortex and then centrifuge for 2 min at 500g. Remove the lower chloroform layer and combine with the previous fraction. Evaporate the chloroform under N2, and resuspend the purified 2-ClHDA in 300 μl of ethanol before PFB derivatization. Other long-chain α-ClFALD, including 2-chloro-octadecanal, copurify with 2-ClHDA using this TLC procedure.
PFB derivatization of 2-ClHDA and other α-ClFALD
Initiate derivatization of 2-ClHDA to its PFB oxime by resuspending the extraction products in a 16 × 100-mm glass culture tube in 300 μl of ethanol and add 300 μl of 6 mg/ml pentafluorobenzyl hydroxylamine in water. Vortex the water/ethanol mixture for 5 min at room temperature and then incubate for an additional 25 min at room temperature. Terminate the reaction by adding 1.2 ml of Milli-Q water followed by 2 ml of cyclohexane/ethyl ether (4/1, v/v) and subsequent vortex mixing. Then centrifuge the samples at 400g for 2 min, and subsequently collect the upper phase into a clean 16 × 100-mm glass culture tube. To the remaining lower phase, add 2 ml of cyclohexane/ethyl ether (4/1, v/v) followed by vortex mixing. After centrifugation at 400g for 2 min collect the upper phase and combine it with the previously collected upper phase. Then dry these pooled organic extracts under a nitrogen stream. To the dried samples, add 150 μl of petroleum ether, vortex the dried sample, and then transfer it with a Pasteur pipette to an autosampler vial containing an insert. Add another 150 μl of petroleum ether to the culture tube, vortex the remaining residue, and transfer and pool it with the sample already transferred to the autosampler vial insert. Dry the pooled petroleum ether containing derivatized product under nitrogen and then dissolve the sample in 50 μl of petroleum ether and cap it until injection onto the GC column.
Analysis of 2-ClHDA PFB oxime derivative
PFB oximes of α-ClFALD including 2-ClHDA are analyzed by GC–MS on a DB-1 column utilizing an Agilent 6890 gas chromatograph. Keep the injector and the transfer lines at 250 and 280 °C, respectively. Keep the GC oven at 150 °C for 3.5 min and increase the temperature at a rate of 25 °C/min to 310 °C. Hold the oven temperature at 310 °C for an additional 5 min. All spectra are acquired on an Agilent 5973 mass spectrometer that is operated in the NICI mode with methane as the reagent gas and helium as the carrier gas. Set the source temperature at 150 °C. The electron energy should be 170 eV and the emission current 49 mA. Use selected ion monitoring (SIM) m/z 288 to detect the 2-ClHDA (PFB oxime) and SIM m/z 292 to detect the internal standard, 2-chloro-[7,7,8,8-d4] hexadecanal (PFB oxime) (see Fig. 1 for the structure of this derivative and its fragmentation leading to ions m/z 288 and 292). The product 2-chloro-octadecanal (PFB oxime) can be detected by SIM m/z 316.
Analysis of 2-ClHA
Resuspend the organic extracts in methanol/water (85/15, v/v) containing 0.1% formic acid and separate them on a reversed-phase HPLC column from Supelco (Discovery HS C18, 150 × 2.1 mm, 5 μm) utilizing a Thermo Fisher Surveyor MS-LC system with a Thermo Fisher Quantum Ultra electrospray ionization mass spectrometer as a detector. For LC, use the following mobile phases: (A) 85/15 methanol/water with 5 mM ammonium acetate and 0.25% acetic acid, (B) methanol with 5 mM ammonium acetate and 0.25% acetic acid, (C) methanol with 5 mM ammonium acetate. We use the gradient shown in Table 1.
Table 1.
Gradient used for liquid chromatography analysis of 2-ClHA.
| Time (min) | % A | % B | % C | Flow rate (μl/min) |
|---|---|---|---|---|
| 0 | 100 | 0 | 0 | 200 |
| 2 | 100 | 0 | 0 | 200 |
| 6 | 0 | 100 | 0 | 200 |
| 12 | 0 | 100 | 0 | 200 |
| 13 | 0 | 0 | 100 | 200 |
| 14 | 0 | 0 | 100 | 400 |
| 17 | 0 | 0 | 100 | 400 |
| 18 | 0 | 0 | 100 | 200 |
| 19 | 100 | 0 | 0 | 200 |
| 24 | 100 | 0 | 0 | 200 |
The 2-ClHA is detected using SRM transition, by observing the loss of H35Cl from the target chlorinated fatty acid. Use SRM in the negative-ion mode of m/z 289→253 for natural 2-ClHA to measure 2-ClHA. The internal standard, 2-Cl-[7,7,8,8-d4]–HA, is detected at m/z 293→257. For electrospray ionization MS, the ionization energy and temperature should be 3700 V and 310 °C, respectively. Use collision energy of 15 V and 1.5 mTorr argon as the collision gas. Under these conditions the Rt for 2-ClHA is ~8.5 min.
Extraction of urine for 2-ClAdA analysis—response curve generation
Add 10 ng of [3,3,4,4-d4]-adipic acid and varying amounts (0–10 ng) of synthetic 2-ClAdA to 50 μl of urine before extraction. To this spiked urine, add 0.75 ml of water, 0.2 ml of 6 N HCl. Then extract the sample twice in 6 ml of ethyl acetate/diethyl ether (1/1, v/v). Evaporate the organic extract under N2 and resuspend in 0.2 ml water containing 5 mM ammonium acetate and 0.25% acetic acid and then transfer it to an autosampler vial containing an insert. Also, for the analysis of urine it is critical to normalize to urinary creatinine to compensate for disparate urine product dilution due to variable hydration states in the tested subjects.
Analysis of 2-ClAdA
The urine dicarboxylic acid extract is analyzed by LC–MS/MS using a modification of the method described by Kakola and Alen [25]. LC–MS/MS is performed utilizing a double-bonded column (Supelcosil LC-18 DB 150 × 3 mm, 5 μm). The mobile phases are as follows: (A) water containing 5 mM ammonium acetate and 0.25% acetic acid, (B) methanol containing 5 mM ammonium acetate and 0.25% acetic acid. We use the gradient shown in Table 2 for elution.
Table 2.
Gradient used for elution of 2-ClAdA.
| Analysis from urine (flow rate 300 μl/min)
|
Analysis from cell culture (flow rate 200 μl/min)
|
|||||
|---|---|---|---|---|---|---|
| Time (min) | % A | % B | Time (min) | % A | % B | |
| 0 | 100 | 0 | 0 | 100 | 0 | |
| 4 | 90 | 10 | 7.5 | 90 | 10 | |
| 12 | 20 | 80 | 30 | 20 | 80 | |
| 18 | 0 | 100 | 34 | 0 | 100 | |
| 23 | 0 | 100 | 37 | 0 | 100 | |
| 24 | 100 | 0 | Reequilibration | 42 | 100 | 0 |
| 35 | 100 | 0 | ↓ | 55 | 100 | 0 |
Use SRM in the negative-ion mode of m/z 179→ 143 for natural 2-ClAdA. The internal standard, d4-AdA, is detected at m/z 149→105. The ionization voltage should be 3500 V and the ionization temperature 310 °C. For MS/MS, the collision energy should be 18 V, and use 1.5 mTorr argon as the collision gas.
Calculations and expected results
2-ClHDA
Quantification is achieved using SIM by comparing the ratio of the integrated area of the internal standard (SIM m/z 292) for the chromatography peak with that of the natural compound (SIM m/z 288). Integration of the peaks can be performed within the Agilent GC–MS Enhanced Chemstation software. Fig. 3 shows an example application of this method in studies examining the oxidation of human LDL plasmalogens with selected concentrations of HOCl. It should be noted that the PFB oxime has a chiral carbon leading to the production of two derivative peaks (anti and syn) as shown in Fig. 3. For the quantification of 2-ClHDA in this example the integrated areas under the anti and syn isomers are added for each SIM.
Fig. 3.
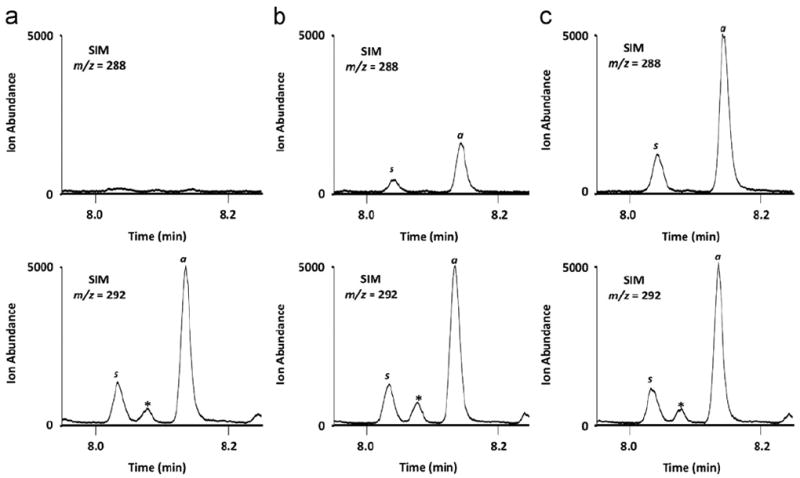
50 μg of human LDL was incubated with (A) 0, (B) 125, or (C) 500 μM HOCl in 50 μl of PBS for 30 min at 37 °C. Reaction products were extracted in the presence of 50 ng of 2-Cl-[d4]–HDA, and α-chlorofatty aldehydes were converted to their PFB oximes and subsequently subjected to GC–MS as described. a and s indicate anti and syn isomers of the PFB oximes, and the identity of peak * is unknown.
2-ClHA
2-ClHA is detected using SRM, by observing the loss of HCl from the target chlorinated fatty acid. As an example, 2-ClHA is observed by SRM transition of m/z 289→253 for 2-ClHA, whereas the stable isotope standard containing four deuteriums is observed by SRM transition of m/z 293→257. Quantification is achieved by comparing the ratio of the integrated area of the internal standard for the chromatography peak with that of the natural compound. The chromatographic peaks can be integrated using XCalibur software. Fig. 4 shows an example chromatogram of SRM detection used to quantify 2-ClHA in human serum.
Fig. 4.
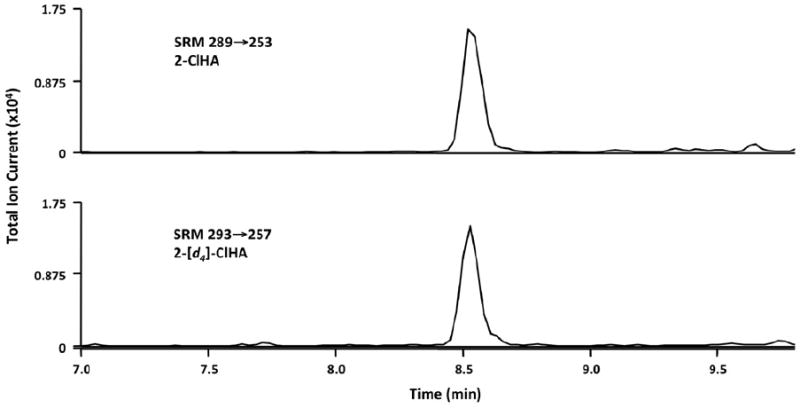
25 μl of human serum was subjected to base hydrolysis in the presence of 105 fmol of 2-[d4]-ClHA and subjected to LC–MS as described under Protocols. The concentration of 2-ClHA in this sample was 4.4 nM. This example shows results with a scan time of 0.5 s. The resolution of peaks can be further enhanced with shorter scan times and by limiting the number of SRMs in an analysis.
2-ClAdA
2-ClAdA is also detected using SRM, monitored in the negative-ion mode, to observe the loss of HCl from the chlorinated adipic acid. This transition is seen in SRM as m/z 179→143 for 2-ClAdA. The transition and the retention times can be obtained by comparing with synthetic 2-ClAdA. For biological samples, a series of spiked (selected amounts of 2-ClAdA with a fixed amount of the internal standard, [3,3,4,4-d4]-adipic acid: SRM m/z 149→105) samples is run and analyzed to assess the matrix effect of individual urine samples, which can alter the detection significantly from sample to sample. Urine samples should also be normalized to urinary creatinine levels to compensate for urine product dilution difference between animals. Quantification is achieved by comparing the ratio of the integrated area of the internal standard for the chromatography peak with that of the natural compound. The chromatographic peaks can be integrated using XCalibur software. Fig. 5 shows a dilution curve used to measure 2-ClAdA in rat and human urine.
Fig. 5.
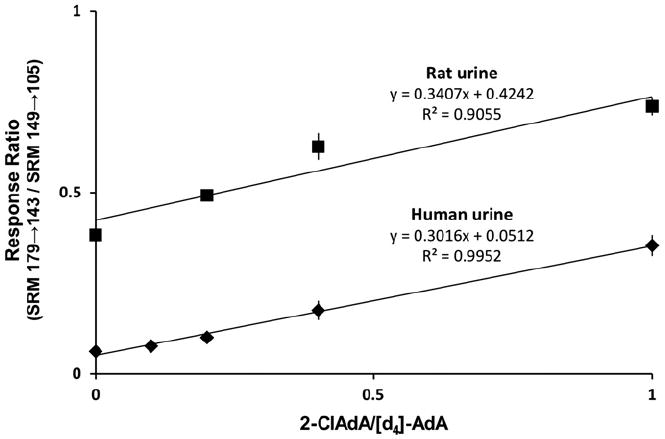
100 or 50 μl of human or rat urine spiked with indicated amounts of 2-ClAdA was extracted in triplicate in the presence of 10 ng of [d4]-AdA and subjected to LC–MS as described under Protocols. The response of 2-ClAdA to [d4]-AdA is plotted.
Caveats
α-Chlorofatty aldehydes are poorly ionized for ESI detection and are not stable under ESI–MS conditions. For this reason, α-chlorofatty aldehydes are derivatized to their PFB oximes before GC–MS analyses using NICI detection. In some instances, a complex lipid mixture necessitates first purifying α-chlorofatty aldehydes using TLC before derivatization. As an alternative method, α-chlorofatty aldehydes can be derivatized to their dimethyl acetals, but the resulting detection with this derivative is not as sensitive as measuring PFB derivatives with NICI. Furthermore, under the high temperatures used for acid methanolysis (90 °C for 90 min with 1 M HCl in anhydrous methanol) it is possible that chlorine can be displaced from the α-chlorofatty aldehydes. This issue is readily observed if these conditions are used to derivatize α-bromofatty aldehydes to their dimethyl acetal, as bromine is a better leaving group. This artifactual loss can be reduced by derivatizing conditions of 70 °C for 30 min [26]. Although the sensitivity of the dimethyl acetals and the potential for loss during derivatization are limiting, it should be appreciated that this derivative can be measured in the absence of a mass spectrometer because these derivatives can be readily detected by GC with a flame ionization detector.
Both α-ClFA and 2-ClAdA can also be derivatized to PFB-containing compounds (PFB esters) that can be detected by GC–MS with negative-ion detection. This is an excellent alternative method if an LC–MS triple-quadrupole instrument is not available. In our hands the sensitivity using the LC–MS method with SRM detection described herein is at least 1 order of magnitude better than derivatization to the PFB esters followed by GC–MS. Furthermore, the LC–MS method does not involve a derivatization step. The LC–MS method to detect α-ClFA is extremely sensitive, but plasma levels of α-ClFA are near the limit of detection using the methods described herein. Because of the minute amounts of α-ClFA in some samples it is necessary to run blank samples between each two biological analyses to ensure no sample–sample carryover. Additionally, multiple interior and exterior solvent washes of the injection needle are recommended. In our chromatography method, the inclusion of acetic acid facilitates fatty acid binding to the solid phase and we have added a column solvent wash with mobile phase in the absence of acetic acid at the end of the chromatographic protocol to further enhance elution of nonspecifically bound 2-ClHA.
The ionization of 2-ClAdA in urine during LC–MS is variable, probably because of the extreme differences in the matrix derived from urine. Accordingly, dilution curves are determined for each sample as shown in Fig. 5. Based on the calculated line parameters the concentration of 2-ClAdA can be determined. Furthermore, owing to the various hydration states and concentrations of urine in laboratory animals and humans the amount of 2-ClAdA is normalized to urine creatinine levels. Our previous studies have shown that deuterated 2-ClFA is metabolized to deuterated 2-ClAdA that appears in the urine [12], which supports the notion that 2-ClAdA is the catabolic clearance product of 2-ClFA. It remains to be shown whether other mechanisms can lead to 2-ClAdA in the urine, including alternative catabolic processes as well as acid-catalyzed chlorination in the acidic milieu of urine.
Our studies have shown that α-ClFALD accumulation coincides with the activation of MPO-containing leukocytes [13,14]. Importantly, negative controls in these studies have shown that α-ClFALD do not increase in MPO-deficient leukocytes [15] or in either 3-aminotriazole- or azide-inhibited leukocytes [13,14]. We have not observed artificial chlorination of plasmalogens under the conditions described herein; however, extreme care should be directed at handling bleach in the laboratory, particularly in sterilizing human-derived samples. α-ClFALD can be generated if chloroform extracts are exposed to bleach vapors from bleach treatment of specimens that is performed 10–20 ft away (unpublished data). Thus, human specimens treated with bleach for decontamination should be performed in hoods vented outside of the lab. We have not observed artificial chlorination of fatty acids using our methods, and it should be appreciated that the vinyl ether of the plasmalogens is the key target for chlorination leading to α-ClFALD release.
Acknowledgments
This work was supported by NIH Grants (to D.A.F.) HL074214, HL098907, and HL111906, as well as the Saint Louis University Presidential Research Fund (to D.A.F.).
References
- 1.Weiss SJ, Klein R, Slivka A, Wei M. Chlorination of taurine by human neutrophils: evidence for hypochlorous acid generation. J Clin Invest. 1982;70:598–607. doi: 10.1172/JCI110652. [DOI] [PMC free article] [PubMed] [Google Scholar]
- 2.Klebanoff SJ. Oxygen metabolism and the toxic properties of phagocytes. Ann Intern Med. 1980;93:480–489. doi: 10.7326/0003-4819-93-3-480. [DOI] [PubMed] [Google Scholar]
- 3.Spickett CM, Jerlich A, Panasenko OM, Arnhold J, Pitt AR, Stelmaszynska T, Schaur RJ. The reactions of hypochlorous acid, the reactive oxygen species produced by myeloperoxidase, with lipids. Acta Biochim Pol. 2000;47:889–899. [PubMed] [Google Scholar]
- 4.Ford DA. Lipid oxidation by hypochlorous acid: chlorinated lipids in atherosclerosis and myocardial ischemia. Clin Lipidol. 2010;5:835–852. doi: 10.2217/clp.10.68. [DOI] [PMC free article] [PubMed] [Google Scholar]
- 5.Skaff O, Pattison DI, Davies MJ. The vinyl ether linkages of plasmalogens are favored targets for myeloperoxidase-derived oxidants: a kinetic study. Biochemistry. 2008;47:8237–8245. doi: 10.1021/bi800786q. [DOI] [PubMed] [Google Scholar]
- 6.Farooqui AA, Horrocks LA. Plasmalogens: workhorse lipids of membranes in normal and injured neurons and glia. Neuroscientist. 2001;7:232–245. doi: 10.1177/107385840100700308. [DOI] [PubMed] [Google Scholar]
- 7.Gross RW. High plasmalogen and arachidonic acid content of canine myocardial sarcolemma: a fast atom bombardment mass spectroscopic and gas chromatography–mass spectroscopic characterization. Biochemistry. 1984;23:158–165. doi: 10.1021/bi00296a026. [DOI] [PubMed] [Google Scholar]
- 8.Murphy EJ, Joseph L, Stephens R, Horrocks LA. Phospholipid composition of cultured human endothelial cells. Lipids. 1992;27:150–153. doi: 10.1007/BF02535816. [DOI] [PubMed] [Google Scholar]
- 9.Vance JE. Lipoproteins secreted by cultured rat hepatocytes contain the antioxidant 1-alk-1-enyl-2-acylglycerophosphoethanolamine. Biochim Biophys Acta. 1990;1045:128–134. doi: 10.1016/0005-2760(90)90141-j. [DOI] [PubMed] [Google Scholar]
- 10.Zoeller RA, Grazia TJ, LaCamera P, Park J, Gaposchkin DP, Farber HW. Increasing plasmalogen levels protect human endothelial cells during hypoxia. Am J Physiol Heart Circ Physiol. 2002;283:H671–H679. doi: 10.1152/ajpheart.00524.2001. [DOI] [PubMed] [Google Scholar]
- 11.Anbukumar DS, Shornick LP, Albert CJ, Steward MM, Zoeller RA, Neumann WL, Ford DA. Chlorinated lipid species in activated human neutrophils: lipid metabolites of 2-chlorohexadecanal. J Lipid Res. 2010;51:1085–1092. doi: 10.1194/jlr.M003673. [DOI] [PMC free article] [PubMed] [Google Scholar]
- 12.Brahmbhatt VV, Albert CJ, Anbukumar DS, Cunningham BA, Neumann WL, Ford DA. ω-Oxidation of α-chlorinated fatty acids: Identification of α-chlorinated dicarboxylic acids. J Biol Chem. 2010;285:41255–41269. doi: 10.1074/jbc.M110.147157. [DOI] [PMC free article] [PubMed] [Google Scholar]
- 13.Thukkani AK, Albert CJ, Wildsmith KR, Messner MC, Martinson BD, Hsu FF, Ford DA. Myeloperoxidase-derived reactive chlorinating species from human monocytes target plasmalogens in low density lipoprotein. J Biol Chem. 2003;278:36365–36372. doi: 10.1074/jbc.M305449200. [DOI] [PubMed] [Google Scholar]
- 14.Thukkani AK, Hsu FF, Crowley JR, Wysolmerski RB, Albert CJ, Ford DA. Reactive chlorinating species produced during neutrophil activation target tissue plasmalogens: production of the chemoattractant, 2-chlorohex-adecanal. J Biol Chem. 2002;277:3842–3849. doi: 10.1074/jbc.M109489200. [DOI] [PubMed] [Google Scholar]
- 15.Thukkani AK, McHowat J, Hsu FF, Brennan ML, Hazen SL, Ford DA. Identification of alpha-chloro fatty aldehydes and unsaturated lysophosphatidylcholine molecular species in human atherosclerotic lesions. Circulation. 2003;108:3128–3133. doi: 10.1161/01.CIR.0000104564.01539.6A. [DOI] [PubMed] [Google Scholar]
- 16.Messner MC, Albert CJ, McHowat J, Ford DA. Identification of lysophosphatidylcholine-chlorohydrin in human atherosclerotic lesions. Lipids. 2008;43:243–249. doi: 10.1007/s11745-008-3151-z. [DOI] [PMC free article] [PubMed] [Google Scholar]
- 17.Marsche G, Heller R, Fauler G, Kovacevic A, Nuszkowski A, Graier W, Sattler E, Malle E. 2-Chlorohexadecanal derived from hypochlorite-modified high-density lipoprotein-associated plasmalogen is a natural inhibitor of endothelial nitric oxide biosynthesis. Arterioscler Thromb Vasc Biol. 2004;24:2302–2306. doi: 10.1161/01.ATV.0000148703.43429.25. [DOI] [PubMed] [Google Scholar]
- 18.Thukkani AK, Martinson BD, Albert CJ, Vogler GA, Ford DA. Neutrophil-mediated accumulation of 2-ClHDA during myocardial infarction: 2-ClHDA-mediated myocardial injury. Am J Physiol Heart Circ Physiol. 2005;288:H2955–H2964. doi: 10.1152/ajpheart.00834.2004. [DOI] [PubMed] [Google Scholar]
- 19.Messner MC, Albert CJ, Ford DA. 2-Chlorohexadecanal and 2-chlorohexadecanoic acid induce COX-2 expression in human coronary artery endothelial cells. Lipids. 2008;43:581–588. doi: 10.1007/s11745-008-3189-y. [DOI] [PMC free article] [PubMed] [Google Scholar]
- 20.Albert CJ, Anbukumar DS, Messner MC, Ford DA. Chromatographic methods for the analyses of 2-halofatty aldehydes and chlorohydrin molecular species of lysophosphatidylcholine. J Chromatogr B Anal Technol Biomed Life Sci. 2009;877:2768–2777. doi: 10.1016/j.jchromb.2008.11.031. [DOI] [PMC free article] [PubMed] [Google Scholar]
- 21.Lange V, Picotti P, Domon B, Aebersold R. Selected reaction monitoring for quantitative proteomics: a tutorial. Mol Syst Biol. 2008;4:222. doi: 10.1038/msb.2008.61. [DOI] [PMC free article] [PubMed] [Google Scholar]
- 22.Wildsmith KR, Albert CJ, Anbukumar DS, Ford DA. Metabolism of myeloperoxidase-derived 2-chlorohexadecanal. J Biol Chem. 2006;281:16849–16860. doi: 10.1074/jbc.M602505200. [DOI] [PubMed] [Google Scholar]
- 23.Bligh EG, Dyer WJ. A rapid method of total lipid extraction and purification. Can J Biochem Physiol. 1959;37:911–917. doi: 10.1139/o59-099. [DOI] [PubMed] [Google Scholar]
- 24.Dole VP. A relation between non-esterified fatty acids in plasma and the metabolism of glucose. J Clin Invest. 1956;35:150–154. doi: 10.1172/JCI103259. [DOI] [PMC free article] [PubMed] [Google Scholar]
- 25.Kakola J, Alen R. A fast method for determining low-molecular-mass aliphatic carboxylic acids by high-performance liquid chromatography–atmospheric pressure chemical ionization mass spectrometry. J Sep Sci. 2006;29:1996–2003. doi: 10.1002/jssc.200600106. [DOI] [PubMed] [Google Scholar]
- 26.Albert CJ, Crowley JR, Hsu FF, Thukkani AK, Ford DA. Reactive brominating species produced by myeloperoxidase target the vinyl ether bond of plasmalogens: disparate utilization of sodium halides in the production of alpha-halo fatty aldehydes. J Biol Chem. 2002;277:4694–4703. doi: 10.1074/jbc.M110875200. [DOI] [PubMed] [Google Scholar]