Abstract
Preischemic hyperglycemia exacerbates brain damage caused by cerebral ischemia. In the present experiment, we studied the effects of preischemic hyperglycemia on protein markers that are related to mitochondrial fission and fusion, mitochondrial biogenesis, and autophagy in mice subjected to 30-min transient focal ischemia. The fission proteins dynamin-related protein 1 (Drp1) and fission 1 (Fis1), fusion proteins optic atrophy 1 (Opa1) and mitofusin 2 (Mfn2), mitochondrial biogenesis regulators nuclear respiratory factor 1 (NRF1) and peroxisome proliferator-activated receptor gamma coactivator 1-alpha (PGC-1α), and autophagy marker beclin 1 and microtubule-associated protein light chain 3 (LC3) were analyzed in control, 30 min middle cerebral artery occlusion (MCAO) plus 6-, 24-, and 72 h of reperfusion in normo- and hyperglycemic conditions. Cerebral ischemia increased the levels of Drp1 and decreased Fis1 after reperfusion. Preischemic hyperglycemia further augmented the increase of Drp1 and induced elevation in Fis1. Ischemia inhibited the levels of Opa1 and Mfn2 and hyperglycemia further decreased the level of Opa1. Further, NRF1 increased after reperfusion in both normo- and hyperglycemic animals. However, such increase was caused by reperfusion rather than glucose level. Finally, ischemia increased beclin 1 level at 6 and 24 h of reperfusion and hyperglycemia further increased the beclin 1 level and caused LC3-II increase as well. Hyperglycemia enhances the ischemia-induced mitochondrial dynamic imbalance towards fission that may favor mitochondrial fragmentation and subsequent damage. Hyperglycemia elevated autophagy markers may represent an adapting reaction to the severe damage incurred in hyperglycemic animals or a third pathway of cell death.
Keywords: Autophagy, Cerebral ischemia, Hyperglycemia, Mitochondrial dynamics
Introduction
It is well established that preischemic hyperglycemia enhances ischemic brain damage in human as well as in animal models of both global and focal in nature [1–7]. Both experimental and clinical studies have shown that besides higher susceptibility to stroke occurrence, severity of brain damage and likelihood of death from stroke are increased in persons with hyperglycemic conditions regardless of diabetes as compared to euglycemic counterpart [8–13]. The molecular mechanisms underlying this important, clinically relevant phenomenon are not fully understood. However, studies have shown that hyperglycemia increases free radical production, activates intrinsic cell death pathway, and causes mitochondrial swelling in early reperfusion stage [14–19].
Mitochondria are highly dynamic organelles that constantly undergo fission and fusion. Mitofusins 1, 2 (Mfn1, Mfn2) and optic atrophy 1 (Opa1) control fusion, while dynamin-related protein 1 (Drp1) and Fis1 mediate mitochondrial fission process [20]. The imbalance in mitochondrial dynamics compromises the energy production and is linked to several diseases [20]. For example, mutation in Opa1 leads to visual failure and optic atrophy, followed by ataxia, deafness, and a sensory–motor neuropathy [21], whereas functional loss of Mfn2 gene leads to Charcot–Marie–Tooth disease, a peripheral neuropathy of motor and sensory neurons [22]. Recent reports have suggested that fusion (reticular structure) is important to maintain mitochondrial calcium buffering, propagate intra-mitochondrial Ca2+ waves, and preserve mitochondrial DNA [23]. The disruption of mitochondrial reticularity due to overexpression of Drp1 or Fis1 leads to mitochondrial fragmentation, suppression of electron transfer chain activities and mitochondrial metabolism, cell growth retardation, cytochrome c release, and activation of apoptotic cell death [24–28]. Mitochondrial fission can activate autophagy, which is responsible for decreasing mitochondrial number and activation of apoptosis, whereas Fis1 knockdown or overexpression of a dominant negative isoform of Drp1 (DRP1K38A) not only decreased mitochondrial autophagy but also reduced respiration [27, 29].
The relationship between mitochondrial dynamics and autophagy during cerebral ischemia is less clear, although fragmented or dysfunctional mitochondria are linked to neuronal cell damage [27–30]. Preischemic hyperglycemia/diabetes significantly worsens brain damage by inducing mitochondrial damage in early reperfusion stage [14, 15, 17]. The influences of hyperglycemia on mitochondrial fission and fusion, mitochondrial biogenesis, and autophagy after transient focal cerebral ischemia have not been reported. The aim of the present study was to explore whether preischemic hyperglycemia alters protein markers that are associated with mitochondrial fission and fusion, mitochondrial biogenesis, and autophagy in mice subjected to a 30-min transient middle cerebral artery occlusion (MCAO). The results showed that ischemia in normoglycemic animals increased fission and reduced fusion markers. Hyperglycemia further amplified the imbalance. In addition, hyperglycemia enhanced autophagy markers but did not alter mitochondrial biogenesis markers compared with normoglycemic animals. Thus, hyperglycemia-enhanced ischemic brain damage may be associated with increased imbalance of mitochondrial fission and fusion and activation of autophagy.
Materials and Methods
Experimental Animals and Groups
Male C57BL/6J mice weighing 24–26 g were used for the experiments. The animals were fasted overnight with free access to water. Mice were anesthetized with inhalation of 3.0 % isoflurane and maintained on 1.5 % isoflurane in N2O/O2 (70/30) through a facial mask during the operation. Forty animals were divided into normoglycemic and hyperglycemic groups (n=20 each group), each consisting of four subgroups: a sham-operated control (n=6) and 30-min MCAO plus 6- (n=6), 24- (n=4), and 72- (n=4) h of reperfusion.
Hyperglycemia was induced by intraperitoneal injection of 25 % glucose solution (0.3 ml) 30 min prior to induction of cerebral ischemia. Normoglycemic animals were injected with the same amount of 0.9 % saline. The blood glucose level was measured prior to the induction of cerebral ischemia by a glucometer. The glucose levels in hyperglycemic mice were between 14–20 mM, while the glucose levels were 5–6 mM in normoglycemic animals. The selection blood glucose levels between 14 and 20 mM was based on our previous study showing glucose threshold function in damage exacerbation [1, 2]. Non-fasted animal is not desirable for the study because of the large variation of blood glucose levels ranging from 5 to 12 mM based on our experience. All animal procedures were approved by the Institutional Animal Care and Use Committee at North Carolina Central University.
Ischemic Model
Cerebral ischemia was induced by intraluminal filament technique as we have described previously [3] by occluding middle cerebral artery (MCA). Briefly, a surgical midline incision was made to expose the right common, internal, and external carotid arteries. The right external carotid artery and the occipital arteries were ligated. The right common carotid artery (CCA) was ligated, and the right internal carotid artery (ICA) was temporarily closed by a lose suture. A small incision was then made in the CCA, and a filament, which had a distal cylinder of silicon rubber with a diameter of 0.21±0.02 mm, was inserted into the ICA through the CCA. The filament was advanced to the anterior carotid artery, bypassing and occluding the origin of MCA. After 30 min of occlusion, the filament was withdrawn to allow blood reperfusion. Control animals were subjected to the same surgical procedure as the MCAO mice except the occlusion of MCAO. The pathologic outcome of 30-min MCAO has been previously defined after 1–4 h of reperfusion and 7 days of recovery [3, 5]. The core and head temperatures during surgery were regularly maintained at 37±0.5 °C by a heating pad and a heating lamp. The degree of functional deficit at 1 h post-reperfusion was scored using a five-point Bederson’s scale [31]: scale 0, no deficit; 1, mild forelimb weakness; 2, severe forelimb weakness, consistently turns to side of deficit when lifted by tail; 3, compulsory circling; 4, unconscious; and 5, dead. Four animals with Bederson’s score less than 2 were excluded from the study.
Western Analysis
Brains were extracted and frozen in liquid nitrogen. Ischemic ipsilateral hemispheric cortex, which corresponds to the ischemic penumbra area in the model of 30-min MCAO, was dissected in a chilled box and homogenized in precooled suspension buffer (15 mM Tris pH 7.4, 0.25 M sucrose, 15 mM NaCl, 1.5 mM MgCl2, 0.25 mM Na3VO4, 25 mM NaF, 2 mM NaPPi, 2.5 mM EDTA, 1 mM EGTA, 0.5 mM PMSF, 1 mM DTT, 5 μg/ml leupeptin, 12 μg/ml pepstatin, and 2.5 μg/ml aprotinin). Cellular components were fractionated by a series of centrifugation [32]. Fractions of nucleus (P1), mitochondria (P2), and cytosol that also contains microsomes (S2) from the cortex were used for Western blot analyses. Protein concentration was determined by the Bradford method (Bio-Rad) and run in 4–12 % NuPAGE gel (Invitrogen). Briefly, the same amount of protein (20 μg) was applied to each lane in a gel. Following electrophoresis, proteins were transferred to a nitrocellulose membrane (Invitrogen). The membranes were incubated with primary antibodies against Drp1 at a dilution of 1:500 (sc-32898, rabbit polyclonal, Santa Cruz Biotechnology, CA, USA), Fis1 of 1:300 (JM-3491R-100, rabbit polyclonal, MBL, MA USA), Opa1 of 1:250 (sc-30572, goat polyclonal, Santa Cruz Biotechnology, CA, USA), Mfn2 of 1:500 (sc-50331, rabbit polyclonal, Santa Cruz Biotechnology, CA, USA), peroxisome proliferator-activated receptor gamma coactivator 1-alpha (PGC-1α) of 1:500 (2178, rabbit polyclonal, Cell signaling, MA, USA), nuclear respiratory factor 1 (NRF1) of 1:500 (sc-23624, goat polyclonal, Santa Cruz Biotechnology, CA, USA), COX IV of 1:1,000 (ab14744, mouse monoclonal, Abcam Inc, MA, USA), or β-actin of 1:1,000 (A1978, mouse monoclonal, Sigma) overnight at 4 °C. The membranes were incubated with horseradish peroxidase-conjugated secondary antibodies (IgG) against rabbit, goat, or mouse IgG in donkey for 1 h at room temperature. The blots were then developed using the Supersignal West Dura Extended Duration Substrate (Thermo Scientific). We were aware that using mouse monoclonal antibodies against β-actin and COX IV may produce background staining due to secondary antibody binding to endogenous mouse antibody. This was prevented by using Mouse on Mouse (M.O.M.) blocking reagent (Vector Laboratories), which was used to block endogenous mouse antibody in the tissue section. M.O.M. allows mouse primary antibodies to be stained while avoiding interfering background due to the detection reagents binding endogenous mouse antibody. The β-actin or COX IV bands were used as internal loading controls and the ratios of the target proteins optical density to β-actin or COX IV were calculated and presented as final results.
Electron Microscopic Studies
Four animals were used for mitochondrial morphological studies. Brains were perfusion-fixed with 2.5 % glutaraldehyde at 6 h of reperfusion collected in both normoglycemic and hyperglycemic mice (n=2 per group). Coronal brain sections (200-μm thick) at the level of Bregma 0.74 mm were postfixed with 4 % glutaraldehyde in 0.1 mol/l cacodylate buffer (pH 7.4). The sections were then soaked in 1 % osmium tetroxide in 0.1 M cacodylated buffers for 2 h, rinsed in distilled water, and stained with 1 % aqueous uranyl acetate overnight. Tissue sections were dehydrated in ascending series of ethanol to 100 % followed by dry acetone and embedded in epoxy resin. Ultrathin sections were counterstained with lead citrate before examination by LEO 912 EFTEM transmission electron microscope (Zeiss SMT).
Statistical Analysis
Significant differences were assessed using two-way ANOVA followed by Bonferroni posttests. Data are represented as mean ± SD. p<0.05 was considered as significant.
Results
Influence of Hyperglycemia on Levels of Mitochondrial Fission Markers after Ischemia
Fission protein Drp1 level increased biphasically following cerebral ischemia and reperfusion in cytosolic fractions. As shown in Fig. 1a, the Drp1 level significantly increased at 6 h (p<0.001), returned to control level at 24 h, and then followed by a secondary increase again at 72 h of reperfusion (p<0.001) in normoglycemic animals. The Drp1 baseline level was higher in hyperglycemic animals compared to normoglycemic control (p<0.001). The Drp1 level further increased at 6 h of reperfusion to a significant higher level than the hyperglycemic control (p<0.001) and the normoglycemic counterpart (p<0.001). At 24 h of reperfusion, the Drp1 level returned to hyperglycemic control level but remained higher than that of the normoglycemic counterpart (p<0.001). The Drp1 level declined to below control level after 72 h of reperfusion (p<0.001) in hyperglycemic animals. Two-way ANOVA analysis revealed both glycemic level and reperfusion time had significant influence on the Drp1 content.
Fig. 1.
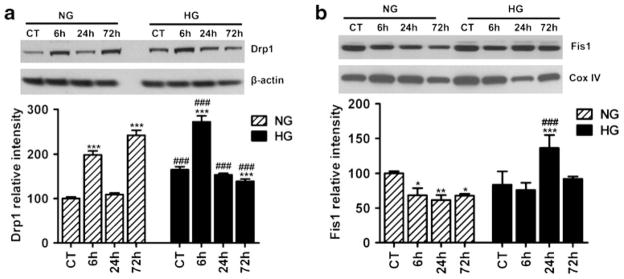
Representative Western blots and semiquantitative analysis of fission proteins Drp1 (a) and Fis1 (b) at different time points of ischemia and reperfusion in cortical area of normoglycemic and hyperglycemic animals (n=4 in each subgroup). Two-way ANOVA analysis revealed that both hyperglycemia status and reperfusion stage caused significant increases in the Drp1 and Fis1. Data are expressed as means ± SD. ***p<0.001 vs. respective sham-operated controls and ###p<0.001 vs. normoglycemic counterpart at an identical reperfusion stage. NG normoglycemic, HG hyperglycemic
Another pro-fission protein Fis1 (Fig. 1b) decreased in the mitochondrial fraction after 6–72 h of reperfusion in normoglycemic animals (p<0.001). In hyperglycemic animals, the protein level of Fis1 significantly increased at 24 h and then returned to control level at 72 h of reperfusion when compared to either hyperglycemic control or normoglycemic counterparts (Fig. 1b). Two-way ANOVA analysis revealed that both glycemia and reperfusion time significantly affect the Fis1 content.
Influence of Hyperglycemia on Mitochondrial Fusion Markers After Ischemia
To study the influence of hyperglycemia on mitochondrial fusion markers after cerebral ischemia and reperfusion, we analyzed the level of Opa1 and Mfn2 in mitochondrial fractions. The results showed that Opa1 level decreased in the mitochondrial fraction of mice subjected to 24 and 72 h of reperfusion in normoglycemic animals (Fig. 2a). The overall Opa1 level in hyperglycemic animals was lower than that of the normoglycemic animals as revealed by two-way ANOVA analysis (p<0.05). The protein level of Mfn2 in the mitochondrial fraction decreased after cerebral ischemia and reperfusion in normoglycemic animals (Fig. 2b). Hyperglycemia did not affect Mfn2 level although small-scale decrease was noted after 6 and 72 h of reperfusion. The overall difference between normoglycemic and hyperglycemic groups was not significant by two-way ANOVA analysis.
Fig. 2.
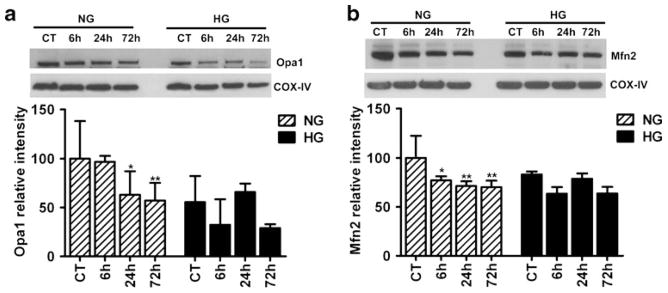
Representative immunoblots and semiquantitative analysis of Opa1 (a) and Mfn2 (b) in mitochondrial fraction of both normoglycemic and hyperglycemic animals at reperfusion stage in the cortical area (n=4 in each subgroup). Data are expressed as means ± SD. *p<0.05, **p<0.01 vs. respective controls. NG normoglycemic, HG hyperglycemic
Mitochondrial Fission/Fusion Index
To better differentiate the imbalance between mitochondrial fission and fusion mechanisms, we summed up the levels of mitochondrial fission and fusion markers, calculated the ratio of fission and fusion, and presented data as mitochondrial fission/fusion index. As shown in Fig. 3, cerebral ischemia affects mitochondrial dynamics. Therefore, mitochondrial fission/fusion index gradually increased and reached to significant level at 72 h of reperfusion in normoglycemic animals. Interestingly, hyperglycemia-induced increase in mitochondrial fission proteins further disturbed mitochondrial dynamics. Thus, mitochondrial fission/fusion index was higher in hyperglycemic as compared to normoglycemic animals. In addition, hyperglycemia disturbed mitochondrial dynamics faster as compared to normoglycemia following cerebral ischemia and reperfusion. Therefore, mitochondrial fission/fusion index reached the highest level at early (6) hours of reperfusion in hyperglycemic conditions as compared to normoglycemic conditions where mitochondrial index reached to the highest level at late (72) hours of reperfusion.
Fig. 3.
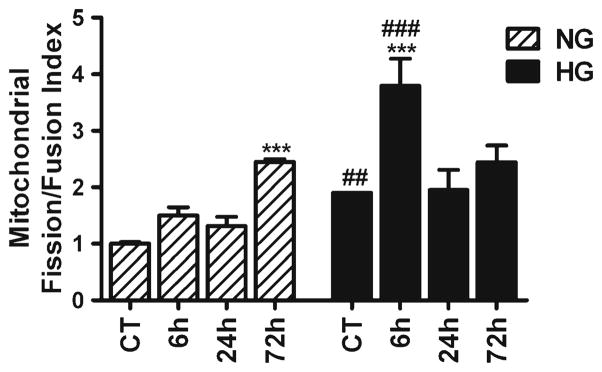
Mitochondrial fission/fusion index following cerebral ischemia and reperfusion in normoglymic and hyperglycemic animals. Index represents the ratio of fission (Drp1 and Fis1) and fusion (Opa1 and Mfn2) proteins. Data are expressed as means ± SD. *p<0.05, vs. respective sham-operated controls and #p<0.05 vs. normoglycemic counterpart at an identical reperfusion stage. NG normoglycemic, HG hyperglycemic
Ultrastructural Alterations of Mitochondria
To further demarcate the effect of hyperglycemia on mitochondria, we performed electron microscopy to analyze the ultrastructural changes in mitochondrial morphology. Mitochondrial morphology was normal in normoglycemic group up to 6 h of recovery (Fig. 4). In contrast, the mitochondrial morphological alterations were prominent in hyperglycemic mice after 6 h of recovery. Therefore, mitochondria showed marked swelling and loss of cristae beside the variation of size in hyperglycemic animals as compared to normoglycemic one after 6 h of reperfusion.
Fig. 4.
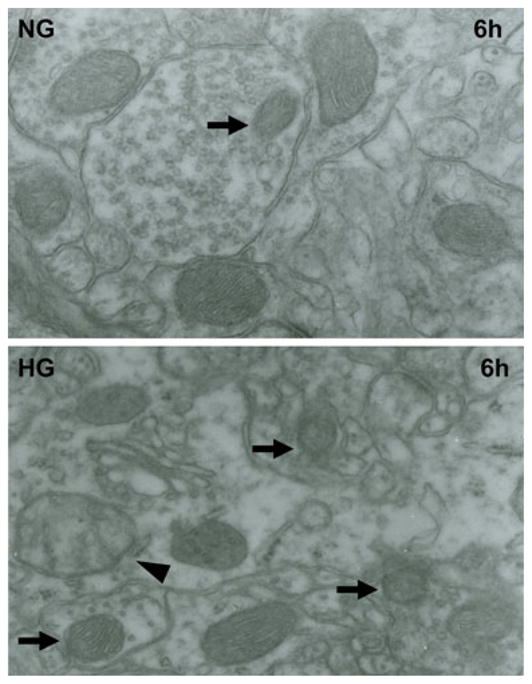
Representative electron micrographs of neuron form cortical area of the brains in normoglycemic and hyperglycemic animals after 6 h of reperfusion. Arrow indicates varying mitochondrial size whereas arrowhead shows mitochondrial swelling and disarrayed cristae. NG normoglycemic, HG hyperglycemic, 6 h 6 h reperfusion
Influence of Hyperglycemia on Mitochondrial Biogenesis Regulators Following Cerebral Ischemia and Reperfusion
As observed above, hyperglycemia increases mitochondrial fission proteins after ischemia and reperfusion. Since mitochondrial fission could lead to either mitochondrial fragmentation and apoptosis or mitochondrial biogenesis, we measured the protein levels of two key mitochondrial biogenesis regulators, NRF1 and PGC-1α, in the nuclear fraction (Fig. 5). Two-way ANOVA analysis revealed that the NRF1 significant difference was caused by reperfusion time but not glycemic levels. Ischemia induced NRF1 increase at reperfusion of 72 h in normoglycemic animals and of 6–24 h in hyperglycemic animals (p<0.05). The protein level of PGC-1α was neither affected by glycemic levels nor by reperfusion time according to two-way ANOVA analysis (Fig. 5).
Fig. 5.
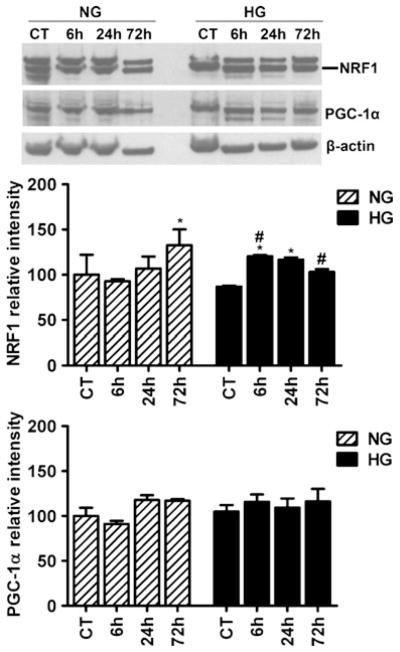
Representative Western blots and semiquantitative analysis of NRF1 and PGC-1α in cortical area of normoglycemic and hyperglycemic animals at different time points of ischemia and reperfusion (n=4 in each subgroup). Data are expressed as means ± SD. *p<0.05 vs. respective sham-operated controls and #p<0.05 vs. normoglycemic counterpart at an identical reperfusion stage. NG normoglycemic and HG hyperglycemic
Influence of Hyperglycemia on Autophagy Markers Following Cerebral Ischemia and Reperfusion
Mitochondrial fission has been shown to activate autophagy. Therefore, we examined the possible changes in the levels of beclin 1 and LC3 following focal cerebral ischemia and reperfusion under normoglycemic and hyperglycemic conditions. Western analysis of beclin 1 in cytosolic/microsome fraction (Fig. 6a) revealed that beclin 1 level moderately increased at 6 h (p<0.05), peaked at 24 h (p<0.001), and then reduced to below normal levels at 72 h (p<0.01) in normoglycemic animals. In hyperglycemic animals, beclin 1 level was significantly higher at baseline than normoglycemic animals (p<0.05). Following ischemia and reperfusion, beclin 1 level remained high and increased significantly at 72 h as compared to hyperglycemic control (p<0.01) and to normoglycemic counterpart at 72 h (p<0.001). Two-way ANOVA analysis revealed that both glycemia and reperfusion time were significant determinants of beclin 1 protein level. Another autophagy marker LC3 was also detected in the cytosolic/microsome fraction using Western blotting. LC3 is synthesized as pro-LC3 and then cleaved by Atg4 protease to LC3-I. Upon activation of autophagy, LC3- I is conjugated with phosphatidylethanolamine to form LC3-II, which become structural component of autophagosomes. Therefore, protein level of LC3-II is often used as a measure of autophagy [33]. As shown in Fig. 6b, LC3-II levels were not changed after ischemia and reperfusion in normoglycemic animals. Comparing to normoglycemic animals, hyperglycemia induced a significant surge in LC3-II level after 6 h of recovery (p<0.001) and then declined to baseline level thereafter.
Fig. 6.
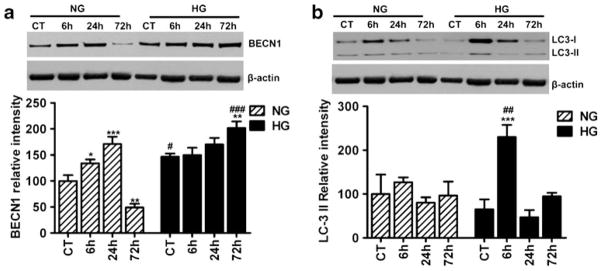
Representative Western blots and semiquantitative analysis of beclin1 (a) and LC3-II (b) at 6, 24, and 72 h of reperfusion following 30 min of ischemia in cortical brain area of normo- and hyperglycemic animals (n=4 in each subgroup). Data are expressed as means ± SD. *p<0.05; **p<0.01; ***p<0.001 vs. respective sham-operated controls and #p<0.05; ###p<0.001 vs. normoglycemic counterpart at an identical reperfusion stage. NG normoglycemic, HG hyperglycemic
Discussion
Present study demonstrates the involvement of hyperglycemia in modulating mitochondrial dynamics and autophagy following cerebral ischemia and reperfusion by analyzing the protein levels of fission (Drp1 and Fis1), fusion (Opa1 and Mfn2), mitochondrial biogenesis (NRF1 and PGC-1α), and autophagy (beclin 1 and LC3). The results demonstrated that ischemia and reperfusion increased fission protein Drp1, and preischemic hyperglycemia further augmented the alteration. The increase in Drp1 levels was higher in hyperglycemic animals at 6 h of reperfusion than normoglycemic counterpart, suggesting early stimulation of fission process by hyperglycemia. Interestingly, Drp1 was significantly higher even at the control level in hyperglycemic than in normoglycemic animals. Our findings are consistent with recent studies showing that high glucose increased mitochondrial fission in dorsal root ganglia neurons [34], coronary endothelial cells [35], and cardiac ventricular myocytes [36, 37]. In contrast to Drp1, another fission protein Fis1 decreased after ischemic and reperfusion. It is not clear why the two fission proteins behaved differently after ischemia and reperfusion. However, what is interesting to us is that hyperglycemia resulted in a significant increase of Fis1 after 24 h of reperfusion.
Our results showed that cerebral ischemia suppressed mitochondrial fusion proteins Opa1 at 24 and 72 h and Mfn2 at 6–72 h of recovery in normoglycemic animals. Suppression or mutation in Opa1 leads to mitochondrial dysfunction, fragmentation, cristae remodeling, and cytochrome c release [38]. Compared with normoglycemic animals, hyperglycemia further lowered the Opa1 but not the Mfn2 levels based on two-way ANOVA analysis. The overall fission–fusion results thus suggest that hyperglycemia may tilt the ischemia-induced mitochondrial dynamic imbalance towards fission. The tilting of mitochondrial dynamics balance may decrease mitochondrial reticularity and enhance mitochondrial fragmentation and neuronal cell death following cerebral ischemia [39]. These results were further supported by mitochondrial fission/fusion index data, which revealed disturbance in mitochondrial dynamics following cerebral ischemia. Mitochondrial fission/fusion index was higher at each time points and dynamics was disturbed much faster (6 h) by hyperglycemia as compared to normoglycemia (72 h) following reperfusion. Moreover, mitochondrial ultrastructural analysis revealed that mitochondrial morphology was normal in normoglycemic group up to 6 h of reperfusion whereas prominent mitochondrial morphological alterations were noticed in the form of swelling and loss of cristae in hyperglycemic animals as compared to normoglycemic ones. We have previously demonstrated that hyperglycemia exacerbates ischemic brain damage [1–4, 14–17]. The visible damage appear in the cortex after 2 h of reperfusion in 30-min ischemia in hyperglycemic animals, whereas no damage were noticed up to 4 h reperfusion in normoglycemic animals, suggesting that the progression of damage is much faster in hyperglycemic conditions [3]. The present study do not differentiate whether the increased disturbance in mitochondrial dynamics and morphology in hyperglycemic conditions is responsible for exaggeration of ischemic damage or is the result of increased damage. However, an in vitro study revealed that high glucose-induced mitochondrial fission was responsible for mitochondrial membrane hyperpolarization and increased ROS production [36]. Likewise, hyperglycemia activates Drp1-dependant mitochondrial fission and creates numbers of small damaged mitochondria, which are responsible for injuring dorsal root ganglia neurons [40], whereas efficient knockdown of Drp1 in neurons decreased glucose-mediated neuronal injury [40].
Recent reports suggest that neurons may increase the number of mitochondria through activation of mitochondrial biogenesis pathway involving NRF1, PGC-1α, and Tfam [41] during hypoxic/ischemic injury [42, 43]. To study this possibility, we measured protein levels of two key nuclear regulators for mitochondrial biogenesis, NRF1 and PGC-1α. The results showed that cerebral ischemia increased the levels of NRF1 but not PGC-1α. Hyperglycemia did not exert additional influence on NRF1 or PGC-1α according to the two-way ANOVA analysis. NRF1 increased in normoglycemic animals at 72 h of reperfusion, whereas similar moderate increase was observed after 6 and 24 h of reperfusion in hyperglycemic animals. It is possible that the observed increase of NRF1 after reperfusion in both normo-and hyperglycemic animals stimulates mitochondrial biogenesis. However, this effect is induced by reperfusion rather than hyperglycemia based on the statistical analysis.
Autophagy (aka macroautophagy) is a process by which cellular proteins and organelles are degraded [44, 45]. Available evidence suggests that imbalance in mitochondrial dynamics may trigger autophagy [27]. The fact that hyperglycemia increases fission and decreases fusion regulators in our findings aroused us to further investigate whether autophagy is activated by cerebral ischemia under hyperglycemic condition. The results showed that ischemia increased beclin 1 after 6 and 24 h of reperfusion, and preischemic hyperglycemia further elevated the levels at control and maintained it at high level following reperfusion of 6 h and peaked at 72 h. LC3-II levels did not increase after ischemia and reperfusion in normoglycemic animals. In contrast, it increased at 6 h of reperfusion in hyperglycemic animals. Taken together, these results suggest that ischemia may activate autophagy process and hyperglycemia may further enhance the process. Our data are consistent with previous observations that hyperglycemia induces mitochondrial fragmentation and mitochondrial dysfunction [17, 34–37, 40] and that cerebral ischemia activates autophagy in ischemic brain [46, 47]. It is not known, whether enhanced autophagy is protective or destructive. While physiological autophagy ensures removal of abnormal aggregated proteins and degenerated subcellular organelles, massive autophagy may represent an alternative pathway of cell death [48].
In summary, cerebral ischemia alters mitochondrial dynamics by increasing fission and suppressing fusion regulators. Hyperglycemia, a known detrimental factor to ischemic brain injury, further exacerbates the imbalance between mitochondrial fission and fusion, which favors mitochondrial fragmentation and subsequent mitochondrial damage. Correspondingly, autophagy is activated by cerebral ischemia and further enhanced by preischemic hyperglycemia. The increased autophagy observed in hyperglycemic animals after ischemia may represent an adapting reaction to the severe damage induced by hyperglycemia or a third pathway to death, in addition to apoptosis and necrosis.
Acknowledgments
This work is supported by a grant from the National Institute of Health to PAL (7R01DK075476). The BRITE is partially funded by the Golden Leaf Foundation.
Abbreviations
- CCA
Common carotid artery
- Drp1
Dynamin-related protein 1
- Mfn2
Mitofusin 2
- ICA
Internal carotid artery
- LC3
Microtubule-associated protein light chain 3
- MCA
Middle cerebral artery
- MCAO
Middle cerebral artery occlusion
- NRF1
Nuclear respiratory factor 1
- Opa1
Optic atrophy 1
- PGC-1α
Peroxisome proliferator-activated receptor gamma coactivator 1-alpha
- Tfam
Transcription factor A
Footnotes
Conflict of Interest The authors declare that there are no conflicts of interest.
References
- 1.Li PA, Shamloo M, Smith ML, Katsura K, Siesjo BK. The influence of plasma glucose concentrations on ischemic brain damage is a threshold function. Neurosci Lett. 1994;177:63–5. doi: 10.1016/0304-3940(94)90045-0. [DOI] [PubMed] [Google Scholar]
- 2.Li PA, Shamloo M, Katsura K, Smith ML, Siesjo BK. Critical values for plasma glucose in aggravating ischaemic brain damage: correlation to extracellular pH. Neurobiol Dis. 1995;2:97–108. doi: 10.1006/nbdi.1995.0010. [DOI] [PubMed] [Google Scholar]
- 3.Li PA, Gisselsson L, Keuker J, Vogel J, Smith ML, Kuschinsky W, Siesjo BK. Hyperglycemia-exaggerated ischemic brain damage following 30 min of middle cerebral artery occlusion is not due to capillary obstruction. Brain Res. 1998;804:36–44. doi: 10.1016/s0006-8993(98)00651-9. [DOI] [PubMed] [Google Scholar]
- 4.Li PA, Siesjo BK. Role of hyperglycaemia-related acidosis in ischaemic brain damage. Acta Physiol Scand. 1997;161:567–80. doi: 10.1046/j.1365-201X.1997.00264.x. [DOI] [PubMed] [Google Scholar]
- 5.Gisselsson L, Smith ML, Siesjo BK. Hyperglycemia and focal brain ischemia. J Cereb Blood Flow Metab. 1999;19:288–97. doi: 10.1097/00004647-199903000-00007. [DOI] [PubMed] [Google Scholar]
- 6.Martini SR, Kent TA. Hyperglycemia in acute ischemic stroke: a vascular perspective. J Cereb Blood Flow Metab. 2007;27:435–51. doi: 10.1038/sj.jcbfm.9600355. [DOI] [PubMed] [Google Scholar]
- 7.Xing Y, Jiang X, Yang Y, Xi G. Hemorrhagic transformation induced by acute hyperglycemia in a rat model of transient focal ischemia. Acta Neurochir Suppl. 2011;111:49–54. doi: 10.1007/978-3-7091-0693-8_9. [DOI] [PubMed] [Google Scholar]
- 8.Abbott RD, Donahue RP, MacMahon SW, Reed DM, Yano K. Diabetes and the risk of stroke. The Honolulu Heart Program. JAMA. 1987;257:949–52. [PubMed] [Google Scholar]
- 9.Rodriguez BL, Abbott RD, Fujimoto W, Waitzfelder B, Chen R, Masaki K, Schatz I, Petrovitch H, Ross W, Yano K, Blanchette PL, Curb JD. The American Diabetes Association and World Health Organization classifications for diabetes: their impact on diabetes prevalence and total and cardiovascular disease mortality in elderly Japanese-American men. Diabetes Care. 2002;25:951–5. doi: 10.2337/diacare.25.6.951. [DOI] [PubMed] [Google Scholar]
- 10.Bruno A, Williams LS, Kent TA. How important is hyperglycemia during acute brain infarction? Neurologist. 2004;10:195–200. doi: 10.1097/01.nrl.0000131800.77824.dd. [DOI] [PubMed] [Google Scholar]
- 11.Capes SE, Hunt D, Malmberg K, Pathak P, Gerstein HC. Stress hyperglycemia and prognosis of stroke in nondiabetic and diabetic patients: a systematic overview. Stroke. 2001;32:2426–32. doi: 10.1161/hs1001.096194. [DOI] [PubMed] [Google Scholar]
- 12.Els T, Klisch J, Orszagh M, Hetzel A, Schulte-Monting J, Schumacher M, Lucking CH. Hyperglycemia in patients with focal cerebral ischemia after intravenous thrombolysis: influence on clinical outcome and infarct size. Cerebrovasc Dis. 2002;13:89–94. doi: 10.1159/000047756. [DOI] [PubMed] [Google Scholar]
- 13.Tuomilehto J, Rastenyte D, Jousilahti P, Sarti C, Vartiainen E. Diabetes mellitus as a risk factor for death from stroke. Prospective study of the middle-aged Finnish population. Stroke. 1996;27:210–5. doi: 10.1161/01.str.27.2.210. [DOI] [PubMed] [Google Scholar]
- 14.Ding C, He Q, Li PA. Activation of cell death pathway after a brief period of global ischemia in diabetic and non-diabetic animals. Exp Neurol. 2004;188:421–9. doi: 10.1016/j.expneurol.2004.04.013. [DOI] [PubMed] [Google Scholar]
- 15.Li PA, Rasquinha I, He QP, Siesjö BK, Csiszár K, Boyd CD, MacManus JP. Hyperglycemia enhances DNA fragmentation after transient cerebral ischemia. J Cereb Blood Flow Metab. 2001;21:568–76. doi: 10.1097/00004647-200105000-00011. [DOI] [PubMed] [Google Scholar]
- 16.Muranyi M, Fujioka M, He Q, Han A, Yong G, Csiszar K, Li PA. Diabetes activates cell death pathway after transient focal cerebral ischemia. Diabetes. 2003;52:481–6. doi: 10.2337/diabetes.52.2.481. [DOI] [PubMed] [Google Scholar]
- 17.Muranyi M, Ding C, He Q, Lin Y, Li PA. Streptozotocin-induced diabetes causes astrocyte death after ischemia and reperfusion injury. Diabetes. 2006;55:349–55. doi: 10.2337/diabetes.55.02.06.db05-0654. [DOI] [PubMed] [Google Scholar]
- 18.Keep RF, Andjelkovic AV, Stamatovic SM, Shakui P, Ennis SR. Ischemia-induced endothelial cell dysfunction. Acta Neurochir Suppl. 2005;95:399–402. doi: 10.1007/3-211-32318-x_81. [DOI] [PubMed] [Google Scholar]
- 19.Yang X, Borg LA, Eriksson UJ. Altered mitochondrial morphology of rat embryos in diabetic pregnancy. Anat Rec. 1995;241:255–67. doi: 10.1002/ar.1092410212. [DOI] [PubMed] [Google Scholar]
- 20.Chen H, Chan DC. Mitochondrial dynamics—fusion, fission, movement, and mitophagy—in neurodegenerative diseases. Hum Mol Genet. 2009;18:pR169–76. doi: 10.1093/hmg/ddp326. [DOI] [PMC free article] [PubMed] [Google Scholar]
- 21.Van Bergen NJ, Crowston JG, Kearns LS, Staffieri SE, Hewitt AW, Cohn AC, Mackey DA, Trounce IA. Mitochondrial oxidative phosphorylation compensation may preserve vision in patients with Opa1-linked autosomal dominant optic atrophy. PLoS One. 2010;6:e21347. doi: 10.1371/journal.pone.0021347. [DOI] [PMC free article] [PubMed] [Google Scholar]
- 22.Züchner S, Mersiyanova IV, Muglia M, Bissar-Tadmouri N, Rochelle J, Dadali EL, Zappia M, Nelis E, Patitucci A, Senderek J, Parman Y, Evgrafov O, Jonghe PD, Takahashi Y, Tsuji S, Pericak-Vance MA, Quattrone A, Battaloglu E, Polyakov AV, Timmerman V, Schröder JM, Vance JM. Mutations in the mitochondrial GTPase mitofusin 2 cause Charcot–Marie–Tooth neuropathy type 2A. Nat Genet. 2004;36:449–51. doi: 10.1038/ng1341. [DOI] [PubMed] [Google Scholar]
- 23.Parone PA, Da Cruz S, Tondera D, Mattenberger Y, James DI, Maechler P, Barja F, Martinou JC. Preventing mitochondrial fission impairs mitochondrial function and leads to loss of mitochondrial DNA. PLoS One. 2008;3:e3257. doi: 10.1371/journal.pone.0003257. [DOI] [PMC free article] [PubMed] [Google Scholar]
- 24.Chen H, Chomyn A, Chan DC. Disruption of fusion results in mitochondrial heterogeneity and dysfunction. J Biol Chem. 2005;280:26185–92. doi: 10.1074/jbc.M503062200. [DOI] [PubMed] [Google Scholar]
- 25.Jahani-Asl A, Cheung EC, Neuspiel M, MacLaurin JG, Fortin A, Park DS, McBride HM, Slack RS. Mitofusin 2 protects cerebellar granule neurons against injury-induced cell death. J Biol Chem. 2007;282:23788–98. doi: 10.1074/jbc.M703812200. [DOI] [PubMed] [Google Scholar]
- 26.James DI, Parone PA, Mattenberger Y, Martinou JC. hFis1, a novel component of the mammalian mitochondrial fission machinery. J Biol Chem. 2003;278:36373–9. doi: 10.1074/jbc.M303758200. [DOI] [PubMed] [Google Scholar]
- 27.Twig G, Elorza A, Molina AJ, Mohamed H, Wikstrom JD, Walzer G, Stiles L, Haigh SE, Katz S, Las G, Alroy J, Wu M, Py BF, Yuan J, Deeney JT, Corkey BE, Shirihai OS. Fission and selective fusion govern mitochondrial segregation and elimination by autophagy. EMBO J. 2008;27:433–46. doi: 10.1038/sj.emboj.7601963. [DOI] [PMC free article] [PubMed] [Google Scholar]
- 28.Manczak M, Calkins MJ, Reddy PH. Impaired mitochondrial dynamics and abnormal interaction of amyloid beta with mitochondrial protein Drp1 in neurons from patients with Alzheimer’s disease: implications for neuronal damage. Hum Mol Genet. 2011;20:2495–509. doi: 10.1093/hmg/ddr139. [DOI] [PMC free article] [PubMed] [Google Scholar]
- 29.Gomes LC, Scorrano L. High levels of Fis1, a pro-fission mitochondrial protein, trigger autophagy. Biochim Biophys Acta. 2008;1777:860–6. doi: 10.1016/j.bbabio.2008.05.442. [DOI] [PubMed] [Google Scholar]
- 30.Moreira PI, Siedlak SL, Wang X, Santos MS, Oliveira CR, Tabaton M, Nunomura A, Szweda LI, Aliev G, Smith MA, Zhu X, Perry G. Increased autophagic degradation of mitochondria in Alzheimer disease. Autophagy. 2007;3:614–5. doi: 10.4161/auto.4872. [DOI] [PubMed] [Google Scholar]
- 31.Bederson JB, Pitts LH, Tsuji M, Nishimura MC, Davis RL, Bartkowski H. Rat middle cerebral artery occlusion: evaluation of the model and development of a neurologic examination. Stroke. 1986;17:472–6. doi: 10.1161/01.str.17.3.472. [DOI] [PubMed] [Google Scholar]
- 32.Zhao H, Yenari MA, Cheng D, Barreto-Chang OL, Sapolsky RM, Steinberg GK. Bcl-2 transfection via herpes simplex virus blocks apoptosis-inducing factor translocation after focal ischemia in the rat. J Cereb Blood Flow Metab. 2004;24:681–92. doi: 10.1097/01.WCB.0000127161.89708.A5. [DOI] [PubMed] [Google Scholar]
- 33.Kabeya Y, Mizushima N, Yamamoto A, Oshitani-Okamoto S, Ohsumi Y, Yoshimori T. LC3, GABARAP and GATE16 localize to autophagosomal membrane depending on form-II formation. J Cell Sci. 2004;117:2805–12. doi: 10.1242/jcs.01131. [DOI] [PubMed] [Google Scholar]
- 34.Vincent AM, Edwards JL, McLean LL, Hong Y, Cerri F, Lopez I, Quattrini A, Feldman EL. Mitochondrial biogenesis and fission in axons in cell culture and animal models of diabetic neuropathy. Acta Neuropathol. 2010;120:477–89. doi: 10.1007/s00401-010-0697-7. [DOI] [PMC free article] [PubMed] [Google Scholar]
- 35.Makino A, Scott BT, Dillmann WH. Mitochondrial fragmentation and superoxide anion production in coronary endothelial cells from a mouse model of type 1 diabetes. Diabetologia. 2010;53:1783–94. doi: 10.1007/s00125-010-1770-4. [DOI] [PMC free article] [PubMed] [Google Scholar]
- 36.Yu T, Robotham JL, Yoon Y. Increased production of reactive oxygen species in hyperglycemic conditions requires dynamic change of mitochondrial morphology. Proc Natl Acad Sci U S A. 2006;103:2653–8. doi: 10.1073/pnas.0511154103. [DOI] [PMC free article] [PubMed] [Google Scholar]
- 37.Yu T, Sheu SS, Robotham JL, Yoon Y. Mitochondrial fission mediates high glucose-induced cell death through elevated production of reactive oxygen species. Cardiovasc Res. 2008;79:341–51. doi: 10.1093/cvr/cvn104. [DOI] [PMC free article] [PubMed] [Google Scholar]
- 38.Yu-Wai-Man P, Trenell MI, Hollingsworth KG, Griffiths PG, Chinnery PF. OPA1 mutations impair mitochondrial function in both pure and complicated dominant optic atrophy. Brain. 2011;134:e164. doi: 10.1093/brain/awq288. [DOI] [PMC free article] [PubMed] [Google Scholar]
- 39.Solenski NJ, diPierro CG, Trimmer PA, Kwan AL, Helm GA. Ultrastructural changes of neuronal mitochondria after transient and permanent cerebral ischemia. Stroke. 2002;33:816–24. doi: 10.1161/hs0302.104541. [DOI] [PubMed] [Google Scholar]
- 40.Leinninger GM, Backus C, Sastry AM, Yi YB, Wang CW, Feldman EL. Mitochondria in DRG neurons undergo hyperglycemic mediated injury through Bim, Bax and the fission protein Drp1. Neurobiol Dis. 2006;23:11–22. doi: 10.1016/j.nbd.2006.01.017. [DOI] [PubMed] [Google Scholar]
- 41.Manoli I, Alesci S, Blackman MR, Su YA, Rennert OM, Chrousos GP. Mitochondria as key components of the stress response. Trends Endocrinol Metab. 2007;18:190–8. doi: 10.1016/j.tem.2007.04.004. [DOI] [PubMed] [Google Scholar]
- 42.Yin W, Signore AP, Iwai M, Cao G, Gao Y, Chen J. Rapidly increased neuronal mitochondrial biogenesis after hypoxic–ischemic brain injury. Stroke. 2008;39:3057–63. doi: 10.1161/STROKEAHA.108.520114. [DOI] [PMC free article] [PubMed] [Google Scholar]
- 43.Gutsaeva DR, Carraway MS, Suliman HB, Demchenko IT, Shitara H, Yonekawa H, Piantadosi CA. Transient hypoxia stimulates mitochondrial biogenesis in brain subcortex by a neuronal nitric oxide synthase-dependent mechanism. J Neurosci. 2008;28:2015–24. doi: 10.1523/JNEUROSCI.5654-07.2008. [DOI] [PMC free article] [PubMed] [Google Scholar]
- 44.Kundu M, Thompson CB. Autophagy: basic principles and relevance to disease. Ann Rev Pathol. 2008;3:427–55. doi: 10.1146/annurev.pathmechdis.2.010506.091842. [DOI] [PubMed] [Google Scholar]
- 45.Mizushima N, Levine B, Cuervo AM, Klionsky DJ. Autophagy fights disease through cellular self-digestion. Nature. 2008;451:1069–75. doi: 10.1038/nature06639. [DOI] [PMC free article] [PubMed] [Google Scholar]
- 46.Rami A, Langhagen A, Steiger S. Focal cerebral ischemia induces upregulation of Beclin 1 and autophagy-like cell death. Neurobiol Dis. 2008;29:132–41. doi: 10.1016/j.nbd.2007.08.005. [DOI] [PubMed] [Google Scholar]
- 47.Liu C, Gao Y, Barrett J, Hu B. Autophagy and protein aggregation after brain ischemia. J Neurochem. 2010;115:68–78. doi: 10.1111/j.1471-4159.2010.06905.x. [DOI] [PMC free article] [PubMed] [Google Scholar]
- 48.Rami A. Review: autophagy in neurodegeneration: firefighter and/or incendiarist? Neuropathol Appl Neurobiol. 2009;35:449–61. doi: 10.1111/j.1365-2990.2009.01034.x. [DOI] [PubMed] [Google Scholar]


