

Abstract
OBJECTIVES
The aim of this study was to image expression of receptor for advanced glycation end products (RAGE) in a mouse model of myocardial reperfusion injury.
BACKGROUND
RAGE and its ligands are implicated in the pathogenesis of ischemia/reperfusion injury and infarction. We hypothesized that RAGE-directed quantitative imaging of myocardial uptake of technetium-99m (99mTc)-anti-RAGE F(ab′)2 in a mouse model of myocardial ischemic injury can detect RAGE expression and show quantitative differences between early (18 to 20 h) and later times (48 h) after reperfusion.
METHODS
Twenty-five wild-type (WT) mice underwent left anterior descending coronary artery occlusion for 30 min. Mice were injected with 19.98 ± 1.78 MBq of 99mTc anti-RAGE F(ab′)2 at 2 time points after reperfusion (at 18 to 20 h [n = 8] and at 48 h [n = 12]) and 5 h later with 6.14 ± 2.0 MBq of thallium-201 (201Tl). Five WT mice were injected with nonspecific F(ab′)2 and 201Tl 18 to 20 h after reperfusion. Six WT mice underwent sham operation without coronary intervention. After injection with 201Tl, all mice immediately underwent dual isotope single-photon emission computed tomography/computed tomography. At completion of imaging, hearts were counted and sectioned.
RESULTS
The uptake of 99mTc-anti-RAGE F(ab′)2 in the ischemic zone from the scans as mean percentage injected dose was significantly greater at 18 to 20 h (5.7 ± 2.1 × 10⁻³%) as compared with at 48 h (1.4 ± 1.1 × 10⁻³%; p < 0.001) after reperfusion. Disease and antibody controls showed no focal uptake in the infarct. Gamma well counting of the myocardium supported the quantitative scan data. By immunohistochemical staining there was greater caspase-3 and RAGE staining at 18 to 20 h versus at 48 h (p = 0.04 and p = 0.01, respectively). On dual immunofluorescence, RAGE colocalized mainly with injured cardiomyocytes undergoing apoptosis.
CONCLUSIONS
RAGE expression in myocardial ischemic injury can be imaged in vivo using a novel 99mTc-anti-RAGE F(ab′)2. RAGE plays a role in several cardiovascular diseases and is a potential target for clinical imaging.
Keywords: molecular imaging, myocardial infarction, nano-SPECT/CT, RAGE
Myocardial infarction and its consequences are a leading cause of morbidity and mortality. Previous studies have shown that receptor for advanced glycation end products (RAGE) and its ligands have been implicated in the pathogenesis of myocardial ischemic damage and reperfusion injury (1). The binding of products of nonenzymatic glycation and other proinflammatory and tissue destructive ligands to RAGE, a receptor of the immunoglobulin superfamily of cell surface molecules, triggers many important downstream pathways implicated in inflammation as well as renal failure, aging, cancer, and diabetes (2–6).
A novel peptide sequence on the V-domain of the extracellular receptor of RAGE was first characterized by Neper et al. (2). Using this peptide as antigen, a monoclonal antibody to RAGE was developed using hybridoma technology (Strategic BioSolutions, Newark, Delaware).
The present study was undertaken to test the hypothesis that RAGE expression in injured myocardium can be imaged in vivo using this radiolabeled anti-RAGE antibody fragment and that quantification of radiotracer uptake can track changes in receptor expression. Such noninvasive tracking of RAGE expression in myocardial infarction in a relevant animal model may provide a platform for assessing targeted drug therapy to reduce myocardial damage and could provide a noninvasive imaging strategy for patients.
METHODS
Development of monoclonal anti-RAGE antibody
We developed a novel antibody in mice against the V-domain of RAGE designed to display immunoreactivity in mice, pigs, and humans. Based on Genbank sequences of human, murine, and porcine RAGE, a sequence alignment was determined and peptide prepared consisting of 17 amino acids: 1-NRRGKEVKSNYRVRVYQIC-19. Mice were immunized with the peptide and spleens harvested to produce hybridomas for murine monoclonal antibody (IgG2a, k) production (Strategic Diagnostics, Newark, Delaware). The monoclonal anti-RAGE antibody was fragmented using pepsin digestion into F(ab′)2 fragments (approximately 110 kDa) and immunoreactivity tested by enzyme-linked immunosorbent assay using soluble RAGE antigen. Direct coupling of diethylenetriaminepentaacetic acid (DTPA) (bicyclic anhydride) to anti-RAGE F(ab′)2 antibody fragments for technetium-99m (99mTc) labeling was performed. Blood pool clearance allows imaging at 4 to 5 h after injection (7).
Animals
Male C57BL/6 mice (8 to 10 weeks old) (n = 31) were obtained from Jackson Laboratories (Bar Harbor, Maine). All animal procedures were approved by the Institutional Animal Care and Use Committee of Columbia University. The experimental protocol is outlined in Figure 1.
Figure 1. Schematic Diagram of the Experimental Protocol.

LAD = left anterior descending artery; RAGE = receptor for advanced glycation end products; SPECT/CT = single-photon emission computed tomography/computed tomography; 99mTc = technetium-99m; 201Tl = thallium-201.
Surgical procedures
Mice underwent 30-min left anterior descending artery (LAD) occlusion (n = 25) or sham surgery (n = 6) followed by reperfusion. Briefly, mice were anesthetized with ketamine (100 mg/kg) and xylazine (5 mg/kg intraperitoneally), intubated, and ventilated with room air using a rodent miniventilator (Harvard Apparatus, Holliston, Massachusetts). A left thoracotomy was performed, and the heart was accessed between the third and fourth intercostal space. An 8-0 Prolene suture was placed around the LAD immediately after the bifurcation of the major left coronary artery and ligated for 30 min. The ligature was then removed, and blood flow was restored. The chest cavity was closed, and the animals were allowed to recover.
Radiotracer preparation
Direct labeling of the antibody fragment with DTPA for 99mTc labeling was undertaken as previously described (7,8). The mean specific activity was 8.14 ± 3.8 MBq/μg of protein, and the mean radiopurity was 98 ± 0.83% by instant thin-layer chromatography. To localize the in vivo antibody uptake by histology, DTPA-labeled anti-RAGE F(ab′)2 was conjugated to rhodamine isothiocyanate and purified as previously reported (7).
Injection and imaging
Mice were anesthetized and injected with 19.98 ± 1.78 MBq of 99mTc-labeled anti-RAGE F(ab′)2 via femoral vein catheter at 18 to 20 h (n = 8) or 48 h (n = 12) after reperfusion or sham surgery (n = 6). Five additional mice were injected with purified nonimmune mouse IgG F(ab′)2 (Alpha Diagnostic, San Antonio, Texas) at 18 to 20 h after reperfusion. Five hours later, each animal was re-anesthetized and injected with 6.14 ± 2.0 MBq of thallium-201 (201TI) and immediately underwent dual isotope hybrid single-photon emission computed tomography/computed tomography (SPECT/CT) imaging using both the 99mTc photopeak (140 keV) and the 201TI photopeak (68 keV).
Helical SPECT/CT images were acquired with dual-headed sodium iodide (TI) detectors, each outfitted with 9 pinholes. Each pinhole had a diameter of 1.4 mm, with each collimator providing a transaxial field of view of 30 mm and an axial field of view of 16 mm, extendable through helical scanning to 270 mm. A topogram (sequence of 2-dimensional side view x-ray projections) was used to determine the axial scan range for SPECT and CT imaging. The acquisition was set up with the following parameters: step and shoot rotation, 30° step in 360° rotation using 24 projections, 60 per projection, and a 256 × 256 frame size with 1.0 mm pixels. The obtained projection data were reconstructed iteratively with ordered subsets expectation maximization algorithm. CT scans were performed using a tube voltage of 45 keV and an exposure time of 1,000 ms per view. The CT and SPECT data were fused and reconstructed using InVivoScope software.
Image analyses
Simultaneously acquired 201TI and 99mTc reconstructed transverse slices were displayed for uptake of 99mTc-anti-RAGE antibody in relationship to 201TI uptake that delineates perfused myocardium. Regions of interest (ROIs) on the transverse projections were drawn around focal areas of 99mTc uptake and counts from the ROIs converted to microcuries (μCi) using InVivoScope software. The system is calibrated for absolute quantification using specially designed mouse-shaped phantoms filled with known levels of 99mTc imaged with the same protocol used for the animal studies. The quantitative uptake in the infarcted myocardium converted to megabecquerel (MBq) was divided by the total injected dose to obtain percentage of injected dose (%ID). Regions were also drawn around 201TI uptake on the coronal projections to calculate total myocardial left ventricle (LV) volume and volume of the section of myocardium that included the ischemic zone to calculate %ID per gram (%ID/g), assuming the specific gravity of heart is similar to water and equal to 1.0.
Gamma well counting
After the final imaging session, the animals were sacrificed, tissue samples from the heart were excised and weighed, and the radioactivity was counted in a gamma counter (Wallac Wizard 1470, PerkinElmer, Boston, Massachusetts) for determination of the %ID/g of tissue. The radiotracer activity in the samples was corrected for background, decay time, and tissue weight.
Histochemical analysis
Pathological characterization of the heart was undertaken by histology and immunohistochemical staining. Serial sections (5-μm thick) from paraffin-embedded hearts were stained with hematoxylin and eosin and examined with ×20 magnification using a microscope. The infarct area was expressed as a percentage of the total myocardium. For immunohistochemical staining, deparaffinized tissue sections were treated with 0.3% hydrogen peroxide to block endogenous peroxidase activity. Tissue sections were then incubated in protein-free block (Dako, Carpinteria, California) for 10 min to inhibit the nonspecific binding of primary antibodies. Sections were examined for the presence of RAGE (anti-RAGE antibody fragment), leukocytes (myeloperoxidase; Abcam, Cambridge, Massachusetts), and apoptosis (α-active caspase-3; Promega, Madison, Wisconsin). Secondary stains were performed using avidin-biotin visualization systems (Vectastain ABC Kit, Vector Laboratories, Burlingame, California).
Immunostains were examined using a Nikon microscope (Nikon, Tokyo, Japan), and digital images were analyzed using Image-Pro Plus software (Media Cybernetics Inc., Bethesda, Maryland). Infarct areas stained positive for a particular chromogen were identified using a color recognition method and measured by averaging results for 3 representative high-powered fields (×100) in each tissue cross section.
Immunofluorescence
Dual-label confocal microscopy was performed to determine the cell types expressing RAGE in the infarcted myocardium. Myocardial sections were stained to visualize immunofluorescent colocalization of RAGE (anti-RAGE, Texas red) with endothelial cells (FVIII, fluorescein isothiocyanate [FITC]), leukocytes (myeloperoxidase, FITC), smooth muscle cells (α-actin, FITC), cardiomyocytes (α-sarcomeric actin, FITC), apoptotic cells (α-active caspase-3, FITC), and with injured myocytes (α-myosin antibody, FITC). Counterstaining with 4′,6-diamidino-2-phenylindole (blue) was performed to identify nuclei. To localize uptake of the radiolabeled antibody by histology, DTPA-labeled anti-RAGE F(ab′)2 was conjugated to rhodamine isothiocyanate and labeled with 99mTc.
Statistical analysis
Continuous variables were expressed as mean ± SD. Normality was assessed using the Shapiro-Wilk W test. Equality of variances was assessed using the Levene test. Comparisons between groups were made using the Student t test or the Mann-Whitney U test, as appropriate. Correlation was assessed using the Pearson product-moment correlation coefficient. All statistical tests were 2-tailed, with p < 0.05 denoting significance. Statistical analyses were performed using STATA 10.1 (StataCorp, College Station, Texas).
RESULTS
SPECT/CT imaging
On the reconstructed scans from mice injected with 99mTc-anti-RAGE F(ab′)2, the signal from the radiolabeled antibody was detected in the ischemic zone delineated as a 201TI defect (Fig. 2). Tracer uptake in the ischemic region from the scans was higher in mice imaged at 18 to 20 h after reperfusion as compared with those imaged at 48 h (5.7 ± 2.1 × 10⁻³ %ID vs. 1.4 ± 1.1 × 10⁻³ %ID; p < 0.001). The sham-operated mice showed no focal uptake of the radiolabeled anti-RAGE antibody in the region of the infarct. The mice injected with 99mTc-nonspecific F(ab′)2 after LAD occlusion and reperfusion at 18 to 20 h also showed no focal uptake.
Figure 2. Imaging of RAGE Expression After Reperfusion.
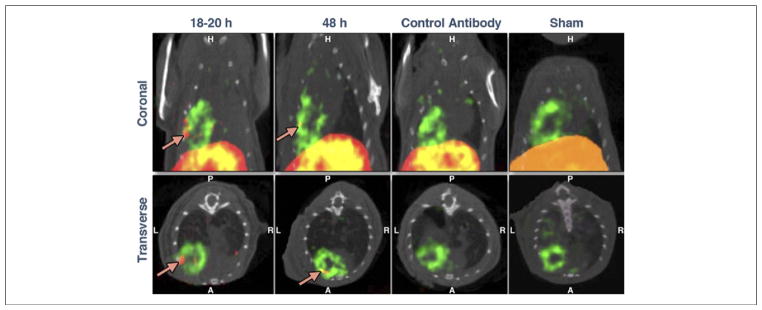
Representative coronal (top panels) and transverse (bottom panels) hybrid SPECT/CT images in mice with 30-min LAD occlusion and injected with 99mTc-labeled anti-RAGE F(ab′)2 and 201Tl at 18 to 20 h or at 48 h or with control nonspecific F(ab′)2 at 18 to 20 h after reperfusion. Uptake of 99mTc is designated by red and uptake of 201Tl by green. When merged, overlapping uptake of the 2 tracers becomes yellow. Uptake of the 99mTc-anti-RAGE F(ab′)2 is seen in the border of the apical defect (arrows) at both time points, although it is shown to be greater at 18 to 20 h after reperfusion. Disease and antibody controls showed no focal tracer uptake in the infarct zone. Abbreviations as in Figure 1.
Gamma well counting
The higher uptake of the 99mTc-anti-RAGE F(ab′)2 in the ischemic zone at 18 to 20 h was confirmed by ex vivo gamma counting. There was a significant difference between myocardial counts from mice injected at 18 to 20 h after reperfusion (1.21 ± 0.41 %ID/g) and mice injected 48 h after reperfusion (0.31 ± 0.08 %ID/g; p = 0.007) (Fig. 3A). Counts from hearts injected with 99mTc-control nonspecific F(ab′)2 (0.14 ± 0.10 %ID/g) were significantly lower (p = 0.02).
Figure 3. Quantitative Myocardial Uptake of 99mTc-anti-RAGE F(ab′)2.

(A) The focal uptake from the scans as a percentage of injected dose (%ID) was significantly greater at 18 to 20 h than at 48 h after reperfusion (p < 0.001). (B) Uptake as %ID from scan correlated significantly with %ID/g from well counting. Error bars represent ± 1 SD. Abbreviations as in Figure 1.
There was a significant correlation between values for %ID/g from the scans (99mTc uptake as μCi divided by the volume of 201TI uptake for ischemic heart slices) versus %ID/g from the well counting of similar sections of heart tissue (r = 0.85; p = 0.007) (Fig. 3B).
Biodistribution of 99mTc-anti-RAGE F(ab′)2 and 99mTc-nonspecific F(ab′)2 in nontarget organs showed highest accumulation in the liver and spleen (Fig. 4).
Figure 4. Bar Graphs of Biodistribution Data.
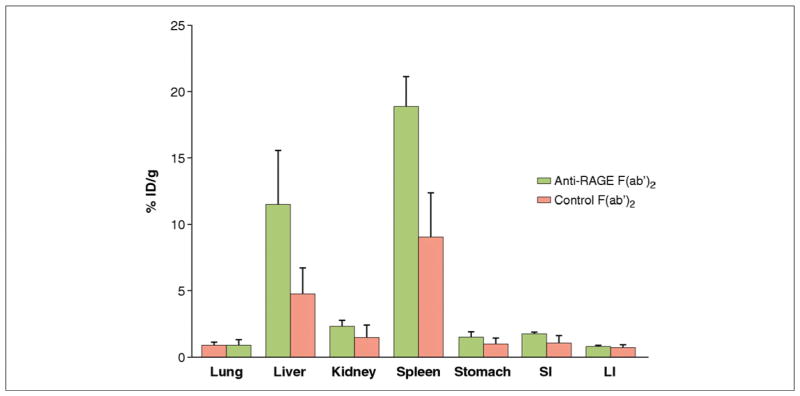
Bar graphs of biodistribution data showing mean percentage of injected dose per gram (%ID/g) in non-target organs of wild-type mice 6 h after tail vein injection of radiolabeled anti-RAGE F(ab′)2 (green bars) or control nonspecific F(ab′)2 (pink bars) at 18 to 20 h after reperfusion. Abbreviations as in Figure 1.
Histochemical analyses
Histology of the hearts showed areas of early infarction in the anterior wall of the LV. Infarct sizes averaged 13.4 ± 2.9% (18- to 20-h group) versus 8.9 ± 2.5% (48-h group, p = 0.01). Immunohistochemical staining of the myocardium showed significantly greater RAGE staining at 18 to 20 h than at 48 h after reperfusion, as shown in representative stained sections from 2 experiments in the left panel of Figure 5. Histological sections through the infarcted myocardium of a mouse injected with dual rhodamine and 99mTc-anti-RAGE F(ab′)2 showed colocalization of fluorescence with RAGE staining in the right panel of Figure 5.
Figure 5. Histological Staining.

Panels on the left show representative stained sections of the infarcted myocardium showing greater RAGE staining at 18 to 20 h (A) than at 48 h (B) after reperfusion. Panels on the right show serial sections through anteroapical infarction in a mouse injected with dual rhodamine and 99mTc-anti-RAGE F(ab′)2. Epifluorescent micrograph of 5-μm-thick paraffin sections of the infarcted myocardium (C) and adjacent section immunostained for RAGE (D). Fluorescence in the myocardium corresponds to localization of RAGE-specific staining in the infarcted myocardium. Abbreviations as in Figure 1.
Quantitative RAGE staining in the 18- to 20-h group was greater than in the 48-h group (12.2 ± 4.9% vs. 7.1 ± 4.3%; p = 0.03), and quantitative caspase staining was also higher at 18 to 20 h than at 48 h after reperfusion (12.3 ± 2.4% vs. 8.4 ± 2.7%; p = 0.01) (Fig. 6).
Figure 6. Quantitative Histochemical Analysis of the Infarcted Myocardial Tissues.
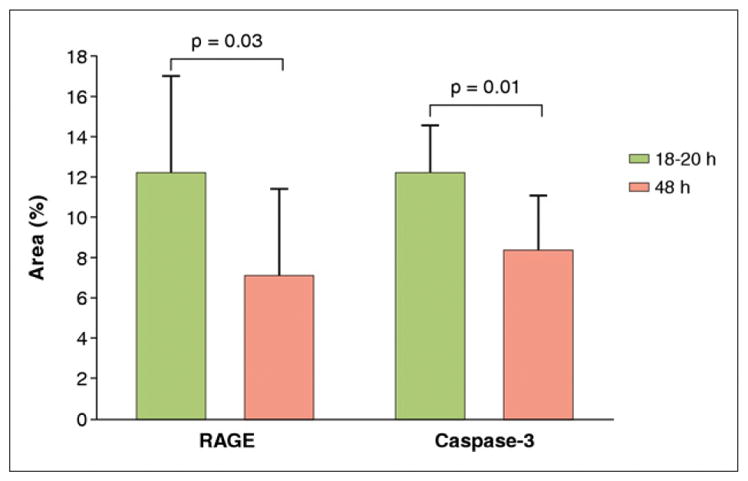
There was significantly higher expression of receptor for advanced glycation end products (RAGE) and caspase-3 at 18 to 20 h vs. 48 h (p = 0.04 and p = 0.01, respectively).
Dual immunofluorescent staining for RAGE-expressing cells in the infarcted myocardium showed colocalization of RAGE predominantly with injured cardiomyocytes undergoing apoptosis (Fig. 7). RAGE colocalization was also seen with leukocytes, endothelial cells, and smooth muscle cells (data not shown).
Figure 7. Representative Dual Immunofluorescent Staining for Cells Expressing RAGE in the Infarcted Myocardium.

Serial sections stained for receptor for advanced glycation end products (RAGE) (anti-RAGE, Texas red) were costained with α-active caspase-3 (apoptotic cells, fluorescein isothiocyanate [FITC]), myeloperoxidase (MPO) (leukocytes, FITC), α-sarcomeric actin (cardiomyocytes, FITC), and α-myosin antibody (myocyte injury, FITC). Counterstaining with 4′,6-diamidino-2-phenylindole (DAPI) (blue) was performed to identify nuclei. Areas in yellow in the merged images represent colocalization. (Magnification ×400).
DISCUSSION
The results of this study demonstrate that RAGE expression in the myocardium subjected to ischemia/reperfusion injury can be imaged and quantified in live animals with a radiolabeled anti-RAGE antibody and SPECT imaging. Immunohistology showed colocalized RAGE expression primarily to cardiomyocytes and activation of apoptotic pathways (caspase staining).
RAGE is a multiligand receptor of the immunoglobulin superfamily of cell surface molecules. RAGE was first identified as a cell surface receptor for the products of nonenzymatic glycation and oxidation of proteins and lipids that form in such settings as diabetes, atherosclerosis, renal failure, aging, and inflammation (2–5). RAGE is expressed on a variety of cells, including monocytes/macrophages, T and B lymphocytes, dendritic cells, endothelial cells, and smooth muscle cells (9,10). We developed a monoclonal antibody (mAb) directed against a unique peptide sequence on the V-domain of the extracellular RAGE receptor using hybridoma technology, have fragmented this mAb, and have labeled with 99mTc for in vivo imaging. Using this radiolabeled antibody, we have shown that RAGE expression in atheroma can be imaged in apolipoprotein E null (apoE−/−) mice and that accelerated atherosclerosis can be detected in diabetic compared with nondiabetic apoE−/− mice (7,8). In this disease model, RAGE staining colocalized mainly to macrophages. There was no uptake of 99mTc-labeled anti-RAGE mAb in RAGE null (RAGE−/−) apoE−/− mice.
The biological responses to myocardial ischemic injury are complex and involve the temporal interplay of inflammatory cells, endothelial cells, cardiomyocytes, and cardiac fibroblasts. The fate of myocardium depends on the length of the ischemic occlusion, free radical generation, paradoxical vaso-constriction caused by endothelial dysfunction, and capillary plugging by neutrophils. Bucciarelli et al. (1,11) performed a series of experiments looking at the effects of global ischemia on generation of RAGE and its ligands in isolated perfused rat and mouse hearts. After 30 min of ischemia, RAGE ligands carboxymethyl-lysine advanced glycation end products (AGEs) increased and corresponded to increases in lactate dehydrogenase, reduction in adenosine triphosphate, and fall in LV function. The presence of AGEs triggers increases in RAGE expression. This damage was reduced in RAGE−/− diabetic hearts and after pre-treatment with soluble RAGE (s-RAGE) (11).
Aleshin et al. (12) studied RAGE expression in a mouse model of regional ischemic injury after 30 min of LAD occlusion and found detectable expression of RAGE by Western blot at 1 h and peak expression of 3-fold at 6 h after reperfusion. In an unpublished work, these investigators found persistent expression of 1.7-fold at 48 h (R. Ramasamy, personal communication, July 2011.). They localized the RAGE expression primarily to cardiomyocytes. To investigate mechanisms for the damaging effects of RAGE, they studied several early signal transduction pathways linked to activation of proapoptotic pathways and to RAGE through glucose flux via the polyol pathway to janus kinase–signal transducer and activator of transcription (13). They found increased levels of phospho–signal transducer and activator of transcription 5 and increased phospho-c-Jun N-terminal kinase (activated c-Jun N-terminal kinase), both known to increase reperfusion injury in non–pre-conditioned hearts (14–16). In further work in cardiomyocytes, they documented that RAGE/ligand interaction also mediates hypoxic injury through the Glycogen synthase kinase–3β pathway (17). Thus up-regulation of RAGE contributes to myocardial cell death through both ischemia and reperfusion injury pathways. Reducing RAGE expression either by knocking out RAGE (RAGE−/− mice) or blocking AGEs with a soluble form of RAGE affected all of these pathways toward a cardioprotection and reduced apoptotic cell death (14–17).
Our results agree with the trends in RAGE expression found by Aleshin et al. (12) and demonstrate the feasibility of in vivo imaging of RAGE expression in the heart in ischemic injury. We detected a larger difference in RAGE expression (approximately a 4-fold) between 18 and 20 h. These differences in magnitude of change may be due to differences in methods of measurement. Western blot is semiquantitative, whereas the radiotracer method is more quantitative. In addition, the radiotracer method will detect RAGE expressed in local circulating inflammatory cells that are washed out by the process of tissue extraction prior to Western blots.
CONCLUSIONS
Implications for clinical applications
This is the first paper to report the feasibility of imaging RAGE expression in myocardial reperfusion injury using a novel 99mTc-anti-RAGE F(ab′)2 probe. This non-invasive approach to quantifying RAGE expression in myocardial ischemic injury in live animals provides a model for testing targeted drug therapy to reduce infarct size. Steps required to develop this antibody for clinical imaging would first require producing chimeric or humanized monoclonal antibodies to reduce immunogenicity. Faster blood pool clearance allowing earlier imaging after injection could be achieved with smaller fragments such as single-chain variable fragment antibodies, but the effect of the smaller agent on uptake at the target (signal to noise) would need to be determined.
Study limitations
If we had injected the radiolabeled anti-RAGE antibody earlier in the course of reperfusion, we may have detected higher levels of RAGE expression based on the experimental studies referenced. We considered this but were limited by the logistics of the model and the relatively slow blood pool clearance rate of the antibody. A limitation of radiolabeled antibodies is liver uptake, as shown in the biodistribution data and on the in vivo scans. A previously published experimental study documented a low expression of RAGE in the livers of C57/BL6 mice (18).
Acknowledgments
This study was supported by National Institute of Health grants no. P01 AG026467 (Dr. Schmidt, principal investigator) and P01 HL60901 (Dr. Schmidt, principal investigator).
The authors thank Dr. Ban-An Khaw for providing the anti-myosin antibody and Geping Zhang for technical assistance.
ABBREVIATIONS AND ACRONYMS
- AGEs
advanced glycation end products
- DTPA
diethylenetriaminepentaacetic acid
- %ID
percentage of injected dose
- FITC
fluorescein isothiocyanate
- LAD
left anterior descending artery
- LV
left ventricle
- mAb
monoclonal antibody
- RAGE
receptor for advanced glycation end products
- ROIs
regions of interest
- SPECT/CT
single-photon emission computed tomography/computed tomography
- 99mTc
technetium-99m
- 201Tl
thallium-201
Footnotes
The authors have reported that they have no relationships relevant to the contents of this paper to disclose.
References
- 1.Bucciarelli LG, Kaneko M, Ananthakrishman A, et al. Receptor for advanced-glycation end products: key modulator of myocardial ischemic injury. Circulation. 2006;113:1226–34. doi: 10.1161/CIRCULATIONAHA.105.575993. [DOI] [PubMed] [Google Scholar]
- 2.Neper M, Schmidt AM, Brett J, et al. Cloning and expression of a cell surface receptor for advanced glycosylation end products of proteins. J Biol Chem. 1992;267:14998–5004. [PubMed] [Google Scholar]
- 3.Schmidt AM, Hasu M, Popov D, et al. The receptor for advanced glycation end products (AGEs) has a central role in vessel wall interactions and gene activation in response to AGEs in the intravascular space. Proc Natl Acad Sci U S A. 1994;91:8807–11. doi: 10.1073/pnas.91.19.8807. [DOI] [PMC free article] [PubMed] [Google Scholar]
- 4.Kislinger T, Fu C, Huber B, et al. N ε-(carboxymethyl)lysine adducts of proteins are ligands for receptor for advanced glycation end products that activate cell signaling pathways and modulate gene expression. J Biol Chem. 1999;44:31740–9. doi: 10.1074/jbc.274.44.31740. [DOI] [PubMed] [Google Scholar]
- 5.Arumugam T, Simeone DM, Schmidt AM, et al. S100P stimulates cell proliferation and survival via receptor for activated glycation end products (RAGE) J Biol Chem. 2004;279:5059–65. doi: 10.1074/jbc.M310124200. [DOI] [PubMed] [Google Scholar]
- 6.Hofmann MA, Drury S, Fu C, et al. RAGE mediates a novel proinflammatory axis: a central cell surface receptor for S100/calgranulin polypeptides. Cell. 1999;97:889–901. doi: 10.1016/s0092-8674(00)80801-6. [DOI] [PubMed] [Google Scholar]
- 7.Tekabe Y, Luma J, Einstein A, et al. A novel monoclonal antibody for RAGE-directed imaging identifies accelerated atherosclerosis in diabetes. J Nucl Med. 2010;51:92–7. doi: 10.2967/jnumed.109.064659. [DOI] [PubMed] [Google Scholar]
- 8.Tekabe Y, Li Q, Rosario R, et al. Development of receptor for advanced glycation end products-directed imaging of atherosclerotic plaque in a murine model of spontaneous atherosclerosis. Circ Cardiovasc Imaging. 2008;1:212–9. doi: 10.1161/CIRCIMAGING.108.788299. [DOI] [PubMed] [Google Scholar]
- 9.Brett J, Schmidt AM, Du Yan S, et al. Survey of the distribution of a newly characterized receptor for advanced glycation end products in tissues. Am J Pathol. 1993;143:1699–722. [PMC free article] [PubMed] [Google Scholar]
- 10.Schmidt AM, Hasu M, Popov D, et al. Receptor for advanced glycation end products (AGEs) has a central role in vessel wall interactions and gene activation in response to AGEs in the intravascular space. Proc Natl Acad Sci U S A. 1994;91:8807–11. doi: 10.1073/pnas.91.19.8807. [DOI] [PMC free article] [PubMed] [Google Scholar]
- 11.Bucciarelli LG, Ananthakrishnan R, Hwang YC, et al. RAGE and modulation of ischemic injury in the diabetic myocardium. Diabetes. 2008;57:1941–51. doi: 10.2337/db07-0326. [DOI] [PMC free article] [PubMed] [Google Scholar]
- 12.Aleshin A, Ananthakrishman R, Li Q, et al. RAGE modulates myocardial injury consequent to LAD infarction via impact on JNK and STAT signaling in a murine model. Am J Physiol Heart Circ Physiol. 2008;294:H1823–32. doi: 10.1152/ajpheart.01210.2007. [DOI] [PubMed] [Google Scholar]
- 13.Hwang YC, Shaw S, Kaneko M, et al. Aldose reductase pathway mediates JAK-STAT signaling: a novel axis in myocardial ischemic injury. FASEB J. 2005;19:795–97. doi: 10.1096/fj.04-2780fje. [DOI] [PubMed] [Google Scholar]
- 14.Jocoby JJ, Kalinowski A, Liu MG, et al. Cardiomyocyte-restricted knockout of STAT3 results in higher sensitivity to inflammation, cardiac fibrosis, and heart failure with advanced age. Proc Natl Acad Sci U S A. 2003;100:12929–34. doi: 10.1073/pnas.2134694100. [DOI] [PMC free article] [PubMed] [Google Scholar]
- 15.Kaiser RA, Liang Q, Bueno OF, et al. Genetic inhibition or activation of JNK1/2 each protect the myocardium from ischemia-reperfusion-induced cell death in vivo. J Biol Chem. 2005;23:32602–8. doi: 10.1074/jbc.M500684200. [DOI] [PubMed] [Google Scholar]
- 16.Mascareno E, El-Shafei M, Maulik N, et al. JAK/STAT signaling is associated with cardiac dysfunction during ischemia and reperfusion. Circulation. 2001;104:325–9. doi: 10.1161/01.cir.104.3.325. [DOI] [PubMed] [Google Scholar]
- 17.Shang L, Ananthakrishnan R, Li Q, et al. RAGE modulates hypoxia/regeneration injury in adult murine cardiomyocytes via JNK and GSK-3β signaling pathways. PLoS ONE. 2010;5:e10092. doi: 10.1371/journal.pone.0010092. [DOI] [PMC free article] [PubMed] [Google Scholar]
- 18.Zeng S, Feirt N, Goldstein M, et al. Blockade of receptor for advanced glycation end product (RAGE) attenuates ischemia and reperfusion injury in the liver in mice. Hepatology. 2004;39:422–432. doi: 10.1002/hep.20045. [DOI] [PubMed] [Google Scholar]