Abstract
High performance liquid chromatography (HPLC) and flow injection electrospray ionization with ion trap mass spectrometry (FIMS) fingerprints combined with the principal component analysis (PCA) were examined for their potential in differentiating commercial organic and conventional sage samples. The individual components in the sage samples were also characterized with an ultra-performance liquid chromatography with a quadrupole-time of flight mass spectrometer (UPLC Q-TOF MS). The results suggested that both HPLC and FIMS fingerprints combined with PCA could differentiate organic and conventional sage samples effectively. FIMS may serve as a quick test capable of distinguishing organic and conventional sages in 1 min, and could potentially be developed for high-throughput applications; whereas HPLC fingerprints could provide more chemical composition information with a longer analytical time.
Keywords: UPLC fingerprint, flow injection, mass spectral fingerprint, principal component analysis, sage (Salvia officinalis), rosmarinic acid
INTRODUCTION
The organic food market has been rapidly growing in the recent years in the United States. A survey from the Organic Trade Association illustrated that the total amount of the US organic industry was over $29 billion in 2010, with more than 10% average annual growth in the past eight years.1 Organic foods are generally marketed at much higher prices than their conventional counterparts due to consumer preference. A few previous studies also indicated that botanicals grown under organic and conventional conditions may differ in their chemical compositions and their nutritional values or health properties.2–3 For instance, the urinary concentration of quercetin and kaempferol was greater in human subjects after taking organically produced foods for 22 days than that who had conventionally produced products.2 Novel analytical tools are needed to differentiate organic and conventional foods to prevent intentional adulterations.
Sage (Salvia offcinalis) is a common spice and food flavoring agent. Sage extracts have been reported for several health beneficial effects, including antioxidant capacity,4–6 antitumorigenic activity,5 improving Alzheimer’s disease conditions,7–9 and anti-inflammatory properties.7 Carnosol, carnosic acid and rosmanol were considered as the important bioactive substances in sage samples.5 In addition to the primary diterpene phenols, other phenolics such as flavonoids and phenolic acid derivatives might also play important roles in their health properties such as the antioxidant and antitumorigenic activities.5 Differentiation of conventional and organic sages is important, as both are commercially available and differ significantly in their prices.
Recently, our laboratory has evaluated potential analytical approaches for adulteration detection for years.3, 10–11 In 2011, HPLC fingerprinting technique was successfully applied in differentiating di- and tetraploid Jiaogulan (Gynostemma pentaphyllum) botanical samples.10 In 2012, conventional and organic grown peppermints were differentiated using both HPLC and FIMS finger printing techniques combined with principal component analysis.3 The result indicated that FIMS fingerprints rapidly differentiated organic and conventional peppermints in a shorter-time, whereas HPLC fingerprints provided more detail information about the chemical composition. This study was conducted to further test the hypothesis that HPLC-UV chromatographic and flow-injection mass spectrometric (FIMS) fingerprints combined with the principal component analysis (PCA) could potentially differentiate commercial organic and conventional sages.
MATERIALS AND METHODS
Standard Compounds and Other Chemicals
LC-MS grade water and acetonitrile were purchased from Fisher Scientific (Pittsburgh, PA, USA). LC-MS grade formic acid was purchased from Sigma/Aldrich (St.Louis, MO, USA).
Plant Materials and Sample Preparation
Ten commercial USDA certified organic and ten conventional sage leaf samples were gifts from Frontier Natural Products Co-op (Norway, IA, USA). Dry sage samples were ground to 20 mesh particle sizes using an IKA A11 analytical grinder (IKA, Staufen, Baden-Württemberg, Germany), and stored at −20 °C before analysis. 100 mg of each sage powder was accurately weighed and extracted with 10 mL H2O-MeOH (1:1, v:v) with ultrasonication at ambient temperature for 30 min. The extracts were filtered through a 0.45 Om Nylon syringe filter (Alltech Associates, Deerfield, IL, USA) and subjected to HPLC and FIMS fingerprinting analyses. Each sample was analyzed in duplicate for HPLC and triplicate for FIMS fingerprints.
HPLC-UV and IT-MS Conditions
Both HPLC-UV and IT-MS conditions were selected according to our previous study.3 Briefly, an Agilent 1100 HPLC system was used for HPLC fingerprinting (Agilent Technologies, Palo Alto, CA, USA) and connected with a LCQ Deca ion-trap mass spectrometer for FIMS (Agilent Technologies, Palo Alto, CA, USA). Electrospray ionization (ESI) in negative ion mode was utilized.
A Waters symmetry C18 column (2.1 mm i.d. × 150 mm, 3.5 µm) (Waters, Milford, MA, USA) was used for HPLC-UV fingerprinting, mobile phase A consisted of 0.1% formic acid in H2O and mobile phase B consisted of 0.1% formic acid in acetonitrile. The elution began with 20% phase B; changed linearly to 50% B in 20 min, increased linearly to 95% B at 35 min and washed at this ratio for 5 min. After washing, the mobile phase was returned to its initial conditions for 5 min to re-equilibrate the column for the next injection. The flow rate was 0.2 mL/min, with an injection volume of 10 µL and a detection wavelength of 280 nm.
For FIMS analysis, no analytical column but a two-way valve was used to minimize potential contamination in the MS system. The mobile phase A had 0.1% formic acid in H2O (v/v) and mobile phase B contented 0.1% formic acid in acetonitrile (v/v) with an isocratic elution at a ratio of phase A to phase B at 60:40 (v/v) and a flow rate of 0.5 mL/min. Sage extractions were diluted 10 times with water and the injection volume was 2 µL. MS spectra were collected from 0.05 to 0.55 min and the mass range was from 150 to 1000 m/z, with asheath gas flow rate of 80 L/min, aux gas flow rate of 10 L/min, spray voltage at 4.5 kV; heated capillary temperature at 250 °C, capillary voltage of −4.0 V, and tube lens offset at 20 V. Triplicate analyses of 20 different sage samples provided 60 MS spectra.
UPLC Q-TOF MS Condition
An UPLC-Q-TOF MS system (Waters, Milford, MA, USA) was used for identification of major peaks in the sage extraction. The accurate mass weight was used combined with reference5, 12 and chemical database to identified the components in sage. UPLC-Q-TOF MS condition was selected according to a previous study except the negative ion mode in ESI source.3 In brief, a BEH C18 column (2.1 mm i.d. × 100 mm, 1.7µm) (Waters, Milford, MA, USA) was used at 40 °C. UPLC conditions were the same as that for HPLC fingerprint. The MS conditions were: capillary voltage 3.00 kV; sampling cone voltage 30 V; extraction cone voltage 4.0 V; source temperature 120 °C; and desolvation temperature 450 °C. The cone gas flow rate was 50 L/h and the desolvation gas flow was 800 L/h. A MSE method (a scan model to get full information for both parent ion and daughter ion in one injection using tandem mass spectrometry) was used with mass range from 100 to 1000 m/z, and the ramp collision energy was selected from 25 V to 35 V. MassLynx 4.1 software (Waters, Milford, MA, USA) was used for alignment of peaks and accurate mass weight identification.
Data Processing
Eighteen major chromatographic peaks were selected in the UPLC fingerprints in both conventional and organic sages. Their absolute and relative peak areas were both selected for principal component analysis (PCA). For absolute peak area, eighteen peak areas in all the chromatograms were analyzed with PCA directly. For relative peak area analyses, the largest peak area (peak 8) in every chromatogram was selected as reference peak, and other peak areas were divided to reference peak in each chromatogram to become the relative peak areas. Peaks which areas larger than 5% of the reference peak area were included. For FIMS fingerprints, one-dimensional spectra ranged from m/z 150 to 1000 were collected for analysis. Data were imported to Excel (Microsoft, Inc., Belleview, WA, USA) for data pre-processing. Sixty spectra (triplicate analyses for 20 samples) were sorted by sample names and fill every missing m/z with zero in the mass list so that the data points of each mass spectrum were aligned and then for PCA. PCA was performed using the SIMCA-P software (Umetrics, Malmo, Skånelän, Sweden) to analyze the absolute areas of the 18 peaks in all the 40 chromatograms (20 samples with duplicate analyses each) collected at 280 nm.3 PCA analysis was also performed for relative peak areas, which was calculated using the largest peak area (peak 8) as the reference peak. A one-dimensional FIMS fingerprints obtained at m/z 150–1000 were reorganized in Excel (Microsoft, Inc., Belleview, WA, USA) and analyzed using the SIMCA-P software.
RESULTS AND DISCUSSION
Chromatographic and MS Fingerprints
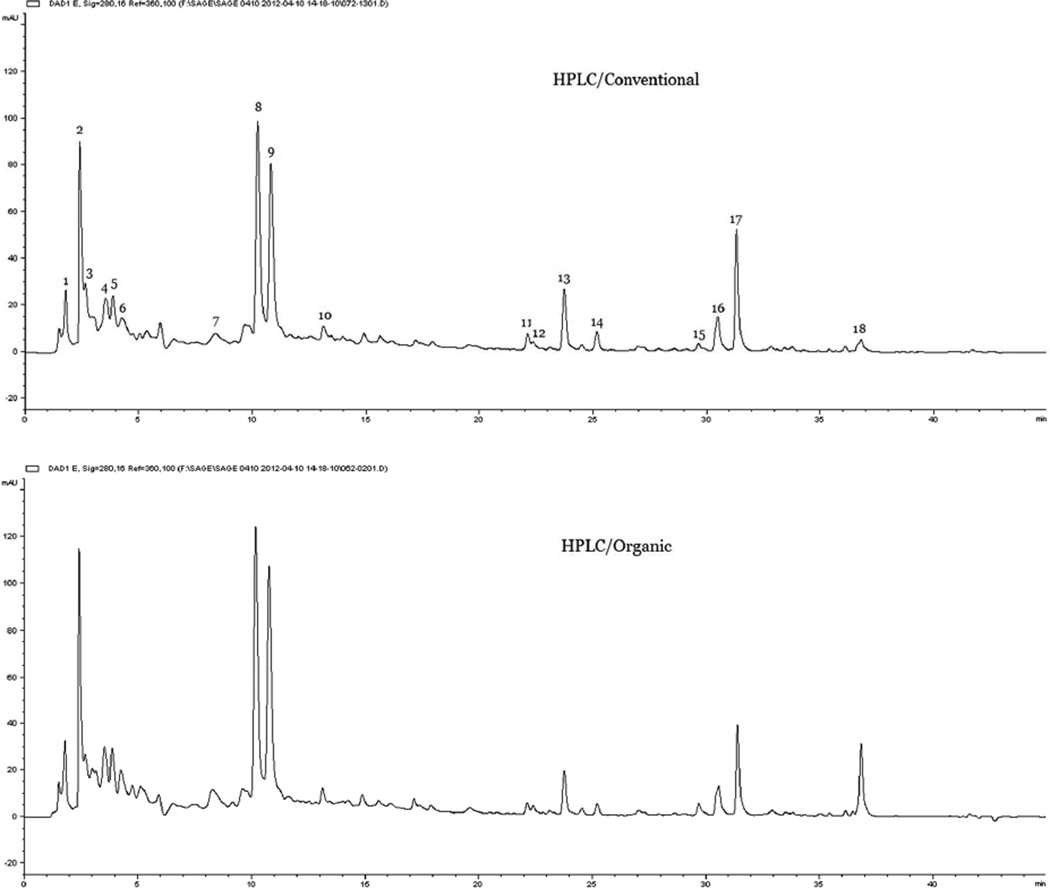
As shown in Figure 1, the organic sage had similar peak numbers and areas as that in their conventional counterparts under the experimental conditions, except that the relative area of peak 18 seemed larger in the organic samples than that in the conventional ones. These results indicated that organic and conventional sage samples were similar and could not be effectively differentiated by direct visual judgment of the HPLC-UV fingerprints. A further UPLC-Q-TOF high resolution mass spectrum analysis was able to characterize 16 individual compounds in sage, including luteolin-diglucuronide isomer I, luteolin-diglucuronide isomer II saponarin, eriocitrin, luteolin-7-O-glucuronide, rosmarinic acid, salvianolic acid K, luteolin-rutinoside, salvianolic F, rosmanol isomer I, rosmanol, rosmanol isomer II, carnosic acid, rosmarinic acid isomer, carnosol and epirosmanol, which corresponded to the peaks No. 2, 3, 4, 5, 6, 8, and 9–18, respectively (Table 1). The compounds were identified by comparing the accurate mass of each peak to that in the chemical database and references.
Figure 1.
Representative HPLC fingerprints for conventionally and organically grown sage samples.
Table 1.
Identification of major peaks in the sage samples a
| Peak number | Compound | RT | Measured mass weight [M-H]− |
Calculated mass weight [M-H]− |
|---|---|---|---|---|
| 1 | unknown | 1.79 | nd | |
| 2 | Luteolin-diglucuronide isomer I | 2.39 | 637.0942 | 637.1041 |
| 3 | Luteolin-diglucuronide isomer II | 2.67 | 637.0942 | 637.1041 |
| 4 | Saponarin | 3.52 | 593.1507 | 593.1507 |
| 5 | Eriocitrin | 3.85 | 595.1663 | 595.1663 |
| 6 | Luteolin-7-O-glucuronide | 4.26 | 461.0751 | 461.0720 |
| 7 | unknown | 8.27 | nd | |
| 8 | Rosmarinic acid | 10.17 | 359.0844 | 359.0767 |
| 9 | Salvianolic acid K | 10.75 | 555.1100 | 555.1139 |
| 10 | Luteolin-rutinoside | 13.10 | 593.1507 | 593.1507 |
| 11 | Salvianolic F | 22.11 | 313.0743 | 313.0712 |
| 12 | Rosmanol isomer I | 22.37 | 345.1720 | 345.1702 |
| 13 | Rosmanol | 23.75 | 345.1718 | 345.1702 |
| 14 | Rosmanol isomer II | 25.19 | 345.1718 | 345.1702 |
| 15 | Carnosic acid | 29.67 | 331.1945 | 331.1909 |
| 16 | Rosmarinic acid isomer | 30.57 | 359.0844 | 359.0767 |
| 17 | Carnosol | 31.38 | 329.2020 | 329.2053 |
| 18 | Epirosmanol | 36.82 | 345.1760 | 345.1702 |
Date was collected using a Waters UPLC-Q-TOF MS system.
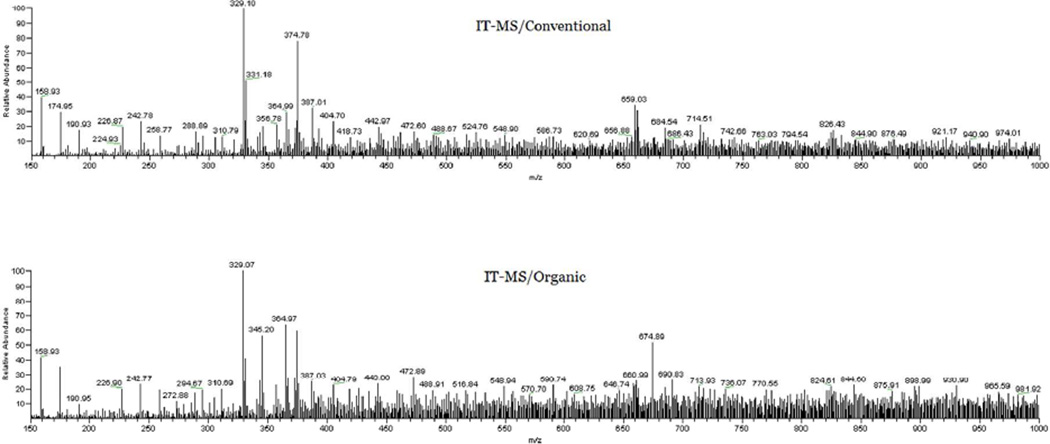
Typical FIMS fingerprints for the conventional and organic sages are showed in Figure 2. Visually difference may be noticed between the conventional and organic sage mass spectra. In the spectrum of the conventional sage, m/z 329 for carnosol was the most abundant peak, followed by m/z 374 and m/z 331 (carnosic acid). In contrast, m/z 364 and m/z 345 (rosmanol) were the second biggest peak in the organic sage, and the peak at m/z 329 (carnosol) had the biggest ion count.
Figure 2.
MS fingerprinting for IT-MS for conventionally and organically grown sage samples.
Principle Component Analysis (PCA) of Chromatographic Fingerprints
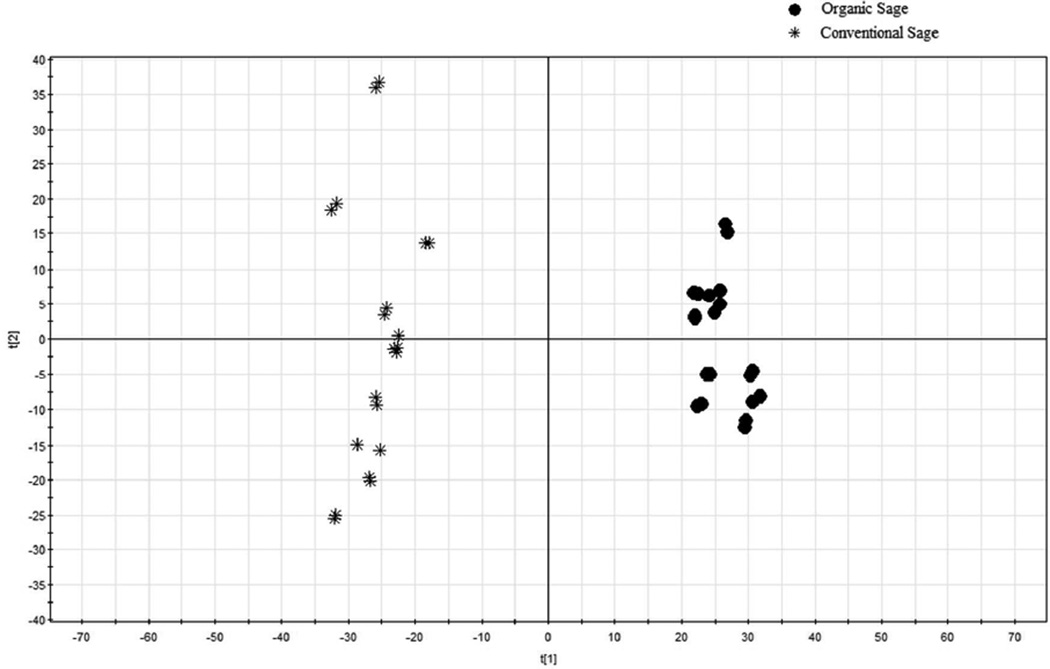
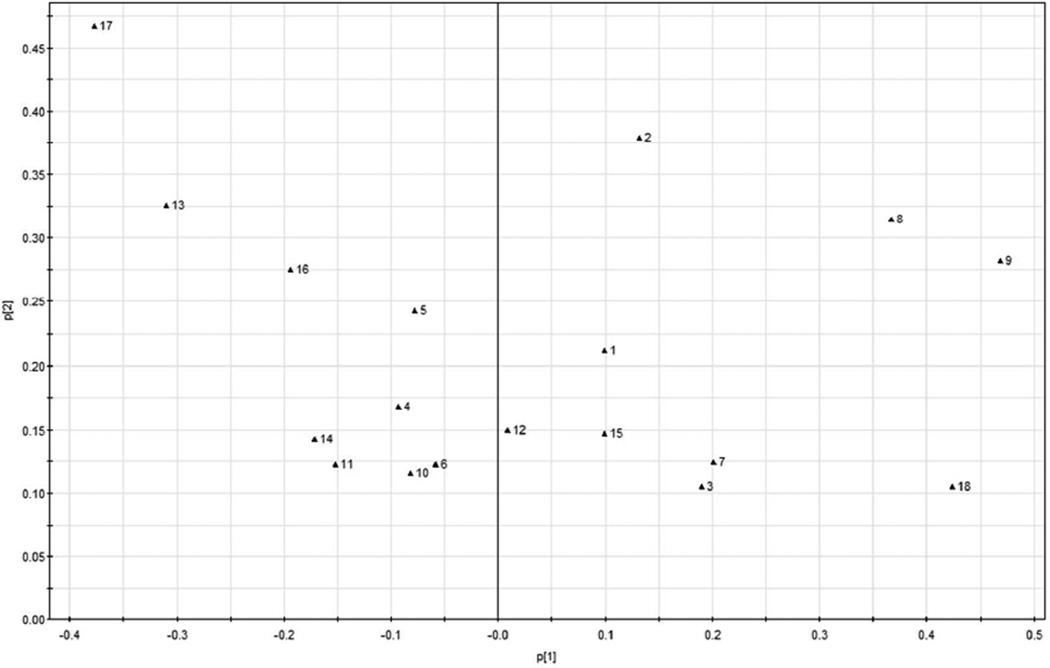
The PCA scores plot for the absolute chromatographic peak areas is provided in Figure 3, and the corresponding loading plot is shown in Figure 4. The conventional sage samples are all on the left of the PCA scores plot, while all organic samples are located on the right side (Figure 3). PCA is a mathematical approach that transforming a large number of related variables into a small group of unrelated variables, the principle components (PCs). PCA of fingerprints visualized the results and made the comparison of the chromatographic fingerprints easier without subjective decisions.
Figure 3.
PCA scores plot for HPLC absolute peak areas of the organic and conventional sage samples.
Figure 4.
PCA loading plot for HPLC absolute peak areas of the organic and conventional sage samples.
In the loading plot of the UPLC absolute peak areas (Figure 4), peaks 9 (salvianolic acid K), 8 (rosmarinic acid), and 18 (epirosmanol) contributed significantly to the separation of organic samples from their conventional counterparts, while peaks17 (carnosol), 13(rosmanol) and 16 (rosmarinic acid isomer) contributed significantly to the separation of conventional sage samples. Taking the HPLC chromatographic fingerprint (Figure 1) and PCA loading plot (Figure 4) into account, the organic sage samples contained greater levels of salvianolic acid K, rosmarinic acid and epirosmanol, whereas the conventional sage samples contained more carnosol, rosmanol and rosmarinic acid isomer.
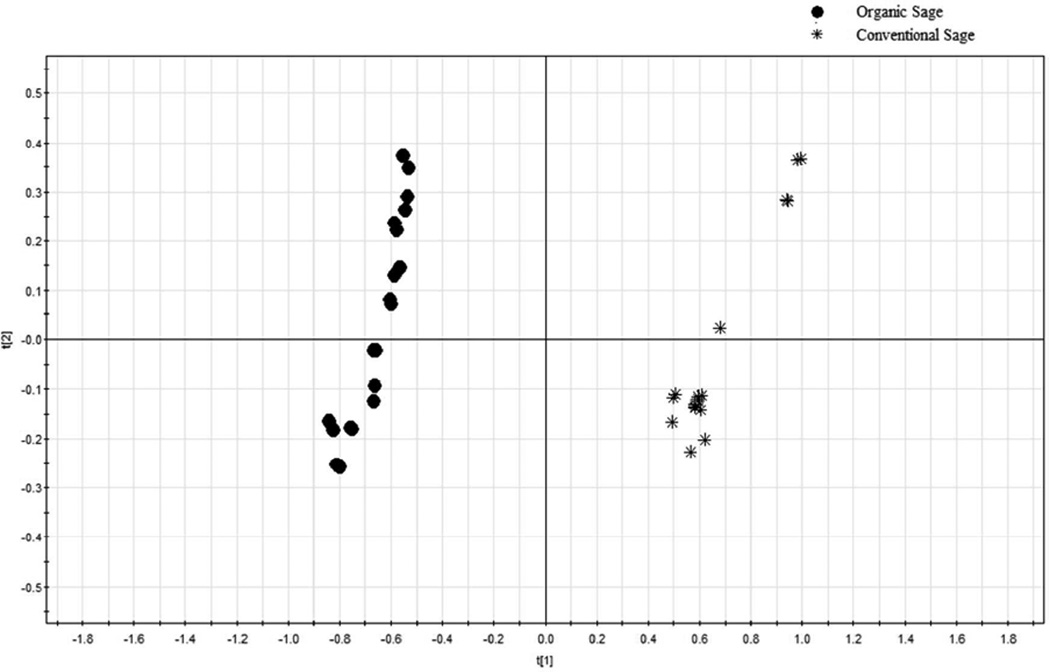
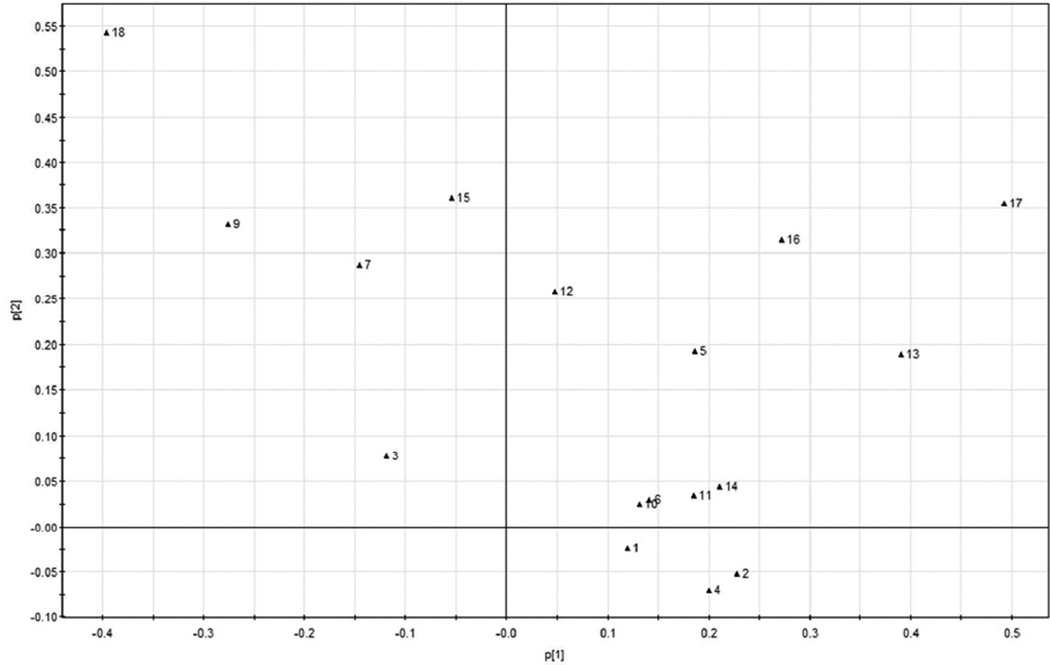
Figures 5 and 6 show the PCA scores plot and loading plot of the relative chromatographic peak areas for the organic and the conventional sages. In all the 18 peaks, peak No. 8 was the biggest peak and was selected as the reference peak (RP) for calculating the relative peak areas. Other major peaks were defined as at least 5% of the area of RP. In Figure 5, the organic sage samples were clustered tightly on the left side of the scores plot, while the conventional sage samples were all in the right side of the scores plot. The similar trend of scatter plot between the organic and conventional sage samples indicated that sage samples had relatively uniform chemical profiles regardless of their farming practice. In the loading plot of the HPLC relative peak areas (Figure 6), peaks 18 and 9 were on the left side of loading scatter plot, indicating that the relative areas of these two peaks were greater in the organicsage samples, and peaks 17, 13, and 16 were greater in the conventional sage samples. Since peak 8 was the RP, the results indicated that the peak areas of RP were greater in the organic samples, suggesting that the level of rosmarinic acid, salvianolic acid K, rosmanol and carnosol may be important for determining if a sage was organically or conventionally produced according to its HPLC chromatographic fingerprints.
Figure 5.
PCA scores plot for HPLC relative peak areas of the organic and conventional sage samples. All peak areas were divided by the area of peak No. 8 in the sample, and the results were used for PCA.
Figure 6.
PCA loading plot for relative peak areas of the organic and conventional sage samples. All peak areas were divided by the area of peak No.8 in each sample, and the results were used for PCA.
PCA Analysis of FIMS Fingerprints
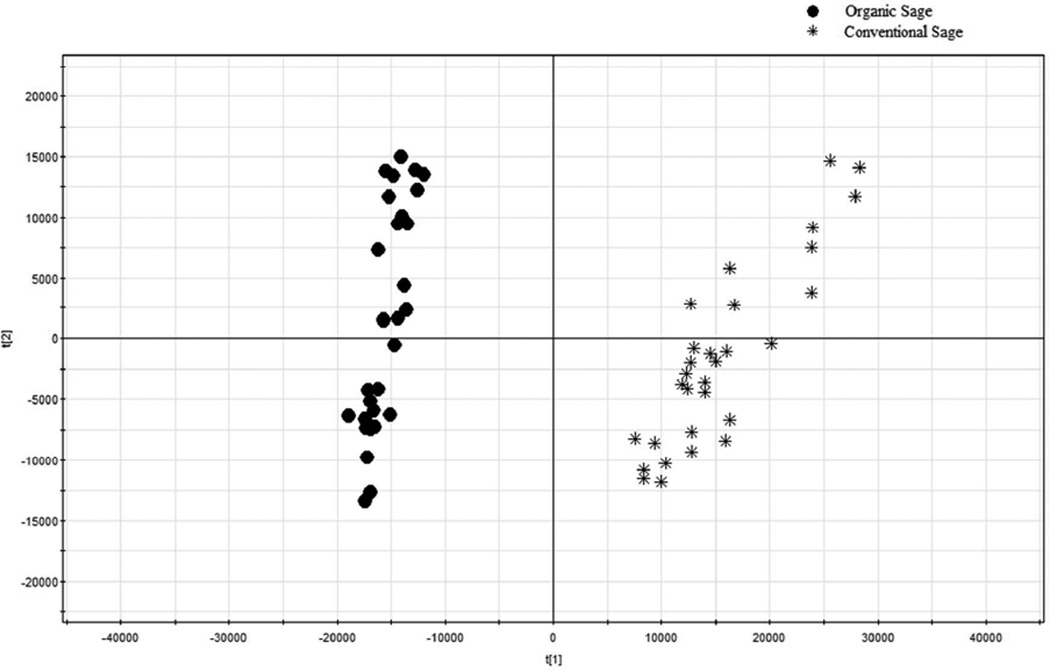
The FIMS PCA score and loading plots are shown in Figures 7 and 8, respectively. In the PCA score plot, all the organic sage samples were on the left side, whereas the conventional sage samples were on the right side (Figure 7). The organic and conventional sages were separated completely by PC1. The scores plot indicated that the FIMS fingerprinting technique could effectively differentiate commercial conventional and organic sages in 1 minute.
Figure 7.
PCA scores plot for IT-MS fingerprints of the organic and conventional sage samples.
Figure 8.
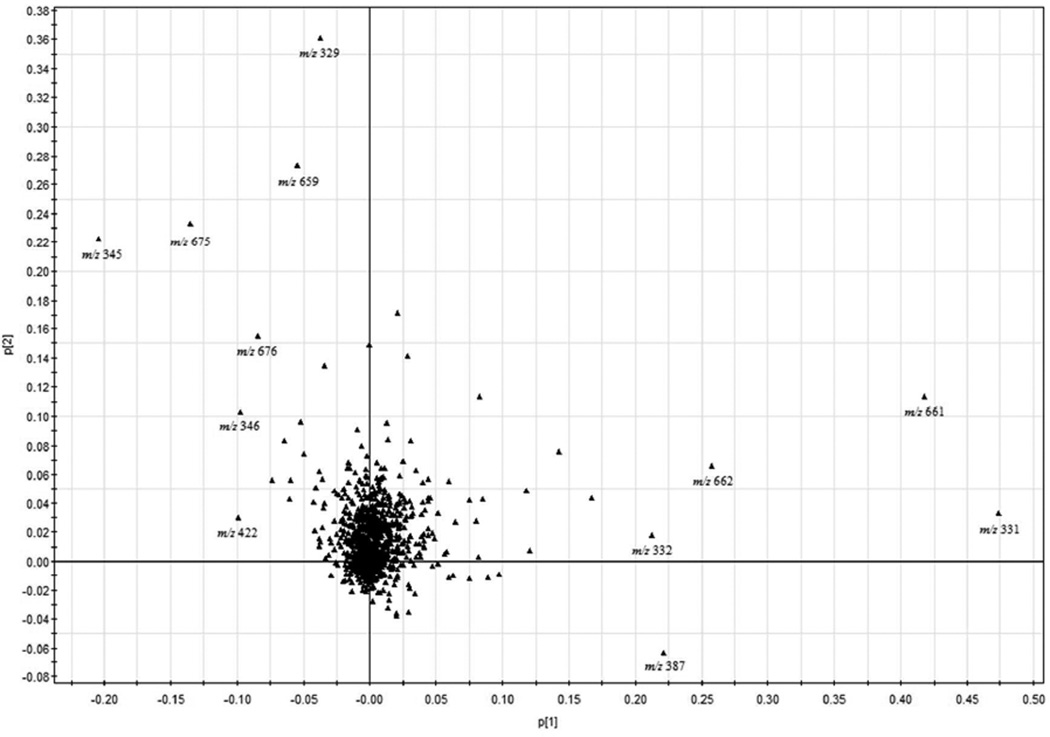
PCA loading plot for IT-MS fingerprints of the organic and conventional sage samples.
In the loading plot of FIMS fingerprints, most of the ions were clustered near the origin (Figure 8). However, a few ions dispersed far away from the central, and these ions and their levels weighted more in determining the farming practices of sage. In the upper left corner, ions m/z 329, 659, 675 and 345 together with their isomer peaks m/z 676 and 346 yielded a higher score and would lead to positions to the left side of PCA score plot. The most intensive ion contributing to high scores was m/z 345 [M-H]−, the molecular ion for rosmanol with a formula weight of 346. Another high score ion was m/z 329 [M-H] −, the molecular ion for carnosol with a molecular weight of 330.
The most noticeable ions that contributed positively to conventional sage were ions at m/z 331 and 661 together with their isomer peaks at m/z 662 and 332, respectively. The ion at m/z 331 [M-H]− was identified as the molecular ion for carnosic acid with a molecular weight of 332. The other ion that also contributed positively to conventional sage samples was the ion at m/z 387. The scores of these ions indicated that these compounds contributed most in differentiating organic and conventional sage samples. The PCA analysis of the FIMS fingerprints indicated that the three major diterpene phenols, including rosmanol, carnosol and carnosic acid, were important in distinguishing organic and conventional sage samples. Rosmanol (r = −0.854, P < 0.05) and carnosol (r = 0.911, P < 0.05) contributed more to organically grown sage, whereas carnosic acid (r = 0.819, P < 0.05) contributed more to conventional grown sage. Carnosol, rosmanol and carnosic acid are also considerate as the most important bioactive substances in sage. 5 During our study, carnosol and rosmanol contributed more to conventional sage samples in LC fingerprint. In MS flow injection fingerprint, however, carnosic acid contributed more to conventional sage, whereas carnosol and rosmanol contributed more to organic sage samples. These three major substances could be monitored to predict sage growing conditions.
In summary, PCA of either HPLC or FIMS fingerprint have potential in differentiating commercial organic and conventional botanical samples. FIMS fingerprinting may provide a rapid answer and has potential for high-throughput applications, whereas HPLC fingerprints may obtain more chemical composition information about the samples and take longer analytical time.
ACKNOWLEDGEMENT
This research was partially supported by SJTU 985-III disciplines platform and talent fund (Grant No. TS0414115001; TS0320215001), and a special fund for Agro-scientific Research in the Public Interest (Grant No. 201203069).This research is also supported by the Agricultural Research Service of the United States Department of Agriculture and an Interagency Agreement with the Office of Dietary Supplements of the National Institutes of Health.
REFERENCES
- 1.Organic Trade Association. The organic trade association’s 2011 organic industry survey. 2012 Jul 17; Website: http://www.ota.com/pics/documents/2011OrganicIndustrySurvey.pdf.
- 2.Grinder-Pedersen L, Rasmussen SE, Bugel S, Jorgensen LV, Dragsted LO, Gundersen V, Sandstrom B. Effect of diets based on foods from conventional versus organic production on intake and excretion of flavonoids and markers of antioxidative defense in humans. J. Agric. Food Chem. 2003;51:5671–5676. doi: 10.1021/jf030217n. [DOI] [PubMed] [Google Scholar]
- 3.Gao B, Lu Y, Qin F, Chen P, Shi H, Charles D, Yu L. Differentiating organic from conventional peppermints using chromatographic and flow-injection mass spectrometric (FIMS) fingerprints. J. Agric. Food Chem. 2012;60:11987–11994. doi: 10.1021/jf303415d. [DOI] [PMC free article] [PubMed] [Google Scholar]
- 4.Lu Y, Foo LY. Antioxidant activities of polyphenols from sage (Salvia officinalis) Food Chem. 2001;75:197–202. [Google Scholar]
- 5.Ho C, Wang M, Wei G, Huang T, Huang M. Chemistry and antioxidative factors in rosemary and sage. Bio Factors. 2000;13:161–166. doi: 10.1002/biof.5520130126. [DOI] [PubMed] [Google Scholar]
- 6.Cuvelier ME, Richard H, Berset C. Antioxidant activity and phenolic composition of pilot-plant and commercial extracts of sage and rosemary. J. Am. Oil Chem. Soc. 1996;73:645–652. [Google Scholar]
- 7.Howes MJR, Perry NSL, Houghton PJ. Plants with traditional uses and activities, relevant to the management of Alzheimer's disease and other cognitive disorders. Phytother Res. 2003;17:1–18. doi: 10.1002/ptr.1280. [DOI] [PubMed] [Google Scholar]
- 8.Perry EK, Pickering AT, Wang W, Houghton P, Perry NSL. Medicinal plants and Alzheimer's disease: integrating ethnobotanical 244 and contemporary scientific evidence. J. Altern. Complem. Med. 1998;4:419–428. doi: 10.1089/acm.1998.4.419. [DOI] [PubMed] [Google Scholar]
- 9.Perry NSL, Houghton PJ, Sampson J, Theobald AE, Hart S, Lis-Balchin M, Hoult JRS, Evans P, Jenner P, Milligan S, Perry EK. In-vitro activity of S. lavandulaefolia (Spanish sage) relevant to treatment of Alzheimer's disease. J.Pharm. Pharmacol. 2001;53:1347–1356. doi: 10.1211/0022357011777846. [DOI] [PubMed] [Google Scholar]
- 10.Xie Z, Zhao Y, Chen P, Jing P, Yue J, Yu L. Chromatographic fingerprint analysis and rutin and quercetin compositions in the leaf and whole-plant samples of di- and tetraploid Gynostemma pentaphyllum. J. Agric. Food Chem. 2011;59:3042–3049. doi: 10.1021/jf104329v. [DOI] [PubMed] [Google Scholar]
- 11.Zhao Y, Xie Z, Niu Y, Shi H, Chen P, Yu L. Chemical compositions, UPLC/MS fingerprinting profiles and radical scavenging properties of commercial Gynostemma pentaphyllum (Thunb.) Makino samples. Food Chem. 2012;134:180–188. [Google Scholar]
- 12.Benno FZ, Stephan GW, Laura NT, Wolf S, Drik WL. Rapid UHPLC determination of polyphenols in aqueous infusions of Salvia officinalis L. (sage tea) J. Chromatogr. B. 2011;879:2459–2464. doi: 10.1016/j.jchromb.2011.06.038. [DOI] [PubMed] [Google Scholar]


