Abstract
Metabolomic screening of fasting plasma from nondiabetic subjects identified α-hydroxybutyrate (α-HB) and linoleoyl-glycerophosphocholine (L-GPC) as joint markers of insulin resistance (IR) and glucose intolerance. To test the predictivity of α-HB and L-GPC for incident dysglycemia, α-HB and L-GPC measurements were obtained in two observational cohorts, comprising 1,261 nondiabetic participants from the Relationship between Insulin Sensitivity and Cardiovascular Disease (RISC) study and 2,580 from the Botnia Prospective Study, with 3-year and 9.5-year follow-up data, respectively. In both cohorts, α-HB was a positive correlate and L-GPC a negative correlate of insulin sensitivity, with α-HB reciprocally related to indices of β-cell function derived from the oral glucose tolerance test (OGTT). In follow-up, α-HB was a positive predictor (adjusted odds ratios 1.25 [95% CI 1.00–1.60] and 1.26 [1.07–1.48], respectively, for each standard deviation of predictor), and L-GPC was a negative predictor (0.64 [0.48–0.85] and 0.67 [0.54–0.84]) of dysglycemia (RISC) or type 2 diabetes (Botnia), independent of familial diabetes, sex, age, BMI, and fasting glucose. Corresponding areas under the receiver operating characteristic curve were 0.791 (RISC) and 0.783 (Botnia), similar in accuracy when substituting α-HB and L-GPC with 2-h OGTT glucose concentrations. When their activity was examined, α-HB inhibited and L-GPC stimulated glucose-induced insulin release in INS-1e cells. α-HB and L-GPC are independent predictors of worsening glucose tolerance, physiologically consistent with a joint signature of IR and β-cell dysfunction.
There is increasing interest in identifying markers of chronic diseases. A useful biomarker is a molecule that 1) is easily and specifically measurable in accessible body fluids, 2) improves prediction algorithms, 3) tracks an underlying pathophysiological mechanism, 4) changes consensually with the mechanism, and possibly, 5) maps onto a new disease pathway. This search hopes not only to provide a more accurate prediction of disease but also follow its evolution and response to intervention and expose new potential therapeutic targets.
Recent studies have used different extents of metabolomic profiling to uncover metabolic signatures of obesity (1–3), fatty liver disease (4), and type 2 diabetes (T2D) (5). In previous work (6), we screened several hundred metabolites to identify novel circulating biomarkers of insulin resistance (IR)—as measured by the euglycemic clamp technique—in selected subjects in the Relationship between Insulin Sensitivity and Cardiovascular Disease (RISC) study, a cohort of well-phenotyped nondiabetic individuals. The top biomarker of IR emerging from this analysis was a previously unrecognized metabolite identified as α-hydroxybutyrate (α-HB), an organic acid positioned at an interesting crossroad of intermediary metabolism—amino acid catabolism and glutathione synthesis—and upstream to the tricarboxylic acid (TCA) cycle. The next top-ranking biomarker was linoleoyl-glycerophosphocholine (L-GPC), an independent correlate of insulin sensitivity and a putative lipid-signaling molecule.
Because these biomarkers of insulin sensitivity were independently associated with glucose intolerance (6) and IR is a risk factor for T2D (7), we carried out a clinically validated assay of these metabolites in the entire RISC cohort at baseline and follow-up to evaluate their predictivity of incident dysglycemia. Furthermore, because these biomarkers have not been previously evaluated in clinical outcome studies, we tested their ability to predict T2D in a long-term observational cohort of at-risk subjects in the Botnia Prospective Study. Finally, we initiated additional in vivo and in vitro studies to gain understanding of the physiological basis for these associations.
RESEARCH DESIGN AND METHODS
Study cohorts.
The RISC study is a prospective, observational cohort study (n = 1,308) for which rationale and methodology have been published (8). In brief, participants were recruited from people attending clinic and from laboratory personnel at 19 centers in 13 countries in Europe, according to the following inclusion criteria: men or women, aged between 30 and 60 years (stratified by sex and age according to 10-year age groups), and clinically healthy. Initial exclusion criteria were treatment for obesity, hypertension, lipid disorders or diabetes, pregnancy, cardiovascular or chronic lung disease, weight change of ≥5 kg in last 6 months, cancer (in last 5 years), and renal failure. Exclusion criteria after screening were arterial blood pressure ≥140/90 mmHg, fasting plasma glucose ≥7.0 mmol/L, 2-h plasma glucose (on a standard, 75-g oral glucose tolerance test [OGTT], performed in each subject) ≥11.0 mmol/L or known diabetes, total serum cholesterol ≥7.8 mmol/L, serum triglycerides ≥4.6 mmol/L, and electrocardiogram abnormalities. Baseline examinations began in June 2002 and were completed in July 2005 and included 1,538 subjects receiving an OGTT. Of these, 1,308 also received a euglycemic hyperinsulinemic clamp and constituted the baseline cohort; cross-sectional data on this cohort have been published (8).
All subjects of the baseline cohort were recalled 3 years later, and 1,048 (80%) participated in the follow-up evaluation (8–10). The baseline anthropometric and metabolic characteristics of the 260 subjects who were lost to follow up were very similar to those of the subjects who participated (data not shown). The follow-up study included all the baseline anthropometric measurements and the OGTT. Fasting plasma samples were also obtained from 47 T2D patients (14 men, 33 women; age, 56 ± 7 years; BMI, 29.9 ± 4.2 kg/m2; HbA1c, 7.4 ± 0.8%; fasting glucose, 9.3 ± 1.9 mmol/L) after 4 weeks of oral hypoglycemic agents washout.
The Botnia study is a family-based, observational familial study started in 1990 on the West coast of Finland aiming at identifying diabetes susceptibility genes (11). The prospective part included 2,770 nondiabetic family members and/or their spouses (1,263 men and 1,507 women; mean age, 45 years), 151 of whom developed T2D during a median 9.5-year follow-up period (7). All subjects were given information about exercise and healthy diet and exposed at 2- to 3-year intervals to a new OGTT. Baseline measurements of α-HB and L-GPC were obtained from 2,580 Botnia participants, with 9.5-year median follow-up data analyzed.
Ethics committee approval was obtained by recruiting centers.
Measures.
Blood samples were taken before and 30, 60, 90, and 120 min (30, 60, and 120 min in Botnia) after a 75-g OGTT, with a follow-up test repeated in RISC and Botnia. In RISC, clamps and OGTTs were performed in all subjects within same week (10).
Targeted metabolite analysis.
For absolute quantitation, metabolites were analyzed by an analytically and clinically validated isotope-dilution ultra-high-performance liquid chromatographic tandem mass spectroscopy (UHPLC-MS/MS) assay developed and conducted in a Clinical Laboratory Improvement Act/College of American Pathologists–accredited laboratory, as a consolidated version of the assay described previously (4). In brief, 50 µL EDTA plasma samples were spiked with internal standards and subsequently subjected to protein precipitation by mixing with 250 µL methanol. After centrifugation, aliquots of clear supernatant were injected onto an UHPLC-MS/MS system, consisting of a Thermo TSQ Quantum Ultra Mass Spectrometer and a Waters Acquity UHPLC system equipped with a column manager module in 2.5-min assay. α-HB, L-GPC, and oleic acid were eluted with a gradient on Waters Acquity single RPC-18 column (2.1 mm × 50 mm, 1.7-mm particle size) at a mobile-phase flow rate of 0.4 mL/min at 40°C. Ionization was achieved by a heated electrospray ionization source. Quantitation was performed based on the area ratios of analyte and internal standard peaks using a weighted linear least-squares regression analysis generated from fortified calibration standards in an artificial matrix, prepared immediately before each run, with coefficients of variation for α-HB, L-GPC, and oleic acid at 4.0, 6.3, and 4.6%, respectively, based on Botnia data (n = 2,585) and 146 replicates over 9 months. Stable deuterium-labeled compounds (α-HB-D3, L-GPC-D9, and oleic acid-13C18) were used as internal standards.
For targeted quantitation of amino acids, we used the AbsolutIDQ p180 kit (BIOCRATES Life Sciences AG, Innsbruck, Austria) on an API 4000 LC-ESI-MS/MS System (AB Sciex Deutschland GmbH, Darmstadt, Germany) equipped with an Agilent 1200 Series HPLC and an HTC PAL auto sampler (CTC Analytics, Zwingen, Switzerland). The instrument was controlled by Analyst 1.5.1 software. Samples were handled and preprocessed using a Hamilton Micro Laboratory Star robot (Hamilton Bonaduz AG, Bonaduz, Switzerland) and a nitrogen evaporator (Porvar, Ultravap). For data preprocessing and analysis, we followed the operating procedure of a proprietary method, as described in U.S. patent application (US 2007/0004044). In brief, 10 µL serum were put on the kit 96-well plate loaded with internal standards. After derivatization of the amino acids with phenylisothiocyanate, metabolite extraction with organic extraction solvent, filtration by centrifugation, and dilution with H2O, the samples were analyzed by HPLC and MS instruments. Calculation of metabolite concentrations based on internal standards was performed with the MetIQ package, which is an integral part of the kit. In addition, the data were corrected for batch effects. The AbsolutIDQ methods were proven to be in conformance with the U.S. Food and Drug Administration Guideline (Guidance for Industry—Bioanalytical Method Validation, May 2001) requiring proof of reproducibility within an given error range (5).
In vitro studies.
The clonal INS-1e cell line, derived and selected from the parental rat insulinoma, was donated by Dr. Claes Wollheim (University of Geneva, Switzerland). Tissue culture reagents were obtained from Gibco Invitrogen (Basel, Switzerland), α-HB from Sigma-Aldrich (St. Louis, MO), and L-GPC from Avanti Polar Lipids (Alabaster, AL). Cells were grown in monolayer culture in RPMI-1640 medium containing 11.1 mmol/L glucose. The culture medium was supplemented with 10% heat-inactivated FCS, 1 mmol/L sodium pyruvate, 10 mmol/L HEPES, 2 mmol/L glutamine, 50 μmol/L β-mercaptoethanol, 100 units/mL penicillin, and 100 μg/mL streptomycin. Cells were cultured at 37°C in a humidified 95% air, 5% CO2 atmosphere. Cells were seeded in wells at a density of 1.5 × 10⁵ cells per culture well at least 96 h before use in the insulin secretion experiments. The response to glucose was tested at passage between 50 and 95. At 48 h before the experiment, when ∼80% confluence had been reached, cells were incubated in fresh RPMI-1640 medium containing 11 mmol/L glucose, in the presence or absence of α-HB (at a concentration of 6, 18, or 54 µg/mL) or L-GPC (at a concentration of 5, 15, or 45 µg/mL). Before experiments, cells were maintained for 1 h in glucose-free culture medium. Cells were washed twice and preincubated at 37°C for 1 h in 1 mL glucose-free Krebs-Ringer bicarbonate HEPES buffer (KRBH) containing 135 mmol/L NaCl, 3.6 mmol/L KCl, 5 mmol/L NaHCO3, 0.5 mmol/L NaH2PO4, 0.5 mmol/L MgCl2, 1.5 mmol/L CaCl2, 10 mmol/L HEPES, and 0.1% BSA (glucose-free and free fatty acid [FFA]-free), pH 7.4. Cells were washed once with glucose-free KRB-HEPES buffer and subsequently incubated for 60 min with KRB-HEPES buffer containing 3.3, 11.0, or 20.0 mmol/L glucose, or 20 mmol/L glucose plus 10 mmol/L l-arginine. At the end of incubation, supernatants were collected to measure insulin concentration by enzyme-linked immunosorbent assay (Millipore Corporation, Billerica, MA).
Data analysis.
Fat-free mass (FFM) was measured by electrical bioimpedance (8). Glucose tolerance was categorized as normal glucose tolerance (NGT; fasting glucose <6.1 mmol/L and 2-h glucose <7.8 mmol/L), impaired glucose tolerance (IGT; fasting glucose <7.0 mmol/L and 2-h glucose ≥7.8 and <11.1 mmol/L), and T2D (fasting glucose ≥7.0 mmol/L or 2-h glucose ≥11.1 mmol/L, or antidiabetic treatment). Impaired fasting glycemia (IFG) was defined as fasting glucose <7.0 and ≥6.1 mmol/L and 2-h glucose <7.8. IFG and IGT were pooled as impaired glucose regulation (IGR).
On the basis of observed OGTT changes at follow-up, RISC participants were classified as stable NGT (i.e., NGT at baseline and follow-up) and progressors (i.e., those progressing in sequences NGT → IFG, NGT → IGT, NGT → T2D, IFG → IGT, IFG → T2D, or IGT → T2D between baseline and follow-up).
Insulin sensitivity was the M value during final 40 min of clamp normalized to FFM (µmol ⋅ min−1 ⋅ kgFFM−1). In Botnia, insulin sensitivity was estimated (eM) from plasma glucose and insulin concentrations measured during OGTT according to Stumvoll et al. (12).
β-Cell function.
In RISC, β-cell function was expressed as β-cell glucose sensitivity (β-GS) as derived from mathematical modeling of plasma glucose and C-peptide response to glucose ingestion (13) with use of C-peptide deconvolution analysis from Van Cauter et al. (14). β-GS is the dose–response function relating insulin secretion rates to plasma glucose concentrations during dynamic testing. In Botnia, C-peptide measurements were not available. Therefore, the ratio of the insulin-to-glucose (I-to-G) area under the curve during OGTT was used as a surrogate index of β-cell function.
Statistical analysis.
Data are presented as mean ± SD or, for variables with a skewed distribution, as median (interquartile range). Group values were compared by Mann-Whitney (or Kruskal-Wallis) test for continuous variables or χ2 for nominal variables, and paired group values were compared by Wilcoxon test. Simple associations were tested by Spearman correlation coefficient (ρ). General linear models were used to test for associations while controlling for potential confounders (center, sex, age, BMI), and strength of adjusted associations was expressed as partial correlation coefficients (r). Logistic regression was used to predict progression; odds ratios and 95% CIs were expressed for one SD change in each explanatory variable. Performance of different logistic models was assessed as the C statistic (area under receiver operating characteristic [ROC] curve). For in vitro data, two-way ANOVA was used to simultaneously test for effect on insulin release of increasing glucose and added α-HB or L-GPC concentrations. Statistical analyses were run using JMP 7.0 software (SAS Institute, 2007). A two-sided P ≤ 0.05 was considered significant.
RESULTS
Baseline.
Data of RISC participants are grouped in Table 1 in 1,115 NGT subjects by quartile of insulin sensitivity (M value from clamp), IGR, and T2D subjects. Familial diabetes, age, BMI, 2-h glucose, fasting insulin, and fasting FFA concentrations were progressively higher along M quartiles in NGT, IGR, and T2D subjects, whereas β-GS was progressively lower. Across these groups, fasting levels of α-HB were progressively higher, whereas L-GPC concentrations showed an inverse gradient, with respective highest and lowest levels observed in T2D.
TABLE 1.
RISC study: baseline anthropometric and metabolic parameters
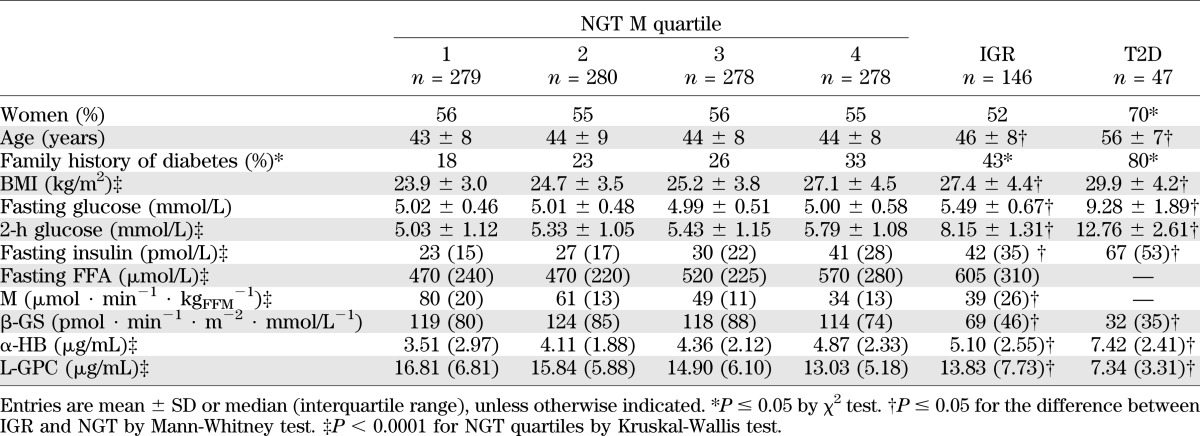
After adjusting for sex, age, BMI, and study site, α-HB and L-GPC concentrations were directly and inversely associated with insulin sensitivity (M), respectively (adjusted r2 = 0.33 and 0.34, respectively, both P < 0.0001; Supplementary Fig. 1). In the same model, α-HB was reciprocally related to β-cell function (β-GS, partial r = −0.11, P = 0.0002), whereas L-GPC was unrelated. By defining IR as an M value in the bottom quartile of NGT subjects (<39 µmol ⋅ min−1 ⋅ kgFFM−1), α-HB concentration in the top quartile of its own distribution (>5.48 µg/mL) confers an IR risk of 2.84 (95% CI 2.04–3.95), whereas an L-GPC concentration in the bottom quartile of its distribution (<11.78 µg/mL) confers a risk of 3.14 (2.19–4.52). In the 122 NGT subjects falling in the highest α-HB quartile and the lowest L-GPC quartile, the risk of IR is 4.14 (2.60–6.70). Prediction of IR (defined as above) increases from a ROC of 0.801 when using familial diabetes, sex, age, and BMI as predictors to a ROC of 0.837 upon adding α-HB and L-GPC measurements.
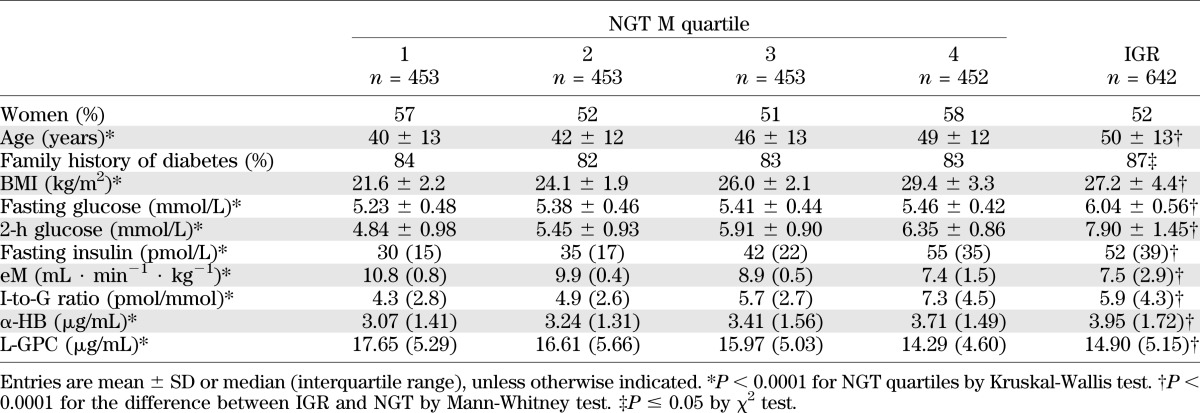
Data of Botnia participants are given in Table 2 by quartile of eM (Stumvoll index) for the 1,811 NGT subjects and separately for 642 IGR subjects. By study design, prevalence of familial diabetes was high in this cohort and similar across eM quartiles in NGT. Age, BMI, fasting and 2-h glucose concentrations, and fasting insulin concentrations were progressively higher across eM quartiles and IGR, whereas β-cell function (as measured by I-to-G ratio) was highest in the most IR quartile and lower in IGR subjects, indicating incipient β-cell failure. α-HB levels were progressively higher across these groups, whereas L-GPC concentrations showed an inverse gradient. In the whole cohort, eM was negatively associated with α-HB and positively related to L-GPC (partial r = –0.19 and 0.22, respectively, both P < 0.0001) after adjusting for familial diabetes, sex, age, and BMI. In the same adjusted model, the I-to-G ratio was reciprocally related to α-HB (partial r = −0.09, P < 0.0001), whereas L-GPC was unrelated.
TABLE 2.
Botnia study: baseline anthropometric and metabolic parameters
Follow-up.
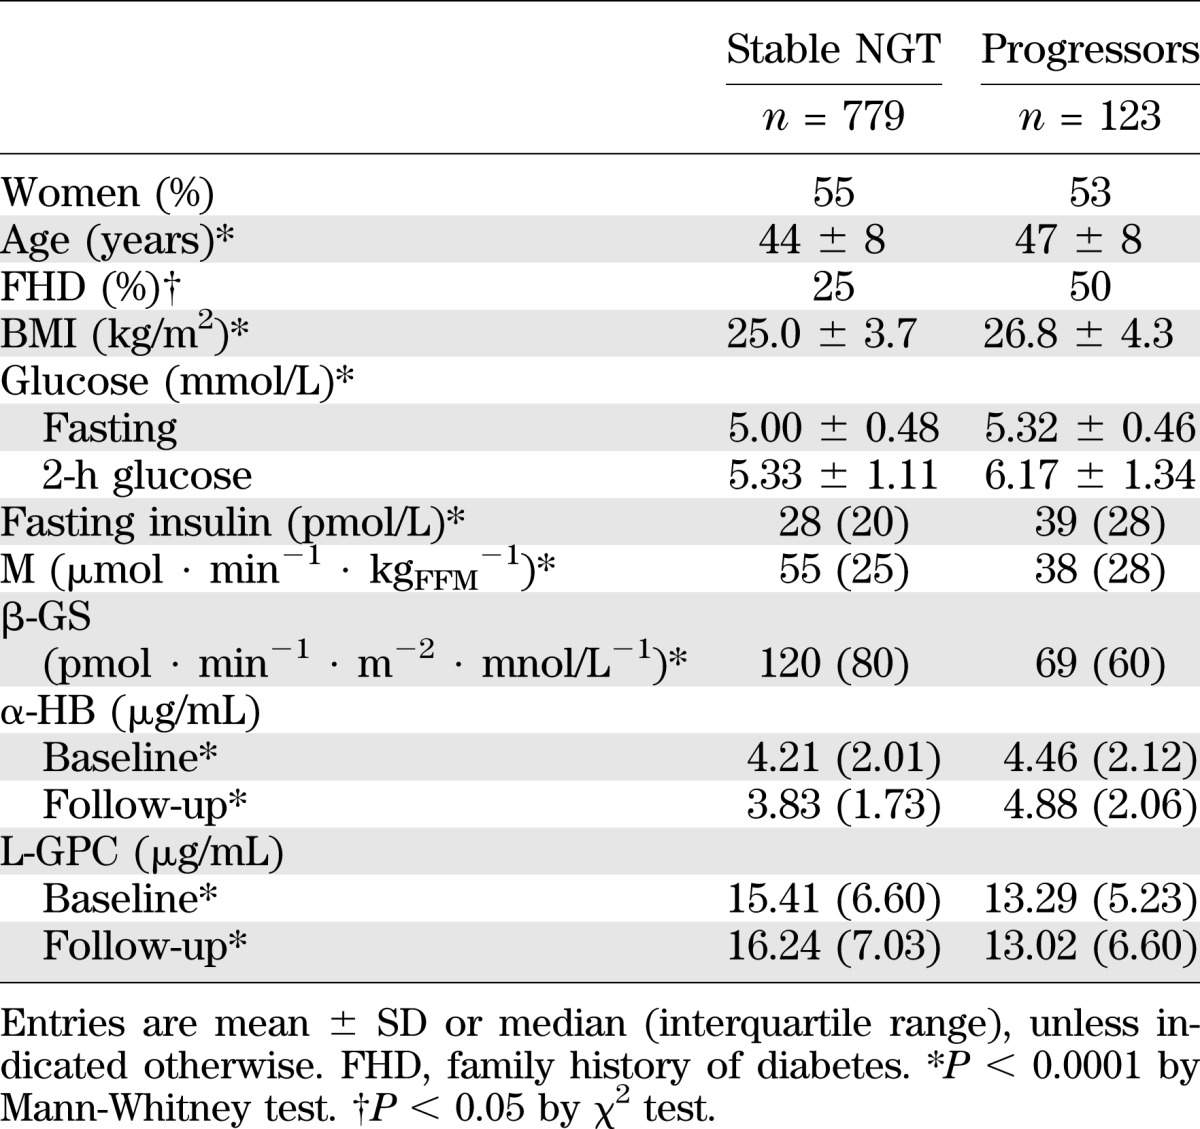
In RISC (Table 3), GT was still normal in 779 subjects (stable NGT) and had deteriorated in 123 (progressors). The baseline clinical phenotype of progressors included more familial diabetes, higher age, BMI, fasting glucose, 2-h glucose, and fasting insulin concentrations. Furthermore, progressors were more IR and (β-cell)–glucose insensitive and had higher α-HB and lower L-GPC concentrations. At follow-up, the α-HB had decreased in stable NGT subjects (by 0.27 [interquartile range, 2.00] µg/mL) and increased in progressors (by 0.41 [2.1] µg/mL), the difference being significant (P = 0.0003). By contrast, the L-GPC had increased in stable NGT (by 0.69 [6.4] µg/mL) and decreased in progressors (by 0.04 [4.8] µg/mL), this difference too being significant (P < 0.05; Table 3).
TABLE 3.
RISC study: baseline anthropometric and metabolic parameters by outcome
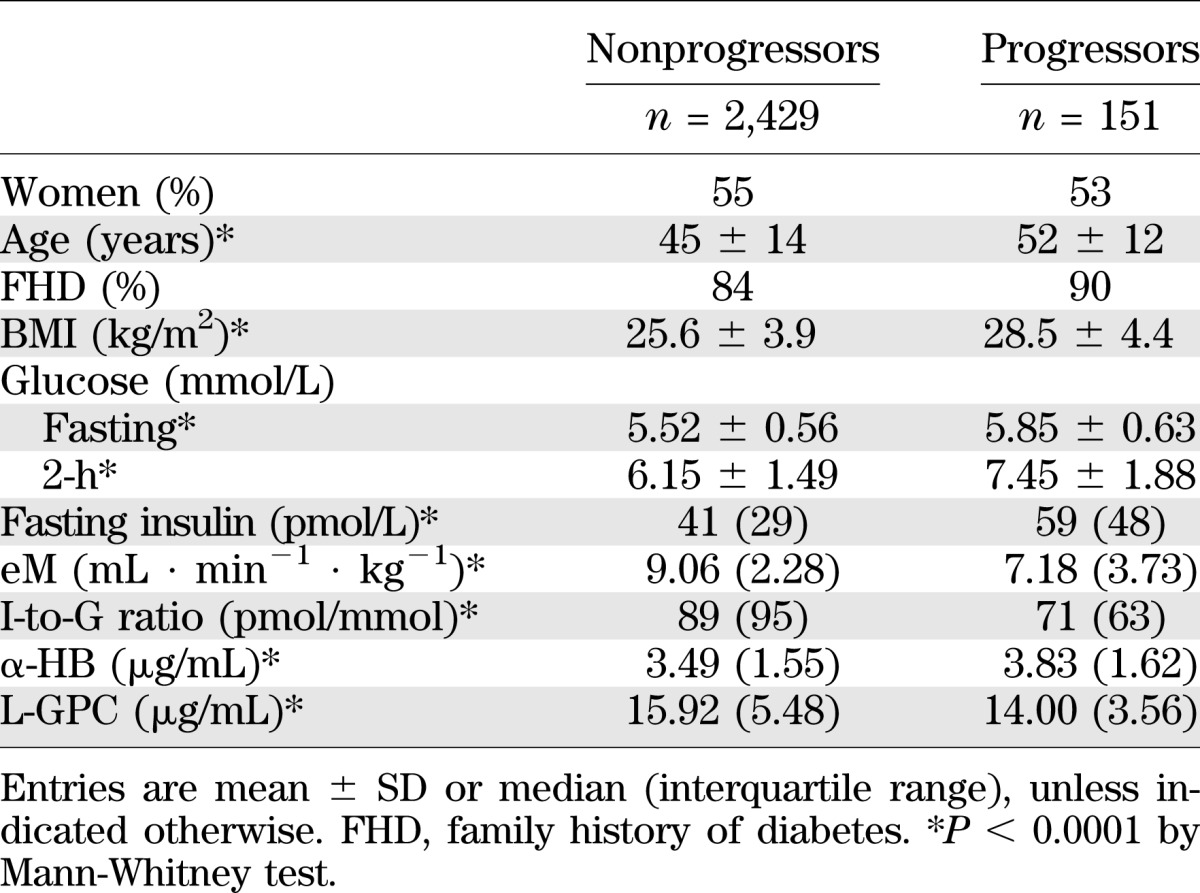
Among the 2,580 Botnia participants, 151 had developed T2D at the 9.5-year follow-up visit (Table 4). The baseline clinical and metabolic characteristics of Botnia T2D progressors versus nonprogressors were very similar to those of RISC progressors; again, α-HB levels were higher and L-GPC levels were lower.
TABLE 4.
Botnia study: baseline anthropometric and metabolic parameters by outcome
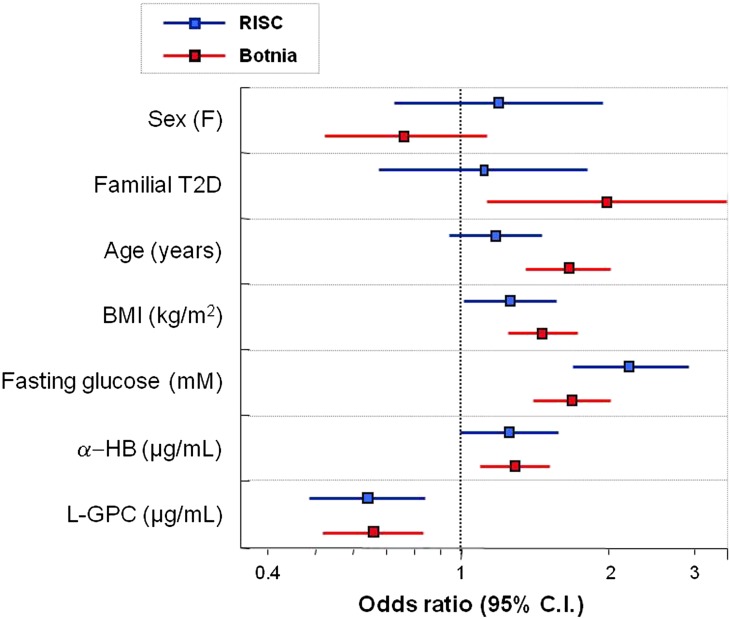
The predictivity of α-HB and L-GPC for incident dysglycemia (RISC) or T2D (Botnia) was evaluated in multivariate models including classical predictors. We found generally similar odds ratios between the two populations. BMI and fasting glucose were positive predictors in both cohorts, whereas familial diabetes and age were stronger positive predictors in Botnia than RISC. In both cohorts, baseline α-HB was a positive predictor and L-GPC a negative predictor of almost superimposable strength (Fig. 1).
FIG. 1.
Multivariate logistic regression for incident dysglycemia (RISC) or T2D (Botnia). Odds ratios (95% CI) for α-HB are 1.25 (1.00–1.60) and 1.26 (1.07–1.48), respectively, for RISC and Botnia cohorts. The corresponding odds ratios (95% CI) for L-GPC are 0.64 (0.48–0.85) and 0.67 (0.54–0.84). Odds ratios are calculated for 1 SD of the explanatory variables. (A high-quality color representation of this figure is available in the online issue.)
We next compared the ability of α-HB and L-GPC to predict dysglycemia/T2D with that of traditional clinical models. As detailed in Table 5, adding fasting plasma glucose to the standard clinical predictors (familial diabetes, sex, age, and BMI) increased the ROC area under the curve by 0.044 in RISC and 0.017 in Botnia. Upon adding also the 2-h postglucose plasma glucose concentration, ROC area rose by a further 0.024 in RISC and 0.022 in Botnia. By replacing 2-h glucose with α-HB and L-GPC, very similar ROCs were observed in RISC (0.790) and Botnia (0.783). Finally, adding α-HB and L-GPC to both fasting and 2-h glucose improved the ROC by 0.018 in RISC and by 0.008 in Botnia. Thus the two biomarkers matched the predictivity of an OGTT (fasting insulin making a negligible contribution) in both cohorts. Interestingly, including the actual measurements of insulin sensitivity and β-cell function in the 2-h glucose model yielded ROC values of 0.817 and 0.794 in RISC and Botnia, respectively (i.e., only 0.016 and 0.011 higher than the fasting biomarkers model).
TABLE 5.
Prediction of progression to dysglycemia (RISC study) or diabetes (Botnia study)

In vitro studies.
Because levels of α-HB and L-GPC were predictive of dysglycemia, we also tested their activity on insulin secretion in INS-1e cells. Insulin release increased as glucose concentrations rose from 3.3 to 20.0 mmol/L and was potentiated by adding arginine to 20.0 mmol/L glucose. Overall, preincubation with α-HB inhibited, and preincubation with L-GPC potentiated, glucose- and glucose/arginine-induced insulin release in a dose-dependent manner (Supplementary Fig. 2). More specifically, the effects of α-HB and L-GPC both appeared to be exerted on insulin secretion at low glucose concentrations. For example, L-GPC dose-dependently increased insulin release at 3.3 mmol/L glucose (from 42 ± 6 to 73 ± 13 ng/mL at the highest L-GPC dose, P < 0.01), and α-HB tended to dose-dependently decrease insulin release at 3 mmol/L glucose.
Amino acid profile.
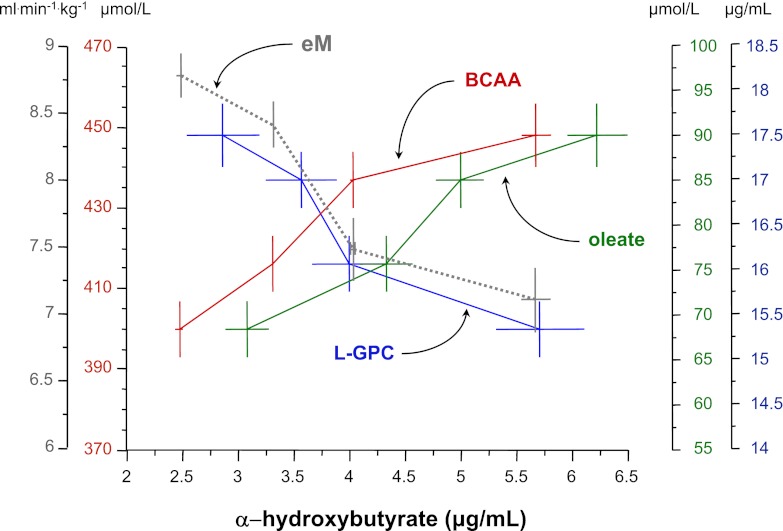
To further examine these biomarkers in the context of other metabolic pathways in vivo, we measured amino acids and fatty acids in 542 representative subjects from Botnia (Supplementary Table 1), with progressors and nonprogressors having a similar clinical phenotype as the entire cohort (compared with Table 2). Notably, branched-chain amino acids (BCAAs; leucine, isoleucine, valine) and three major glucogenic amino acids (alanine, glutamate, arginine) were increased, whereas glycine was significantly decreased, in progressors versus nonprogressors. Increased concentrations of BCAAs and fatty acids, such as oleate, were positively related to α-HB, whereas L-GPC and insulin sensitivity were reciprocally related to α-HB (Fig. 2). In addition, oleate and L-GPC were reciprocally related to one another (with partial r of –0.23, P < 0.0001 after adjusting for sex, age, BMI; Supplementary Fig. 3).
FIG. 2.
Relationship between L-GPC, α-HB, BCAA, and oleate levels and insulin sensitivity. Fasting plasma concentrations of the BCAAs (sum of leucine, isoleucine, and valine) by quartile of α-HB concentrations in 542 subjects from the Botnia study are shown. Also plotted are plasma L-GPC and oleate concentrations, and eM values by quartile of α-HB. Plots are mean ± SEM. Note that the horizontal scale for oleate and L-GPC has been shifted to avoid overlapping symbols.
DISCUSSION
With T2D prevalence continuing to increase worldwide, there is interest in identifying high-risk patients with more sensitivity than currently feasible. Because IR is a risk factor for IGT and T2D (15), we tested whether newly identified markers of insulin sensitivity and β-cell function (6) could predict deterioration of glucose tolerance. We found α-HB and L-GPC were related to IR in an opposite manner—the former positive, the latter negative—in the RISC and Botnia cohorts, independently of known determinants of insulin sensitivity and of one another. Fasting concentrations of α-HB and L-GPC measured at baseline predicted worsening GT independently of classical predictors and with similar power as the 2-h plasma glucose level. Furthermore, changes in α-HB and L-GPC over time tracked with their ability to predict development of dysglycemia in the RISC cohort: at follow-up, α-HB had risen and L-GPC had fallen in subjects who progressed to dysglycemia compared with stable NGT subjects.
Strikingly, odds ratios for both metabolites for risk of progression to dysglycemia were virtually the same in RISC and Botnia (Fig. 1) despite differences in population characteristics, sample size, and end point. Accordingly, the metabolites added 0.028 and 0.017 units of ROC area to the standard model for predicting dysglycemia in RISC and Botnia, respectively. In contrast, fasting insulin, which has been shown to predict T2D in several studies (16–18), did not contribute to predictivity above the joint weight of α-HB and L-GPC in either study. Taken together, these results qualify these metabolites as disease biomarkers through their relation to underlying pathophysiological mechanisms. However, their actual value in routine clinical use requires additional studies, particularly intervention studies.
Because in RISC and Botnia an independent, inverse relationship also existed between α-HB levels and indices of β-cell function (19), we tested the direct impact of these metabolites on insulin secretion. In β-cell in vitro studies, α-HB dose-dependently inhibited overall glucose- and arginine-mediated insulin release. Although this effect must be confirmed in human islets and its mechanisms remain to be investigated, α-HB may mark IR and also β-cell function under diverse circumstances. This use would have utility for clinicians who have available surrogate indices of IR (e.g., homeostasis model assessment-IR [20] or Matsuda index [21]) but must choose among clinical tests of β-cell function (e.g., hyperglycemic clamp, acute insulin response to intravenous glucose, insulinogenic index) that are cumbersome and relatively incongruous with one another (22–24). In this regard, it is notable that L-GPC appeared to exert the opposite effect to α-HB on in vitro insulin release, thereby adding to the evidence that certain lipid-signaling molecules (including lysophospholipids) can stimulate glucose-dependent insulin release (25) through lysophospholipid receptors such as G-protein–coupled receptor 119 (26), which localized to pancreatic β-cells. Interestingly, a similar lipid-signaling pathway has been described for G-protein–coupled receptor 119, with its lipid agonist activation playing a role in glucagon-like peptide-1 release in intestinal l-cells (27). Moreover, lysophospholipids have been implicated in other signaling functions related to metabolism, including glucose uptake by adipocytes and myotubes (28,29). Declining L-GPC levels across IR, IGR, and T2D (Table 1 and Table 2) are likely a reflection of an important role for this metabolite in glucose metabolism.
Previous evidence has linked raised concentrations of selected amino acids with obesity and T2D (reviewed in 30). Newgard et al. (1) described a metabolic signature related to BCAAs in obese humans. Fiehn et al. (31) reported increased concentrations of leucine and valine—in addition to lipid substrates—in a small group of obese T2D women. Lower glycine concentrations have been reported in IR offspring of T2D patients (32), consistent with our observation of lower glycine associated with IR (6). However, compared with such reported analytes, α-HB and L-GPC were more sensitive markers of IR, e.g., able to discriminate insulin sensitive from IR individuals in both NGT and IGR ranges (6).
The pattern of metabolite changes we observed in the Botnia subgroup (Supplementar1y Table 1) can be organized into a coherent pathway (Supplementary Fig. 3) by assuming IR as a primary determinant of these changes. In this scenario, adipose tissue IR leads to elevated FFA concentrations (33,34), which feed into the TCA cycle and are oxidized at an increased rate, thereby producing an excess of reducing equivalents (NADH). Raised circulating FFA also reconstitutes phospholipids from circulating lipids such as L-GPC. Such overload of the TCA cycle leads to accumulation of amino acids such as glutamate and alanine, as well as α-ketobutyrate (6), substrate precursor of α-HB via propionyl-CoA. Oxidative stress and IR raise demand for glutathione synthesis (35), of which α-ketobutyrate and α-HB are by-products, and depletes glutathione constituents like glycine, whose levels are decreased in association with IR and T2D progression (Supplementary Table 1). Furthermore, by reducing amino acid transport (36) and clearance (31,37), IR also raises BCAAs (6,30,38–40), which also feed into the TCA cycle, directly (leucine) or via propionyl-CoA. Thus, increased α-HB and decreased L-GPC levels serve as readouts of metabolic overload (elevated NADH-to-NAD+ ratio) and reduced glucose metabolism in both IR and the earliest phases of dysglycemia (6,41) (Fig. 3). Finally, the abnormal α-HB and L-GPC levels and their biological activity on in vitro glucose-stimulated insulin release may translate into a burden on in vivo β-cell function.
FIG. 3.
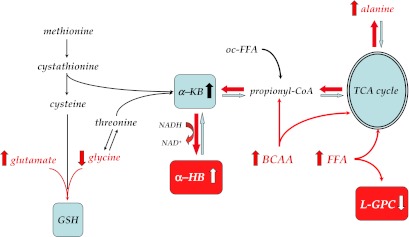
Reconstruction of the metabolic pathway featuring α-HB and L-GPC. Unmeasured metabolites are in italic, and statistically significant changes between progressors and nonprogressors are indicated in red. α-KB, α-ketobutyrate; GSH, glutathione; oc-FFA, odd-chain FFA. See text for further explanation.
Supplementary Material
ACKNOWLEDGMENTS
K.-P.A., M.V.M., and W.E.G. are employees of Metabolon, Inc. No other potential conflicts of interest relevant to this article were reported.
E.F. contributed to study concept and design, to acquisition, analysis, and interpretation of data, to statistical analysis (RISC and Botnia), and to study supervision (RISC). A.N. and A.M. contributed to analysis and interpretation of data. S.C., M.N., K.-P.A., M.V.M., G.K., J.A., and T.T. contributed to acquisition of data. V.L. contributed to study concept and design, to acquisition of data, and to statistical analysis (Botnia). L.G. contributed to study concept and design, to acquisition of data, and to study supervision (Botnia). W.E.G. contributed to study concept and design and to acquisition, analysis, and interpretation of data. E.F. is the guarantor of this work and, as such, had full access to all the data in the study and takes responsibility for the integrity of the data and the accuracy of the data analysis.
Parts of this study were presented as an abstract in the poster session at the 72nd Scientific Sessions of the American Diabetes Association, Philadelphia, Pennsylvania, 8–12 June 2012.
The authors thank Kay Lawton and Eric Button of Metabolon, Inc., for their helpful comments in preparation of the manuscript.
Footnotes
This article contains Supplementary Data online at http://diabetes.diabetesjournals.org/lookup/suppl/doi:10.2337/db12-0707/-/DC1.
See accompanying commentary, p. 1384.
REFERENCES
- 1.Newgard CB, An J, Bain JR, et al. A branched-chain amino acid-related metabolic signature that differentiates obese and lean humans and contributes to insulin resistance. Cell Metab 2009;9:311–326 [DOI] [PMC free article] [PubMed]
- 2.Huffman KM, Shah SH, Stevens RD, et al. Relationships between circulating metabolic intermediates and insulin action in overweight to obese, inactive men and women. Diabetes Care 2009;32:1678–1683 [DOI] [PMC free article] [PubMed] [Google Scholar]
- 3.Shah SH, Svetkey LP, Newgard CB. Branching out for detection of type 2 diabetes. Cell Metab 2011;13:491–492 [DOI] [PubMed] [Google Scholar]
- 4.Kolak M, Westerbacka J, Velagapudi VR, et al. Adipose tissue inflammation and increased ceramide content characterize subjects with high liver fat content independent of obesity. Diabetes 2007;56:1960–1968 [DOI] [PubMed] [Google Scholar]
- 5.Wang TJ, Larson MG, Vasan RS, et al. Metabolite profiles and the risk of developing diabetes. Nat Med 2011;17:448–453 [DOI] [PMC free article] [PubMed] [Google Scholar]
- 6.Gall WE, Beebe K, Lawton KA, et al. RISC Study Group alpha-hydroxybutyrate is an early biomarker of insulin resistance and glucose intolerance in a nondiabetic population. PLoS ONE 2010;5:e10883. [DOI] [PMC free article] [PubMed] [Google Scholar]
- 7.Lyssenko V, Jonsson A, Almgren P, et al. Clinical risk factors, DNA variants, and the development of type 2 diabetes. N Engl J Med 2008;359:2220–2232 [DOI] [PubMed] [Google Scholar]
- 8.Hills SA, Balkau B, Coppack SW, et al. EGIR-RISC Study Group The EGIR-RISC STUDY (The European group for the study of insulin resistance: relationship between insulin sensitivity and cardiovascular disease risk): I. Methodology and objectives. Diabetologia 2004;47:566–570 [DOI] [PubMed] [Google Scholar]
- 9.Ferrannini E, Balkau B, Coppack SW, et al. RISC Investigators Insulin resistance, insulin response, and obesity as indicators of metabolic risk. J Clin Endocrinol Metab 2007;92:2885–2892 [DOI] [PubMed] [Google Scholar]
- 10.Ferrannini E, Natali A, Muscelli E, et al. RISC Investigators Natural history and physiological determinants of changes in glucose tolerance in a non-diabetic population: the RISC Study. Diabetologia 2011;54:1507–1516 [DOI] [PubMed] [Google Scholar]
- 11.Groop L, Forsblom C, Lehtovirta M, et al. Metabolic consequences of a family history of NIDDM (the Botnia study): evidence for sex-specific parental effects. Diabetes 1996;45:1585–1593 [DOI] [PubMed] [Google Scholar]
- 12.Stumvoll M, Mitrakou A, Pimenta W, et al. Use of the oral glucose tolerance test to assess insulin release and insulin sensitivity. Diabetes Care 2000;23:295–301 [DOI] [PubMed] [Google Scholar]
- 13.Mari A, Schmitz O, Gastaldelli A, Oestergaard T, Nyholm B, Ferrannini E. Meal and oral glucose tests for assessment of beta-cell function: modeling analysis in normal subjects. Am J Physiol Endocrinol Metab 2002;283:E1159–E1166 [DOI] [PubMed] [Google Scholar]
- 14.Van Cauter E, Mestrez F, Sturis J, Polonsky KS. Estimation of insulin secretion rates from C-peptide levels. Comparison of individual and standard kinetic parameters for C-peptide clearance. Diabetes 1992;41:368–377 [DOI] [PubMed] [Google Scholar]
- 15.Ferrannini E. Insulin resistance versus insulin deficiency in non-insulin-dependent diabetes mellitus: problems and prospects. Endocr Rev 1998;19:477–490 [DOI] [PubMed] [Google Scholar]
- 16.Laakso M. How good a marker is insulin level for insulin resistance? Am J Epidemiol 1993;137:959–965 [DOI] [PubMed] [Google Scholar]
- 17.Hanson RL, Pratley RE, Bogardus C, et al. Evaluation of simple indices of insulin sensitivity and insulin secretion for use in epidemiologic studies. Am J Epidemiol 2000;151:190–198 [DOI] [PubMed] [Google Scholar]
- 18.Hanley AJ, Williams K, Gonzalez C, et al. San Antonio Heart Study. Mexico City Diabetes Study. Insulin Resistance Atherosclerosis Study Prediction of type 2 diabetes using simple measures of insulin resistance: combined results from the San Antonio Heart Study, the Mexico City Diabetes Study, and the Insulin Resistance Atherosclerosis Study. Diabetes 2003;52:463–469 [DOI] [PubMed] [Google Scholar]
- 19.Mari A, Ferrannini E. Beta-cell function assessment from modelling of oral tests: an effective approach. Diabetes Obes Metab 2008;10(Suppl. 4):77–87 [DOI] [PubMed] [Google Scholar]
- 20.Matthews DR, Hosker JP, Rudenski AS, Naylor BA, Treacher DF, Turner RC. Homeostasis model assessment: insulin resistance and beta-cell function from fasting plasma glucose and insulin concentrations in man. Diabetologia 1985;28:412–419 [DOI] [PubMed] [Google Scholar]
- 21.Matsuda M, DeFronzo RA. Insulin sensitivity indices obtained from oral glucose tolerance testing: comparison with the euglycemic insulin clamp. Diabetes Care 1999;22:1462–1470 [DOI] [PubMed] [Google Scholar]
- 22.Porte D., Jr Normal physiology and phenotypic characterization of beta-cell function in subjects at risk for non-insulin-dependent diabetes mellitus. Diabet Med 1996;13(Suppl. 6):S25–S32 [PubMed] [Google Scholar]
- 23.Ferrannini E, Mari A. Beta cell function and its relation to insulin action in humans: a critical appraisal. Diabetologia 2004;47:943–956 [DOI] [PubMed] [Google Scholar]
- 24.Reaven GM. Insulin secretory function in type 2 diabetes: does it matter how you measure it? J Diabetes 2009;1:142–150 [DOI] [PubMed] [Google Scholar]
- 25.Soga T, Ohishi T, Matsui T, et al. Lysophosphatidylcholine enhances glucose-dependent insulin secretion via an orphan G-protein-coupled receptor. Biochem Biophys Res Commun 2005;326:744–751 [DOI] [PubMed] [Google Scholar]
- 26.Chu ZL, Jones RM, He H, et al. A role for beta-cell-expressed G protein-coupled receptor 119 in glycemic control by enhancing glucose-dependent insulin release. Endocrinology 2007;148:2601–2609 [DOI] [PubMed] [Google Scholar]
- 27.Lan H, Lin HV, Wang CF, et al. Agonists at GPR119 mediate secretion of GLP-1 from mouse enteroendocrine cells through glucose-independent pathways. Br J Pharmacol 2012;165:2799–2807 [DOI] [PMC free article] [PubMed] [Google Scholar]
- 28.Yea K, Kim J, Yoon JH, et al. Lysophosphatidylcholine activates adipocyte glucose uptake and lowers blood glucose levels in murine models of diabetes. J Biol Chem 2009;284:33833–33840 [DOI] [PMC free article] [PubMed] [Google Scholar]
- 29.Yea K, Kim J, Lim S, et al. Lysophosphatidylserine regulates blood glucose by enhancing glucose transport in myotubes and adipocytes. Biochem Biophys Res Commun 2009;378:783–788 [DOI] [PubMed] [Google Scholar]
- 30.Adams SH. Emerging perspectives on essential amino acid metabolism in obesity and the insulin-resistant state. Adv Nutr 2011;2:445–456 [DOI] [PMC free article] [PubMed] [Google Scholar]
- 31.Fiehn O, Garvey WT, Newman JW, Lok KH, Hoppel CL, Adams SH. Plasma metabolomic profiles reflective of glucose homeostasis in non-diabetic and type 2 diabetic obese African-American women. PLoS ONE 2010;5:e15234. [DOI] [PMC free article] [PubMed] [Google Scholar]
- 32.Perseghin G, Ghosh S, Gerow K, Shulman GI. Metabolic defects in lean nondiabetic offspring of NIDDM parents: a cross-sectional study. Diabetes 1997;46:1001–1009 [DOI] [PubMed] [Google Scholar]
- 33.Groop LC, Ferrannini E. Insulin action and substrate competition. Baillieres Clin Endocrinol Metab 1993;7:1007–1032 [DOI] [PubMed] [Google Scholar]
- 34.Karpe F, Dickmann JR, Frayn KN. Fatty acids, obesity, and insulin resistance: time for a reevaluation. Diabetes 2011;60:2441–2449 [DOI] [PMC free article] [PubMed] [Google Scholar]
- 35.Rolo AP, Teodoro JS, Palmeira CM. Role of oxidative stress in the pathogenesis of nonalcoholic steatohepatitis. Free Radic Biol Med 2012;52:59–69 [DOI] [PubMed] [Google Scholar]
- 36.Bonadonna RC, Saccomani MP, Cobelli C, DeFronzo RA. Effect of insulin on system A amino acid transport in human skeletal muscle. J Clin Invest 1993;91:514–521 [DOI] [PMC free article] [PubMed] [Google Scholar]
- 37.Pereira S, Marliss EB, Morais JA, Chevalier S, Gougeon R. Insulin resistance of protein metabolism in type 2 diabetes. Diabetes 2008;57:56–63 [DOI] [PubMed] [Google Scholar]
- 38.Felig P, Marliss E, Cahill GF., Jr Plasma amino acid levels and insulin secretion in obesity. N Engl J Med 1969;281:811–816 [DOI] [PubMed] [Google Scholar]
- 39.Tessari P, Cecchet D, Cosma A, et al. Insulin resistance of amino acid and protein metabolism in type 2 diabetes. Clin Nutr 2011;30:267–272 [DOI] [PubMed] [Google Scholar]
- 40.Adeva MM, Calviño J, Souto G, Donapetry C. Insulin resistance and the metabolism of branched-chain amino acids in humans. Amino Acids 2012;43:171–181 [DOI] [PubMed] [Google Scholar]
- 41.Cheng Z, Tseng Y, White MF. Insulin signaling meets mitochondria in metabolism. Trends Endocrinol Metab 2010;21:589–598 [DOI] [PMC free article] [PubMed] [Google Scholar]
Associated Data
This section collects any data citations, data availability statements, or supplementary materials included in this article.


