Abstract
Neonatal β cells do not secrete glucose-responsive insulin and are considered immature. We previously showed the transcription factor MAFA is key for the functional maturation of β cells, but the physiological regulators of this process are unknown. Here we show that postnatal rat β cells express thyroid hormone (TH) receptor isoforms and deiodinases in an age-dependent pattern as glucose responsiveness develops. In vivo neonatal triiodothyronine supplementation and TH inhibition, respectively, accelerated and delayed metabolic development. In vitro exposure of immature islets to triiodothyronine enhanced the expression of Mafa, the secretion of glucose-responsive insulin, and the proportion of responsive cells, all of which are effects that were abolished in the presence of dominant-negative Mafa. Using chromatin immunoprecipitation and electrophoretic mobility shift assay, we show that TH has a direct receptor-ligand interaction with the Mafa promoter and, using a luciferase reporter, that this interaction was functional. Thus, TH can be considered a physiological regulator of functional maturation of β cells via its induction of Mafa.
β-Cell replacement therapy is a major goal of diabetes research. Insulin-positive cells have been successfully derived from stem cells (1–4), but these cells have not been responsive to glucose in vitro and must be considered functionally immature. Fetal and neonatal rodent β cells also lack glucose responsiveness (5) and therefore provide a good model to study the acquisition of glucose responsiveness and β-cell maturation.
Neonatal β cells are characterized by low expression of many key genes of the specialized β-cell phenotype (6). We previously showed that in neonatal islets, Mafa is expressed at ∼10% of the adult level and that its adenoviral-mediated reconstitution to adult levels in P2 islets induced secretion of glucose-responsive insulin (7). But what regulates Mafa in vivo? To identify physiological regulators, we considered the changes that normally occur in the physiological milieu during the neonatal period (8). During the second postnatal week, serum thyroxine (T4) (9) and corticosterone (10) surge and prolactin levels rise by postnatal day 20 (11).
We hypothesized that thyroid hormone (TH) could physiologically regulate Mafa, enhancing its expression and driving the maturation of the insulin secretory response to glucose in neonatal β cells. TH serum levels start increasing in parallel with Mafa expression increases, and TH is important in the postnatal development of the central nervous system and the digestive track (8). Inhibition of TH synthesis prevents or delays maturation of these systems, and TH administration results in precocious development. Triiodothyronine (T3) has been shown to enhance the differentiation of a human pancreatic duct cell line toward a β-cell phenotype (12). Moreover, thyrotoxicosis leads to hyperinsulinemia with increased hepatic glucose production and insulin resistance (13); hypothyroidism reduces production of hepatic glucose and insulin resistance (14).
The effects of TH are mediated by TH receptors (THRs), which are members of the nuclear receptor superfamily. Three major isoforms—THRA1, THRB1, and THRB2—exhibit similar ligand-dependent regulation of gene activity, whereas a fourth isoform, THRA2, lacks the ligand-binding and transactivation domains (15). Different isoforms have been identified in whole pancreas during development (16), and THRA1 has been identified in adult islet cells (17); however, little is known about their expression in β cells during the postnatal period.
The active TH bound to receptors is 3,5,3′-T3, and available T3 is derived from the thyroid gland or from conversion from thyroxine (T4) by type 1 or type 2 iodothyronine deiodinases (D1 and D2). A third deiodinase, type 3 (or D3), inactivates T3. D3-null animals, which had higher levels of TH during development, were glucose intolerant with impaired secretion of glucose-stimulated insulin, suggesting that early exposure to high amounts of T3 might be deleterious to developing β cells (18). However, the role of TH in β-cell development under physiological conditions as well as the mechanisms involved are still unclear.
Herein we show that postnatal rat β cells express THR isoforms and deiodinases in an age-dependent pattern and therefore have the ability to respond to the rapidly rising T4 concentration that peaks at about postnatal day 15. In vivo neonatal T3 supplementation and TH inhibition, respectively, accelerated and delayed metabolic development. In vitro exposure of immature islets to T3 enhanced Mafa expression and increased glucose responsiveness, effects that were abolished in the presence of dominant-negative (DN) Mafa. Using chromatin immunoprecipitation (ChIP) and electrophoretic mobility shift assay (EMSA) we show that TH has a direct receptor-ligand interaction with the Mafa promoter; using a luciferase reporter, we then showed that this interaction is functional. Thus, TH is a physiological stimulus for the postnatal maturation of functional β cells.
RESEARCH DESIGN AND METHODS
Animals.
Female Sprague-Dawley rats with litters of various ages (P0 is day of birth) were purchased from Taconic Farms (Germantown, NY) and kept under conventional conditions with free access to water and food. Animals were killed under anesthesia at postnatal days 2–28 or as an adult; blood was collected by cardiac puncture, and pancreas was excised for histology or islet isolation. Islets were isolated (19), cultured overnight in RPMI-1640 medium, and were handpicked to ensure purity. For each sample from postnatal days 2 or 7, islets from 10 pups were pooled; for samples from postnatal days 9 to 28, islets from 2 or 3 pups were pooled; and for the adult sample, islets from one animal were used. Three to six samples per age group were included. For immunostaining, excised pancreas was either fixed for 2 h in 4% paraformaldehyde for paraffin embedding or embedded in optimal cutting temperature medium (Tissue Tek) and was frozen in chilled isopentane. The Joslin Institutional Animal Care and Use Committee approved all animal procedures.
Plasma insulin and T4 levels.
Plasma insulin and T4 levels were measured using enzyme-linked immunoassay (ALPCO, Windham NH) and COAT-A-COUNT total T4 kit (DPC, Los Angeles, CA), as previously described (20).
Neonatal models of T3 supplementation and inhibition of TH synthesis.
Timed-pregnant Sprague-Dawley rats were randomized into one of three groups:
1) Control pups received subcutaneous injections of 0.9% NaCl daily for 7 days, starting at postnatal day 1.
2) For inhibition of TH synthesis, rats were given tap water ad libitum with 20 mg methimazole (MMI)/100 mL water (21) from birth to postnatal days 15 or 21, when the pups were killed.
3) For T3 supplementation, pups received subcutaneous injections of T3 (0.05 μg/g body weight) daily for 7 days starting on postnatal day 1 (22).
Body weight and fed glucose levels were measured weekly. For intraperitoneal glucose tolerance tests, glucose solution was injected intraperitoneally (2 g/kg) after fasting for 4 h, and blood glucose levels were determined at 0, 30, and 120 min. Islets were isolated from T3-treated and control rats at postnatal day 7 and reported as in vivo.
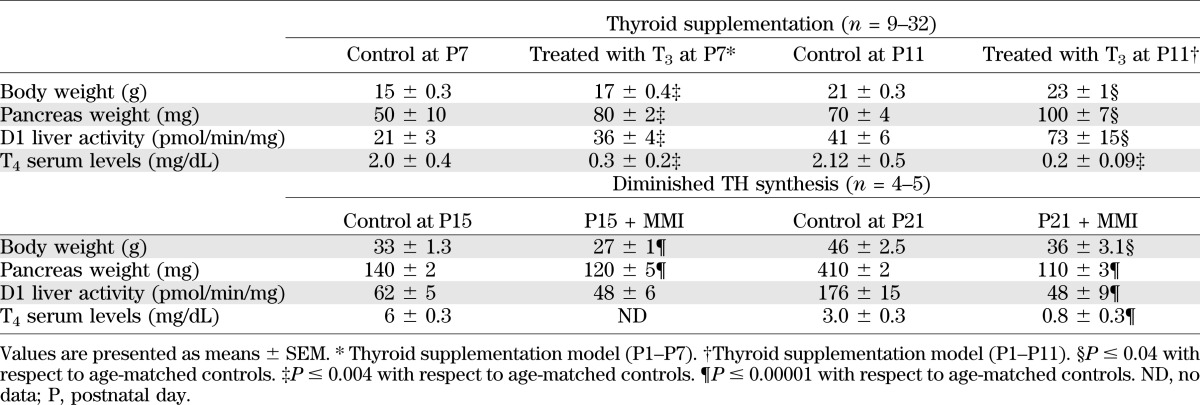
The effectiveness of treatments was evaluated by growth parameters, T4 levels, and deiodinase activity when the animal was killed (23) (Table 1). Hepatic D1 activity was measured in 5- to 20-mg liver homogenate with 10 mmol/L dithiothreitol and 1 μmol/L 125IrT3 for 60 min. Background levels were determined by the addition of 1 mmol/L propylthiouracil (20).
TABLE 1.
Effects of thyroid supplementation or diminished TH synthesis with or without partial replacement on body and pancreatic weight and an index of thyroid status
Islet culture: Hormone treatment and adenoviral infection.
At postnatal day 7 or 9, islets were cultured for 4 days in RPMI-1640 medium (20 mmol/L glucose and 10% charcoal-stripped [CS] FBS) with T3 (150 pmol/L, equivalent to 7.5 pmol/L free T3 in 10% CS-FBS [24]) for RNA or insulin secretion assays. As an alternative, islets at postnatal day 9 were cultured for 2 days in RPMI-1640 medium in 10% FBS with dexamethasone (50 pmol/L) for RNA.
To test the specificity of MAFA as the mechanism of T3 effect, islets at postnatal day 7 were totally dispersed and cultured in RPMI-1640 medium (20 mmol/L glucose, 10% CS-FBS) with or without T3 (7.5 pmol/L free T3) and with or without adeno-CMV-DN Mafa-Ires-Gfp (DN-Mafa) (25,26) (MOI 2) or control adeno-CMV-Ires-Gfp (Ad-Gfp). Reaggregated islets were cultured for 4 days for secretion or RNA.
Insulin secretion in vitro.
Insulin secretion was measured by static sequential incubation in 2.6 mmol/L and 16.8 mmol/L glucose in Krebs-Ringer bicarbonate buffer (16 mmol/L HEPES and 0.1% BSA; pH 7.4), as previously described (27). Supernatants and cells were frozen until assayed. As an alternative, we measured insulin secretion of single β cells using the reverse hemolytic plaque assay (7,28) in which secreted insulin is revealed by the presence of hemolytic plaques around secreting cells. The percentage of insulin-secreting cells forming plaques and the area of the plaques were measured and multiplied to calculate the secretion index, a measure of the overall secretory activity of β cells.
Quantitative real-time PCR.
Total RNA was isolated with a PicoRNA extraction kit (Arcturus) and reverse transcribed (SuperScript reverse transcriptase, Invitrogen, Grand Island, NY). Real-time quantitative PCR used SYBR green detection and specific primers (Supplementary Table 1). Samples were normalized to a control gene (S25), and the comparative threshold cycle method used to calculate levels of gene expression.
Immunostaining.
Paraffin sections were incubated at 4°C overnight with primary antibodies listed in Supplementary Table 2. Apoptosis was assessed by TUNEL staining using the In Situ Cell Death Detection Kit, Fluorescein (Roche, Indianapolis, IN) after retrieval of microwave antigen. DAPI was used for nuclear staining.
For each antigen, all images were taken with the same settings in confocal mode using a Zeiss LSM 410 or LSM 710 microscope and were handled similarly in Adobe Photoshop; at least two animals per age were examined.
Morphometric evaluation.
Images covering entire whole pancreatic sections were collected using the LSM 710 tile-scan system. For MAFA nuclear staining, insulin-positive cells were scored as high, low, or undetected nuclear MAFA. Data from four or five individual animals were averaged; between 36 and 58 islets were sampled for each age. For proliferation and apoptosis, insulin-positive and Ki-67-positive or TUNEL-positive cells were counted in 160–327 islets and 2,764–6,189 cells per group; data from individual animals (n = 3–5) were averaged. β-Cell mass was calculated by multiplying the relative area of β cells by the pancreatic weight (29). The densitometric mean of the intensity of MAFA staining was calculated using the AxioVision Measure feature and were considered a reflection of protein levels (n = 6–7 animals per group). Cross-sectional area of the β cell was used as an indicator for cell size and was determined by dividing the number of nuclei in a given insulin-positive area; 7,000–8,794 nuclei were counted among four animals in each group.
Cell line culture.
INS-1 cells maintained in RPMI-1640 medium containing 11 mmol/L glucose + 10% FCS, 10 mmol/L HEPES, 2 mmol/L l-glutamine, penicillin/streptomycin, 1 mmol/L sodium pyruvate, and 20 mmol/L β-mercaptoethanol were switched to RPMI-1640 medium containing 1.6 mmol/L glucose + 10% CS-FBS 24 h before treatment and then were kept for 14 h in T3 (150 pmol/L) and actinomycin D (5 mg/mL). MIN-6 cells, maintained in high-glucose Dulbecco’s modified Eagle’s medium (DMEM) supplemented with 15% FBS, were switched to high-glucose DMEM with 15% CS-FBS and T3 (10 nmol/L) for 24 h; they then were harvested for ChIP or to assess the effect of MMI (1.5 mmol/L, 0.15 mmol/L, and 0.015 mmol/L) on gene transcription.
For the luciferase reporter construct, a 10-Kb Nhe1-Fse1 fragment from the BAC mouse genomic library clone 128L24 spanning the mouse Mafa promoter to downstream of the transcription start site was cloned into HindIII-BglII cut –238 wild-type luciferase plasmid (30). Renilla luciferase in a SacI backbone was used as a transfection control. For transient transfections, MIN-6 cells were transfected using lipofectamine and 7 μg of final DNA and grown in high-glucose DMEM with/without 100 nmol/L T3 for 24 h.
ChIP assay.
Rabbit anti-THR (TRa/b, Santa Cruz FL-408×) was used with the Imprint ChIP kit (Sigma Aldrich, St. Louis, MO; CHP1) by following manufacturer’s instructions. DNA from 250,000 cells was used for each condition in four independent experiments. Samples were analyzed by quantitative PCR using specific primers for three putative thyroid response elements (TREs; S1, S2, and S3) (Supplementary Table 1) and were run on gels.
Gel-mobility shift assay (EMSA).
Nuclear extracts were obtained from HEK1 cells transfected with Thrb, or untransfected cells as controls, using the NucBuster Protein Extraction Kit (Novagen, EMD Biosciences, San Diego, CA) following the manufacturer’s instructions. Twenty micrograms of nuclear extract were incubated with 80 pmol/L of double-stranded oligonucleotides, reproducing the potential TRE S3 in the rat Mafa gene or the reported TRE of D1 (31) at room temperature for 30 min. The reaction buffer for binding was 75 mmol/L Tris (pH 7.8), 264 mmol/L potassium chloride, 1.5 mmol/L EDTA, 30 mmol/L β-mercaptoethanol, 30% glycerol, and 1.2 mg/mL BSA. In some of the binding assays, anti-THRB antiserum (Affinity Bioreagents, Golden, CO) or a random antibody were added 1 h before addition of the DNA probes. After the binding reactions, samples were analyzed by separation on 10% polyacrylamide gel in 1× Tris-acetate-EDTA buffer followed by 40 min of staining with SYBR green EMSA nucleic acid gel stain (Molecular Probes).
Data analysis.
Data are shown as mean ± SEM. For statistical analysis, unpaired Student t tests were used to compare two groups, and one-way ANOVA followed by a Bonferroni post hoc test were used to compare more than two groups. A P value <0.05 was considered statistically significant.
RESULTS
Postnatal glucose and insulin levels change concurrently with expression of TH, deiodinases, and THR.
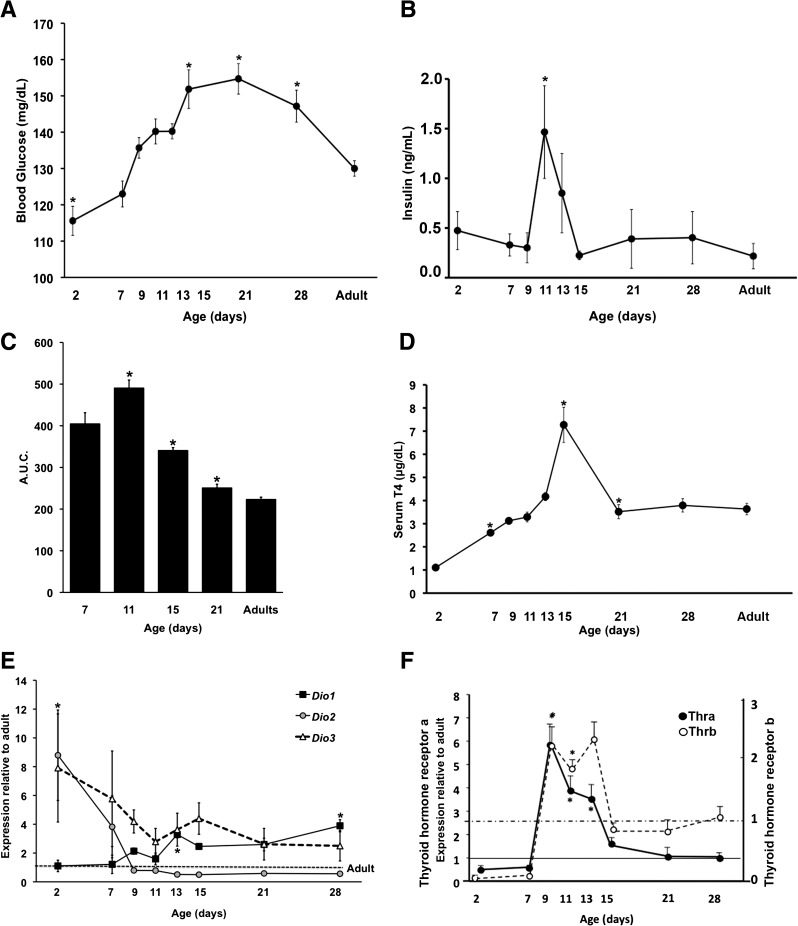
Blood glucose levels at postnatal day 2 were significantly lower than levels in adults (Fig. 1A), but they increased, peaking at postnatal day 21 at a level 20% higher than that of adults. Perhaps as a result of rising plasma glucose levels and as part of the functional maturation process of β cells, plasma insulin levels peaked at postnatal day 11, with levels threefold higher than in newborns or adults (Fig. 1B). During the first postnatal month (Fig. 1C), the rate of glucose disposal evaluated by the area under the curve (AUC) of intraperitoneal glucose tolerance test was progressively enhanced; that at postnatal days 7 and 11 were slower (high AUC values) than at later ages. Adult values were not yet achieved by postnatal day 21.
FIG. 1.
Metabolism and thyroid status change over the first postnatal month. Values shown as means ± SEM. A: Fed blood glucose (n = 5–27 animals per age; *P < 0.0001); B: plasma insulin (n = 4 animals per age; *P < 0.04). AUC for intraperitoneal glucose tolerance test (C) and serum T4 (D) seen at different ages; n = 5–27 animals per age, *P < 0.0001 with respect to the previous age in C and D. Deiodinase (Dio1, type 1; Dio2, type 2; Dio3, type 3) (E) and thyroid receptor isoform mRNA (F) over the same time course by quantitative PCR; the same samples are used for both. Data are expressed as -fold change with respect to adult levels (10 weeks old) using S25 as the internal control gene (n = 4–6 samples per age, each pooled from 3–10 animals; *P ≤ 0.0001).
For TH to physiologically regulate the functional development of β cells, its serum level and the tissue regulation of biologically active T3 must be sufficient and its receptors must be expressed by β cells. Serum T4, the principal circulating TH, steadily increased over the first 2 weeks, peaking at about twice adult levels at postnatal day 15 before falling to adult levels by postnatal day 21 (Fig. 1D). Because tissue concentrations of T3 are determined by deiodinases as well as by serum T3, we measured the islet expression of deiodinases Dio1, Dio2, and Dio3 transcripts during postnatal development (Fig. 1E). Dio1 mRNA in islets increased throughout the postnatal period; its positive regulation by TH provides an increased paracrine supply of T3 as the islet develops. In contrast, expression of both Dio2 and Dio3 fell during the postnatal period.
D1 and D3 proteins were examined by immunostaining (Supplementary Fig. 1) in pancreas from animals at postnatal day 7 and adult animals. The small number of islets obtained from rats at postnatal day 7 precludes protein quantification using Western blots. However, careful titration of antibody, parallel staining, and confocal imaging allowed assessment of protein levels by differences in intensity. Islet D1 protein was much lower at postnatal day 7 than in adults (Supplementary Fig. 1A), although its mRNA level did not differ. This discrepancy might reflect developmental differences in the synthesis of selenoproteins that occur downstream of transcription (32). In contrast, D3 (Supplementary Fig. 1B) had very strong cytoplasmic localization in islets at postnatal day 7 and became almost undetectable in adult islets.
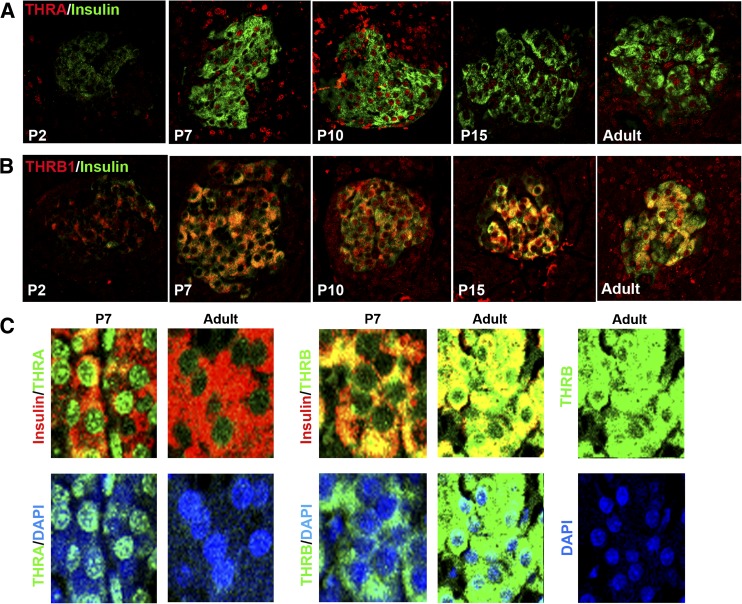
As serum T4 increased, islet expression of thyroid receptors increased at both mRNA and protein levels. Thra mRNA increased sharply between postnatal days 7 and 9; they were sixfold higher in islets at postnatal day 9 than in adults (Fig. 1F) and decreased to adult levels by postnatal day 15. By immunostaining (Fig. 2A), nuclear THRA protein (both the T3-binding THRA1 and the non-T3-binding THRA2 isoforms are recognized by the antibody) increased from postnatal day 7 to day 10 but became much lower by adulthood (Fig. 2C). Similarly, Thrb mRNA increased between postnatal days 7 and 9 and decreased to adult levels by postnatal day 15 (Fig. 1F). THRB protein also increased by postnatal day 7 but was mainly cytoplasmic; nuclear THRB localization was seen only by postnatal day 15 and increased in the adult (Fig. 2B and C). Comparison of mRNA expression of Thra and Thrb in islets (Supplementary Fig. 2) shows a change in predominant receptor isoform through development: Thra predominates at early ages, Thra and Thrb are equal from postnatal day 9 to 15, after which Thrb becomes the predominant isoform in islets.
FIG. 2.
Changing pattern of THR isoform proteins over the neonatal period shown by immunostaining. THRA protein (A, red) and THRB1 protein (B, red) in insulin-expressing (green) β cells change in intensity and location from postnatal day (P) 2 to adult. C: (top) Nuclear localization of THRA or THRB (green) in insulin-positive cells (red) shown at a higher magnification and costained with nuclear stain DAPI (blue); C: (bottom) red channel deleted for visualization of THR. Representative confocal images taken in parallel at the same settings for each protein so the differences in intensity reflect the differences in protein. n = at least three animals per group.
T3 supplementation until postnatal day 7 accelerated metabolic development.
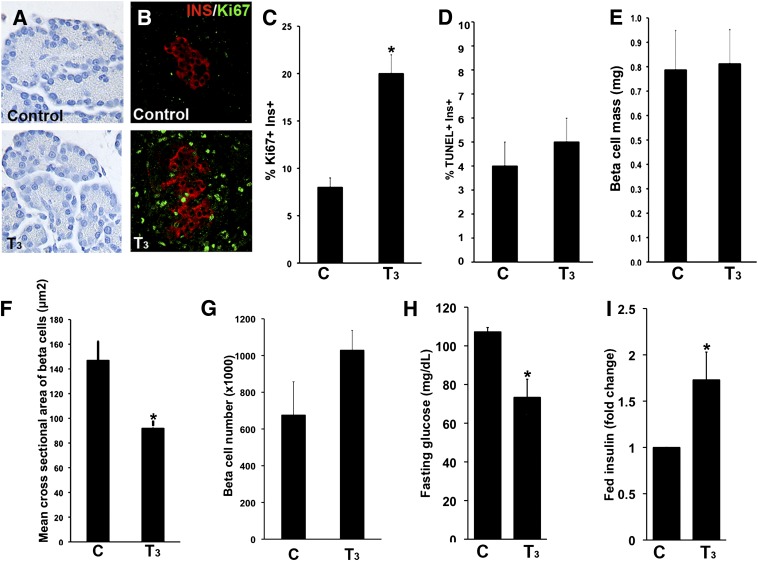
To analyze the direct effects of TH, newborn rats were injected with T3 from postnatal days 1 to 7. As expected, this supplementation increased body and pancreatic weights, reduced T4 levels (because of suppression of thyrotropin by T3), and increased D1 activity in the liver (Table 1). The pancreas of animals treated with T3 had greater density of both acinar and islet cells (Fig. 3A), greater β-cell proliferation (20% vs. 8% Ki-67+insulin+ cells in untreated animals) (Fig. 3B and C), and no change in the frequency of apoptotic β cells (Fig. 3D). Their β-cell mass was unchanged (Fig. 3E), but their β cells were smaller (Fig. 3F), with no significant change in the number of cells (Fig. 3G). Fasting glucose levels were lower (Fig. 3H) and fed plasma insulin levels elevated (Fig. 3I), but their response to intraperitoneal glucose tolerance tests were not different (data not shown). These results show that T3 supplementation enhanced the functional development of β cells.
FIG. 3.
In vivo T3 treatment from birth until postnatal day (P) 7 affects pancreatic structure, β-cell dynamics, and glucose homeostasis. Representative pictures of acinar cell density (A, hematoxylin stained) and replicating β cells (B, insulin [red] and Ki-67 [green]) in pancreatic sections from T3-treated and control rats at P7. β-Cell proliferation (Ki-67+; n = 160–327 islets) (C); apoptosis (TUNEL staining; n = 160–178 islets) (D); β-cell mass (n = 6–7 animals) (E); mean cross-sectional area (cell size; n = 7,000–8,794 cells per condition) (F); calculated number of β cells per pancreas (n = 3–4 animals) (G); fasting blood glucose (n = 8–9 animals) (H); and fed plasma insulin (n = 21–22 animals; controls: 0.4 ± 0.03 vs. T3 treated: 0.5 ± 0.04 ng/mL) (I) levels for T3-treated and control animals at P7. Values shown as mean ± SEM; *P < 0.01 with respect to untreated animals.
Inhibition of TH synthesis delayed pancreatic development.
Animals treated with MMI from birth until postnatal day 15 or 21 were confirmed as having hypothyroidism because of delayed growth with lower body and pancreatic weights, decreased circulating T4 (due to inhibition of TH synthesis from the thyroid gland), and decreased activity of D1 in the liver (Table 1). At postnatal day 15 there was no change in pancreatic cell density (Supplementary Fig. 3A), β-cell proliferation (Supplementary Fig. 3C) or β-cell mass (Supplementary Fig. 3B). However, animals treated with MMI at postnatal days 15 and 21 had lower fasting blood glucose levels than their untreated age-matched controls (Supplementary Figs. 3D and 4A), similar to that of younger animals (Fig. 1A). Compared with untreated controls, plasma insulin levels of animals treated with MMI were lower at postnatal day 15 (Supplementary Fig. 3E) but were fivefold higher at postnatal day 21 (Supplementary Fig. 4B); values were similar to those at postnatal day 11, when plasma insulin levels peak (Fig. 1B). The gradual postnatal development of glucose clearance was delayed by inhibiting T4 synthesis (Supplementary Fig. 3G and Fig. 1C). Animals treated with MMI at postnatal day 21 had glucose clearance similar to untreated animals at postnatal day 7 (Fig. 1C). Animals treated with MMI at postnatal day 15 were not as affected, possibly because of shorter treatment and differences in T3 sensitivity of other glucose-disposing tissues. Overall, the lack of TH during the postnatal period delayed the development of efficient glucose disposal.
Local regulation of TH action in postnatal rat islets by T3 or MMI treatment.
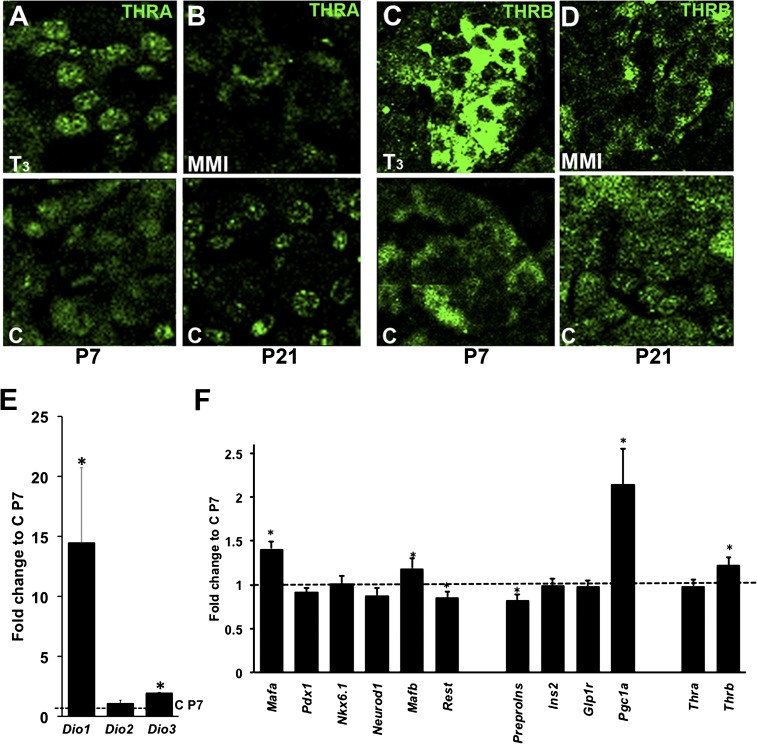
Systemic changes in TH status can be regulated by local changes in T3 concentrations by deiodinases in target tissues. Changing levels and isoforms of thyroid receptors also potentially regulate local TH effects. Islets from animals treated with T3 at postnatal day 7 had increased nuclear THRA (Fig. 4A) and cytoplasmic THRB protein (Fig. 4C), suggesting more functional receptors. In animals treated with MMI at postnatal day 21 (Fig. 4B and D), both THRA and THRB had the nonfunctional cytoplasmic localization typical of younger ages. Deiodinase changes also reflected the hormonal status, with increased Dio1 and Dio3 mRNAs in islets after T3 treatment (Fig. 4E) and reduced Dio1 and Dio3 and elevated Dio2 mRNA levels (Supplementary Fig. 3F) after MMI treatment until postnatal day 21. This confirmation that normal neonatal changes in deiodinases and thyroid receptors were replicated by external manipulation of TH status suggests that the endogenous events are causally related to the TH status.
FIG. 4.
T3 treatment results in differential changes of thyroid receptor proteins and islet gene expression. Islets from T3-treated and untreated animals at postnatal day (P) 7 immunostained for THRA (A) and THRB (C) or from MMI-treated rats at P21 stained for THRA (B) and THRB (D). Representative confocal images were taken at the same settings for each protein so differences in intensity reflect differences in protein. At least three animals each group. Changes in Dio1, Dio2, and Dio3 (n = 3) (E) and key islet gene (n = 18) (F) mRNA in islets isolated from T3-treated and untreated control pups by quantitative PCR at P7. Values shown as mean ± SEM; *P < 0.05 with respect to control animals at P7.
In vivo T3 modulation affected Mafa gene expression and its protein nuclear translocation.
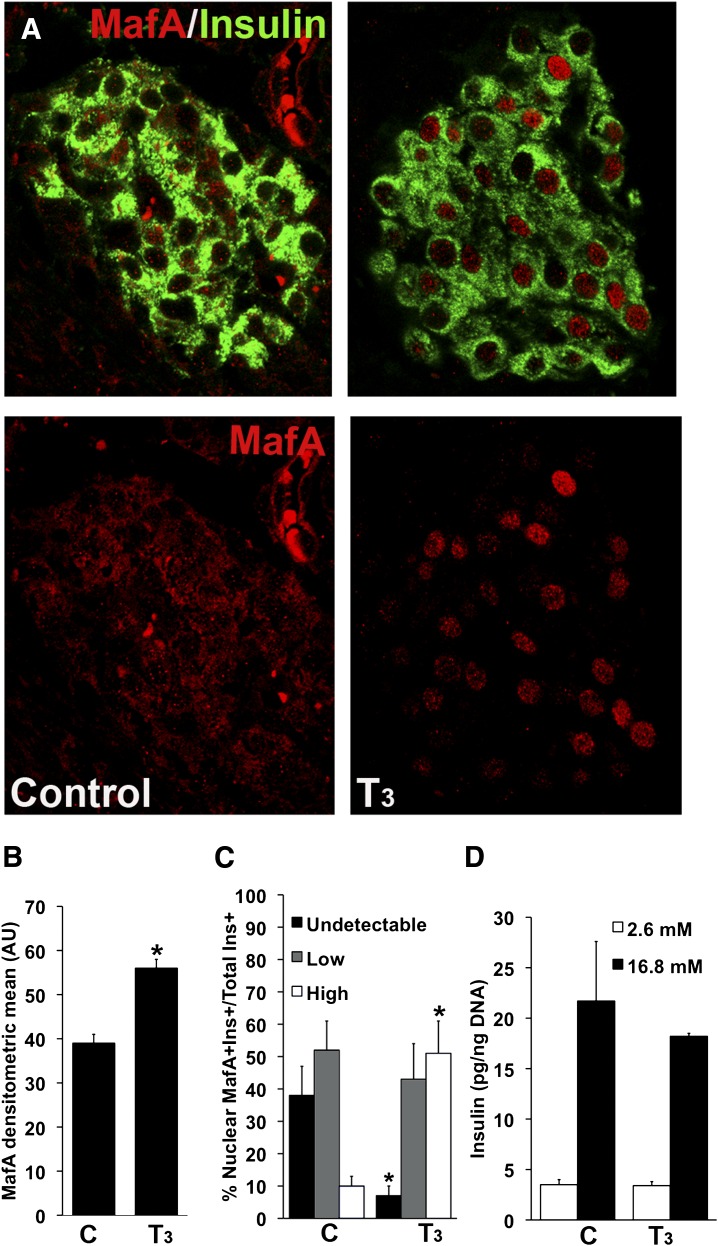
Islet transcriptional profile changed with in vivo T3 treatment (Fig. 4E and F): Mafa, Mafb, Pgc1a (peroxisome proliferator–activated receptor γ coactivator-1 α), and Thrb mRNA increased; Pdx1 and Neurod1 mRNA were unchanged; and Rest (RE1-silencing transcription factor) mRNA decreased. In contrast, Mafa decreased at postnatal day 15 with MMI treatment (Supplementary Fig. 5D and Supplementary Table 3); partial T3 supplementation reversed this decrease. Mafb, preproinsulin, Ins2, Glp1r, and Thra mRNAs increased and Rest mRNA decreased in P15 islets (Supplementary Table 3). Rest, Thra, and Thrb mRNAs increased at postnatal day 21 (Supplementary Table 3). Insulin staining was more intense in the T3-treated group and less intense in MMI-treated animals (Fig. 5A).
FIG. 5.
In vivo T3 treatment increased Mafa expression and enhanced its nuclear localization but did not increase glucose-stimulated insulin secretion. A: Representative images from T3-treated and control animals at postnatal day (P) 7 immunostained for insulin (green) and MAFA (red); bottom panels show only the red channel for MAFA visualization. B: Intensity was quantified as densitometric mean of MAFA staining from at least three animals per group. C: Nuclear localization of MAFA in islets of animals treated with T3 increased compared with untreated controls at P7. Quantification of 600–2,200 insulin+ cells from four or five animals for each group. D: Glucose-stimulated insulin secretion in static incubations of islets freshly isolated from in vivo T3-treated animals at P7 or control animals (n = 5–6 experiments). Values shown as mean ± SEM; *P < 0.02 with respect to controls.
T3 supplementation increased MAFA protein both in nuclear location (Fig. 5A) and amount (Fig. 5B). In pups treated with T3 at postnatal day 7, 93% of β cells had nuclear MAFA compared with only 62% in untreated pups (Figs. 5A and C); 51% of T3-treated pups had MAFAhigh nuclear staining compared with 10% of untreated animals. The observed effect of T3 on MAFA translocation could be an indirect effect mediated by altering the redox state of the cell (33) through enhancement of mitochondrial function following increased expression of Pgc1a (Fig. 4C). It is surprising that even with the increased nuclear expression of MAFA, glucose-stimulated insulin secretion was not increased in islets from T3-treated animals (Fig. 5D). In contrast, hypothyroidism at postnatal day 15 decreased Mafa mRNA levels (Supplementary Fig. 5D) and protein (Supplementary Fig. 5A and B) without changes in location (Supplementary Fig. 5C). MMI treatment also decreased β-cell function as estimated by homeostasis model assessment-B index (Supplementary Fig. 5E) (18). The direct effect of MMI on transcription was ruled out because no significant changes were found in the above genes after culturing MIN-6 cells in the presence of MMI (Supplementary Fig. 5F).
In vitro T3 specifically increased Mafa mRNA and improved glucose-stimulated insulin secretion.
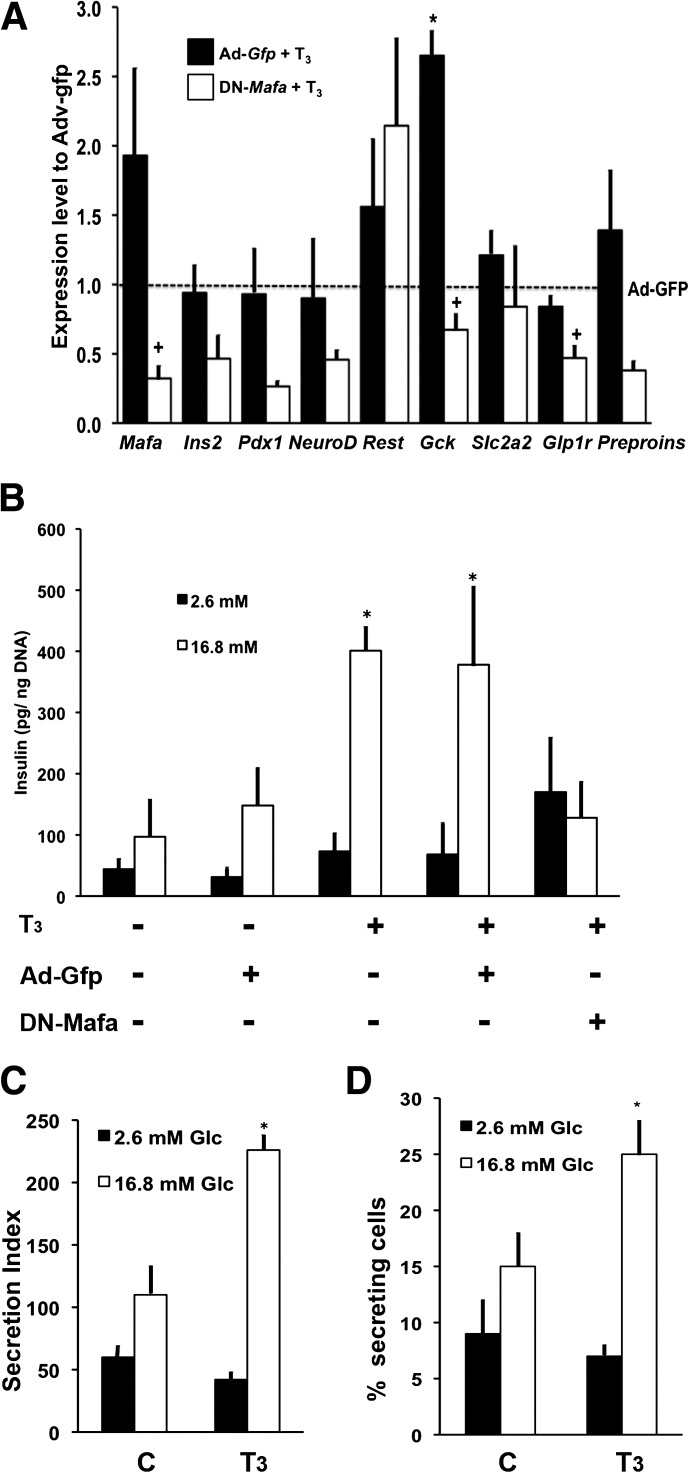
Because the in vivo data may be confounded by the effects on insulin sensitivity by thyrotoxicosis or hypothyroidism (14), we developed an in vitro system to directly test whether increasing Mafa was the mechanism mediating the T3-maturation effect. DN MAFA lacks an N-terminal transactivation domain and can form heterodimers with endogenous MAFA, impairing its ability to activate target genes (25). In T3-treated Ad-Gfp transduced islets, Mafa mRNA increased significantly (Fig. 6A), confirming the in vivo T3 results (Fig. 4F); glucokinase mRNA also increased. It is important to note that these increases were absent in T3-treated islets infected with Ad-DN-Mafa, indicating a specific role of MAFA in T3-mediated effects. Interestingly, the T3-induced Mafa increase was inhibited in the presence of DN-Mafa, suggesting a positive feedback mechanism of MAFA upon its own expression.
FIG. 6.
In vitro T3 selectively increased Mafa mRNA and enhanced glucose-stimulated insulin secretion. A: Culture for 4 days with T3 (7.5 pmol/L free T3) induced changes in key islet mRNA levels in islets isolated from animals at postnatal day (P) 7 and infected with either control Ad-Gfp (black bars) or DN Mafa (white bars) as normalized to those of Ad-Gfp without T3 treatment. (*P < 0.04 respect to Ad-Gfp; +P < 0.05 respect to Ad-Gfp+T3; n = 4–7). B: Insulin secretion from similarly infected and cultured islets at P7 in response to 2.6 mmol/L glucose (black bars) and 16.8 mmol/L glucose (white bars) in sequential static incubations (seven experiments for Ad-Gfp +T3 and four for Ad-Gfp +T3 +DN-Mafa; *P < 0.04 with respect to Ad-Gfp). C: T3-enhanced glucose-responsive insulin secretion was confirmed by reverse hemolytic plaque assay for individual cell secretion, showing an increased percentage of insulin-secreting cells (D) (three experiments; *P ≤ 0.006 with respect to 2.6 mmol/L glucose). Values shown as mean ± SEM.
In vitro T3-treatment induced glucose-stimulated insulin secretion. In static incubations at postnatal day 7, islets, whether untreated or Ad-Gfp infected, had little response to 16.8 mmol/L glucose (Fig. 6B), whereas T3-treated islets, both uninfected and Ad-Gfp infected, had insulin secretion increased 5.5-fold (Fig. 6B). This effect also was abolished in the presence of Ad-DN-Mafa. Using the reverse hemolytic plaque assay to evaluate insulin secretion from individual β cells (Fig. 6C), the effect of T3 on glucose responsiveness was shown to result from an increased proportion of insulin-secreting cells (Fig. 6D).
Glucocorticoids inhibit the effects of T3 on glucose-stimulated insulin secretion.
Paradoxically, glucose-stimulated insulin secretion was not increased in islets from animals treated with T3 in vivo (Fig. 5D), as was expected from our in vitro studies (7) and those described earlier. However, T3 affects the maturation of other tissues, including the adrenal gland (34), so the blunted in vivo glucose responsiveness may have resulted from increased glucocorticoids. In untreated animals, circulating corticosterone was quite low after birth and increased only modestly by postnatal day 15 and then surged to adult levels (Supplementary Fig. 6A). Glucocorticoid receptor mRNA in islets remained unchanged from embryonic day 20.5 to postnatal day 28 (Supplementary Fig. 6B). However, with T3 supplementation, corticosterone levels at postnatal day 7 were twice the normal values and were comparable with those at postnatal day 11 (Supplementary Fig. 6C). In contrast, after MMI treatment, corticosterone levels were reduced at postnatal day 21 (Supplementary Fig. 6D). These data indicate a rapid T3-dependent change in adrenal function that could affect in vivo islet function over the neonatal period.
To assess whether increased glucocorticoids explained the difference in functional maturation of in vitro and in vivo T3 treatments, islets at postnatal day 9 were cultured for 48 h with T3, dexamethasone, or both. In islets cultured with T3 alone, Mafa mRNA was increased significantly (Supplementary Fig. 6E), consistent with islets from animals treated with T3 at postnatal day 7 (Figs. 4F and 6A). However, in islets cultured in the presence of dexamethasone, with or without T3, Mafa levels remained unchanged and Pdx1 mRNA was significantly suppressed compared with untreated controls (Supplementary Fig. 6E). Insulin secretion was blunted in similarly cultured islets at postnatal day 9 (Supplementary Fig. 6F). These results suggest that islets from animals treated with T3 in vivo lacked enhanced glucose-stimulated insulin secretion due to the counter effects of increased glucocorticoids.
T3 directly enhanced Mafa transcription.
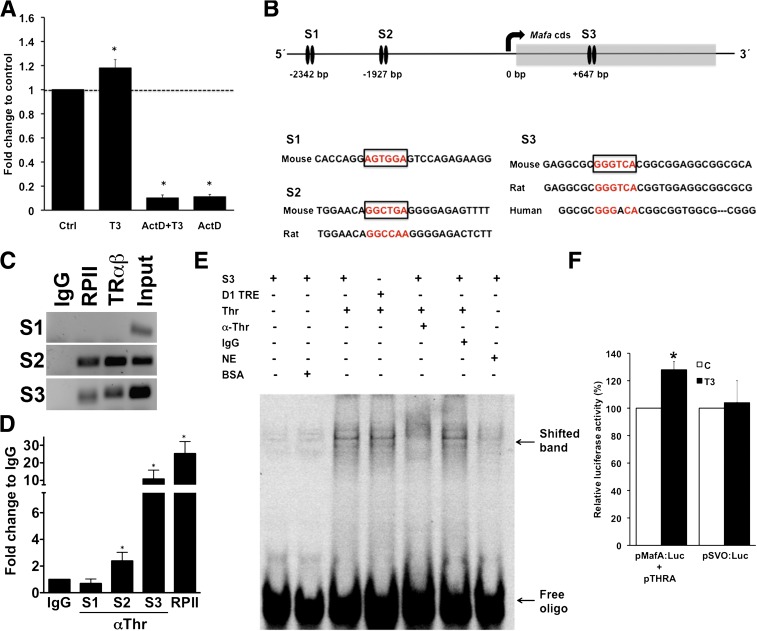
To analyze the mechanism by which T3 regulates Mafa expression, we used β-cell lines (INS-1 and MIN-6), both of which express THRA and THRB (data not shown). T3 increased Mafa mRNA transcriptionally rather than by enhancing its stability, as shown by a 90% inhibition of Mafa mRNA in the presence of transcription inhibitor actinomycin D (Fig. 7A).
FIG. 7.
T3 directly enhanced Mafa transcription. A: Increase of Mafa mRNA induced in INS-1 cells by T3 was ablated by incubation with actinomycin D (ActD). Culture with T3 in 1.6 mmol/L glucose for 6 h (values shown as mean ± SEM; *P < 0.03; n = 3–6 independent experiments). B: Schema of the murine Mafa promoter and coding sequence. The top arrow indicates the transcription start site. The black ovals indicate the experimentally tested TRE sites by ChIP: site 1 (S1), site 2 (S2), and site 3 (S3). The TREs are localized at −2,342/–2,354, −1,927/–1,946 and +647/+659. The amplified sequences are shown as is their conservation in other species. S1 is not conserved in humans or rats, whereas S2 is conserved in rats but not in humans. C: In ChIP studies of MIN-6 cells using an antibody against THR, putative TREs from S2 and S3 showed direct binding of the THR, but no binding was evident at S1. Gel representative of three or four experiments. D: Quantitative PCR products from ChIP-amplified DNA with corresponding IgG, RPII, and input. (values shown as mean ± SEM; *P < 0.03; n = 3–4 controls). E: Electrophoretic mobility shift assay showing a band observed in the presence of HEK1 nuclear extract from cells transfected with Thr expression plasmid that was inhibited upon incubation with antibody against. S3, potential TRE Site 3 in Mafa cds; NE, nontransfected nuclear extract; D1 TRE, known TRE in Dio1 promoter; IgG, unspecific antibody; α-THR, antibody against Thr. F: A dual luciferase reporter assay using a firefly luciferase reporter construct with the 5′ Mafa promoter region in MIN-6 cells grown in high-glucose DMEM +/− 100 nmol/L T3 for 24h. Renilla luciferase in a SacI backbone was used as a transfection control (values shown as mean ± SEM; *P < 0.01; n = 3). (A high-quality color representation of this figure is available in the online issue.)
For T3 to have direct effect on Mafa transcription, THR must bind to TREs. Using AliBaba 2.1 software, we found potential TRE motifs in the proximal promoter and coding sequence of mouse Mafa and designed quantitative PCR primers for them (Supplementary Table 1). In ChIP assay with MIN-6 cells (Fig. 7B–D), S2 had 2-fold and S3 had 10-fold enrichment with respect to IgG, indicating both were TREs. Further evidence of binding of THR to S3 is provided by EMSA, in which a band observed in the presence of HEK1 nuclear extract from cells transfected with Thr expression plasmid was inhibited upon incubation with antibody against THR (Fig. 7E), suggesting a specific disruption of the THR:S3 interaction. In addition, in a luciferase assay using a reporter construct containing the Mafa gene 5′-promoter region (S3 was not included) (Fig. 7F), T3 induced a significant increase of luciferase activity, indicating S2 is active in the presence of T3 and increases Mafa transcription. The modest size of the increase in luciferase activity is primarily the result of the lack of the S3 site in the construct and the high basal Mafa/luciferase expression in the MIN-6 cells, limiting the impact of T3 on the transcription of Mafa/luc gene. Overall, these results indicate that T3 regulates Mafa transcription through direct receptor-ligand interaction.
DISCUSSION
Previously we showed that overexpression of Mafa in neonatal islets to approximately adult Mafa mRNA levels induced glucose-responsive insulin secretion and thus the functional maturation of β cells (7). The data presented here support TH as a physiological regulator of Mafa expression and postnatal functional maturation of β cells. Increased expression of THR and increased serum T4 levels accompanied the increased Mafa mRNA between postnatal days 7 and 9. Islets treated with T3 in vitro at postnatal day 7 showed increased glucose responsiveness with a greater proportion of responsive β cells. Importantly, expression of DN-MAFA blocked secretion of glucose-responsive insulin and the increased Mafa mRNA. These data, along with our previous work (7), indicate that T3 induction of glucose responsiveness was dependent on MAFA. Moreover, the thyroid receptor directly interacts with two putative TREs in the Mafa gene. In vivo manipulation of TH (treatment with T3 or MMI) resulted in the expected change in Mafa expression, demonstrating the importance of this mechanism during normal physiological development.
TH is a known regulator of development in different tissues, yet its developmental effects on β-cell function have not been described. Previous studies showed that the T3-THRA complex enhanced proliferation of RINm5f cells (35) and that THRA knockout mice had greater whole-body insulin sensitivity (36). We now show that Mafa is a direct target of TH in β cells. The physiological importance of T3 regulation of islet development is underscored by our in vivo models of T3 modulation.
Although a postnatal switch of thyroid receptor isoforms has been described in the heart, dorsal root ganglia, and sciatic nerve with Thra characteristic of immature tissues and Thrb characteristic of functionally mature tissues (37,38), such an isoform switch had not been previously described for β cells. Comparison of the relative mRNA expression of the isoforms shows that Thra predominates at early ages, that both Thra and Thrb are equal from postnatal days 9 to 15, and that Thrb becomes the predominant isoform in adult islets. At the protein level, β cells expressed both THRA and THRB at postnatal day 7, but the “immature” isoform THRA had nuclear localization between postnatal days 7 and 15, whereas the THRB isoform was mainly cytoplasmic, suggesting that THRA mediates TH effects on β cells during the early postnatal period. THRB showed nuclear translocation only at postnatal day 15, which was when T3 plasma levels peaked. Nucleocytoplasmic shuttling of both THRA and THRB have been described in other cell types (39–41) and can be mediated by T3 in an energy-dependent process (39); their nuclear export is considered passive (40), but it is unclear why there is differential shuttling of the two isoforms.
We also showed that the effects T3 has on other tissues could influence the observed phenotype. The surprising absence of glucose-stimulated insulin secretion in islets from pups treated with T3 until postnatal day 7 was likely due to the accelerated maturation of the adrenal gland induced by T3. At birth the adrenal lacks full function, and circulating corticosterone increases only gradually after postnatal day 7 until about postnatal day 15, when a surge occurs (10). Size of the adrenal gland and circulating corticosterone levels previously have been directly related to circulating T3 levels (42). In our studies, corticosterone levels doubled in animals that received T3 supplementation and significantly decreased in those in which T4 synthesis was inhibited. Even low concentrations of dexamethasone decreased Pdx1 mRNA and blocked the stimulatory effects of T3 on Mafa mRNA and insulin secretion.
In conclusion, we have shown that TH is a physiological regulator of β-cell maturation, a process mediated through direct interaction of THR and the Mafa promoter. In vitro, the active hormone T3 increased glucose-stimulated insulin secretion and potentially could have a similar maturation role for in vitro stem cell–derived β cells. Identification of additional physiological regulators that drive β-cell maturation and glucose responsiveness should lead to effective strategies for developing fully mature in vitro–derived β cells for replacement therapy for diabetes.
Supplementary Material
ACKNOWLEDGMENTS
This study was supported by grants from the National Institutes of Health (NIH R01 DK 66056 and DK 93909 [S.B.-W.], R01 DK 60127 [A.S.], DK 36256 [P.R.L.], DK 076117 [A.M.Z.], P30 DK36836 Joslin Diabetes and Endocrinology Research Center (DERC) Advanced Microscopy Core) and by JDRF Grant 1-2011-591 (S.B.-W.). This work was also supported by the Diabetes Research and Wellness Foundation, the Graetz Fund, and an important group of private donors. C.A.-M. was partially supported by the Sheenan Family Fellowship and the Mary Iaccoca Fellowship; A.M. was supported by Harvard College Research Program and the National Institute of Diabetes and Digestive and Kidney Diseases Short-Term Education Program for Underrepresented Persons (STEP-UP).
No potential conflicts of interest relevant to this article were reported.
C.A.-M. and S.B.-W. conceived the project and wrote the manuscript. C.A.-M., A.M.Z., A.Mari., J.H.-L., I.E.K., and A.Mars. researched data. A.M.Z., G.C.W., A.S., and P.R.L., provided critical discussions and edited the manuscript. All authors reviewed the manuscript. S.B.-W. is the guarantor of this work and, as such, had full access to all of the data in the study and takes responsibility for the integrity of the data and the accuracy of the data analysis.
Parts of this study were presented in abstract format (as posters and oral presentations) at the 70th Scientific Sessions of the American Diabetes Association, Orlando, Florida, 25–29 June 2010; 71st Scientific Sessions of the American Diabetes Association, San Diego, California, 24–28 June 2011; and the 72nd Scientific Sessions of the American Diabetes Association, Philadelphia, Pennsylvania, 8–12 June 2012.
The authors thank Christopher Cahill (Joslin Diabetes Center) for his expert technical assistance.
Footnotes
This article contains Supplementary Data online at http://diabetes.diabetesjournals.org/lookup/suppl/doi:10.2337/db12-0849/-/DC1.
REFERENCES
- 1.Kroon E, Martinson LA, Kadoya K, et al. Pancreatic endoderm derived from human embryonic stem cells generates glucose-responsive insulin-secreting cells in vivo. Nat Biotechnol 2008;26:443–452 [DOI] [PubMed] [Google Scholar]
- 2.D’Amour KA, Bang AG, Eliazer S, et al. Production of pancreatic hormone-expressing endocrine cells from human embryonic stem cells. Nat Biotechnol 2006;24:1392–1401 [DOI] [PubMed] [Google Scholar]
- 3.Jiang J, Au M, Lu K, et al. Generation of insulin-producing islet-like clusters from human embryonic stem cells. Stem Cells 2007;25:1940–1953 [DOI] [PubMed] [Google Scholar]
- 4.Baetge EE. Production of beta-cells from human embryonic stem cells. Diabetes Obes Metab 2008;10(Suppl 4):186–194 [DOI] [PubMed] [Google Scholar]
- 5.Bliss CR, Sharp GW. Glucose-induced insulin release in islets of young rats: time-dependent potentiation and effects of 2-bromostearate. Am J Physiol 1992;263:E890–E896 [DOI] [PubMed] [Google Scholar]
- 6.Jermendy A, Toschi E, Aye T, et al. Rat neonatal beta cells lack the specialised metabolic phenotype of mature beta cells. Diabetologia 2011;54:594–604 [DOI] [PMC free article] [PubMed] [Google Scholar]
- 7.Aguayo-Mazzucato C, Koh A, El Khattabi I, et al. Mafa expression enhances glucose-responsive insulin secretion in neonatal rat beta cells. Diabetologia 2011;54:583–593 [DOI] [PMC free article] [PubMed] [Google Scholar]
- 8.Henning SJ. Postnatal development: coordination of feeding, digestion, and metabolism. Am J Physiol 1981;241:G199–G214 [DOI] [PubMed] [Google Scholar]
- 9.Walker P, Dubois JD, Dussault JH. Free thyroid hormone concentrations during postnatal development in the rat. Pediatr Res 1980;14:247–249 [DOI] [PubMed] [Google Scholar]
- 10.Henning SJ. Plasma concentrations of total and free corticosterone during development in the rat. Am J Physiol 1978;235:E451–E456 [DOI] [PubMed] [Google Scholar]
- 11.Yamanouchi H, Kitauchi S, Shiino M. Changes in prolactin secretion in postnatal rats and effect of neonatal thyroidectomy. Mol Cell Endocrinol 1997;134:101–107 [DOI] [PubMed] [Google Scholar]
- 12.Misiti S, Anastasi E, Sciacchitano S, et al. 3,5,3′-Triiodo-l-thyronine enhances the differentiation of a human pancreatic duct cell line (hPANC-1) towards a beta-cell-like phenotype. J Cell Physiol 2005;204:286–296 [DOI] [PubMed] [Google Scholar]
- 13.Maciejewski ML, Reiber GE, Smith DG, Wallace C, Hayes S, Boyko EJ. Effectiveness of diabetic therapeutic footwear in preventing reulceration. Diabetes Care 2004;27:1774–1782 [DOI] [PubMed] [Google Scholar]
- 14.Song Y, Yao X, Ying H. Thyroid hormone action in metabolic regulation. Protein Cell 2011;2:358–368 [DOI] [PMC free article] [PubMed] [Google Scholar]
- 15.Zhang J, Lazar MA. The mechanism of action of thyroid hormones. Annu Rev Physiol 2000;62:439–466 [DOI] [PubMed] [Google Scholar]
- 16.Lee JT, Lebenthal E, Lee PC. Rat pancreatic nuclear thyroid hormone receptor: characterization and postnatal development. Gastroenterology 1989;96:1151–1157 [DOI] [PubMed] [Google Scholar]
- 17.Zinke A, Schmoll D, Zachmann M, et al. Expression of thyroid hormone receptor isoform alpha1 in pancreatic islets. Exp Clin Endocrinol Diabetes 2003;111:198–202 [DOI] [PubMed] [Google Scholar]
- 18.Wallace TM, Levy JC, Matthews DR. Use and abuse of HOMA modeling. Diabetes Care 2004;27:1487–1495 [DOI] [PubMed] [Google Scholar]
- 19.Gotoh M, Maki T, Satomi S, et al. Reproducible high yield of rat islets by stationary in vitro digestion following pancreatic ductal or portal venous collagenase injection. Transplantation 1987;43:725–730 [DOI] [PubMed] [Google Scholar]
- 20.Zavacki AM, Ying H, Christoffolete MA, et al. Type 1 iodothyronine deiodinase is a sensitive marker of peripheral thyroid status in the mouse. Endocrinology 2005;146:1568–1575 [DOI] [PubMed] [Google Scholar]
- 21.Silva JE, Larsen PR. Comparison of iodothyronine 5′-deiodinase and other thyroid-hormone-dependent enzyme activities in the cerebral cortex of hypothyroid neonatal rat. Evidence for adaptation to hypothyroidism. J Clin Invest 1982;70:1110–1123 [DOI] [PMC free article] [PubMed] [Google Scholar]
- 22.Lima FR, Gervais A, Colin C, Izembart M, Neto VM, Mallat M. Regulation of microglial development: a novel role for thyroid hormone. J Neurosci 2001;21:2028–2038 [DOI] [PMC free article] [PubMed] [Google Scholar]
- 23.Maia AL, Harney JW, Larsen PR. Pituitary cells respond to thyroid hormone by discrete, gene-specific pathways. Endocrinology 1995;136:1488–1494 [DOI] [PubMed] [Google Scholar]
- 24.Samuels HH, Stanley F, Casanova J. Relationship of receptor affinity to the modulation of thyroid hormone nuclear receptor levels and growth hormone synthesis by l-triiodothyronine and iodothyronine analogues in cultured GH1 cells. J Clin Invest 1979;63:1229–1240 [DOI] [PMC free article] [PubMed] [Google Scholar]
- 25.Olbrot M, Rud J, Moss LG, Sharma A. Identification of beta-cell-specific insulin gene transcription factor RIPE3b1 as mammalian MafA. Proc Natl Acad Sci U S A 2002;99:6737–6742 [DOI] [PMC free article] [PubMed] [Google Scholar]
- 26.Wang H, Brun T, Kataoka K, Sharma AJ, Wollheim CB. MAFA controls genes implicated in insulin biosynthesis and secretion. Diabetologia 2007;50:348–358 [DOI] [PMC free article] [PubMed] [Google Scholar]
- 27.Schuppin GT, Bonner-Weir S, Montana E, Kaiser N, Weir GC. Replication of adult pancreatic-beta cells cultured on bovine corneal endothelial cell extracellular matrix. In Vitro Cell Dev Biol Anim 1993;29A:339–344 [DOI] [PubMed] [Google Scholar]
- 28.Aguayo-Mazzucato C, Sanchez-Soto C, Godinez-Puig V, Gutiérrez-Ospina G, Hiriart M. Restructuring of pancreatic islets and insulin secretion in a postnatal critical window. PLoS One 2006;1:e35. [DOI] [PMC free article] [PubMed] [Google Scholar]
- 29.Bonner-Weir S. beta-cell turnover: its assessment and implications. Diabetes 2001;50(Suppl 1):S20–S24 [DOI] [PubMed] [Google Scholar]
- 30.Kondo T, El Khattabi I, Nishimura W, et al. p38 MAPK is a major regulator of MafA protein stability under oxidative stress. Mol Endocrinol 2009;23:1281–1290 [DOI] [PMC free article] [PubMed] [Google Scholar]
- 31.Toyoda N, Zavacki AM, Maia AL, Harney JW, Larsen PR. A novel retinoid X receptor-independent thyroid hormone response element is present in the human type 1 deiodinase gene. Mol Cell Biol 1995;15:5100–5112 [DOI] [PMC free article] [PubMed] [Google Scholar]
- 32.Bianco AC, Salvatore D, Gereben B, Berry MJ, Larsen PR. Biochemistry, cellular and molecular biology, and physiological roles of the iodothyronine selenodeiodinases. Endocr Rev 2002;23:38–89 [DOI] [PubMed] [Google Scholar]
- 33.Harmon JS, Bogdani M, Parazzoli SD, et al. beta-Cell-specific overexpression of glutathione peroxidase preserves intranuclear MafA and reverses diabetes in db/db mice. Endocrinology 2009;150:4855–4862 [DOI] [PMC free article] [PubMed] [Google Scholar]
- 34.Zawalich WS, Tesz GJ, Yamazaki H, Zawalich KC, Philbrick W. Dexamethasone suppresses phospholipase C activation and insulin secretion from isolated rat islets. Metabolism 2006;55:35–42 [DOI] [PubMed] [Google Scholar]
- 35.Furuya F, Shimura H, Yamashita S, Endo T, Kobayashi T. Liganded thyroid hormone receptor-alpha enhances proliferation of pancreatic beta-cells. J Biol Chem 2010;285:24477–24486 [DOI] [PMC free article] [PubMed] [Google Scholar]
- 36.Martin K, Wallace P, Rust PF, Garvey WT. Estimation of resting energy expenditure considering effects of race and diabetes status. Diabetes Care 2004;27:1405–1411 [DOI] [PubMed] [Google Scholar]
- 37.Stoykov I, Zandieh-Doulabi B, Moorman AF, Christoffels V, Wiersinga WM, Bakker O. Expression pattern and ontogenesis of thyroid hormone receptor isoforms in the mouse heart. J Endocrinol 2006;189:231–245 [DOI] [PubMed] [Google Scholar]
- 38.Glauser L, Barakat Walter I. Differential distribution of thyroid hormone receptor isoform in rat dorsal root ganglia and sciatic nerve in vivo and in vitro. J Neuroendocrinol 1997;9:217–227 [DOI] [PubMed] [Google Scholar]
- 39.Zhu XG, Hanover JA, Hager GL, Cheng SY. Hormone-induced translocation of thyroid hormone receptors in living cells visualized using a receptor green fluorescent protein chimera. J Biol Chem 1998;273:27058–27063 [DOI] [PubMed] [Google Scholar]
- 40.Baumann CT, Maruvada P, Hager GL, Yen PM. Nuclear cytoplasmic shuttling by thyroid hormone receptors. multiple protein interactions are required for nuclear retention. J Biol Chem 2001;276:11237–11245 [DOI] [PubMed] [Google Scholar]
- 41.Bunn CF, Neidig JA, Freidinger KE, et al. Nucleocytoplasmic shuttling of the thyroid hormone receptor alpha. Mol Endocrinol 2001;15:512–533 [DOI] [PubMed] [Google Scholar]
- 42.Tohei A. Studies on the functional relationship between thyroid, adrenal and gonadal hormones. J Reprod Dev 2004;50:9–20 [DOI] [PubMed] [Google Scholar]
Associated Data
This section collects any data citations, data availability statements, or supplementary materials included in this article.


