

Abstract
Fish oils (FOs) have anti-inflammatory effects and lower serum triglycerides. This study examined adipose and muscle inflammatory markers after treatment of humans with FOs and measured the effects of ω-3 fatty acids on adipocytes and macrophages in vitro. Insulin-resistant, nondiabetic subjects were treated with Omega-3-Acid Ethyl Esters (4 g/day) or placebo for 12 weeks. Plasma macrophage chemoattractant protein 1 (MCP-1) levels were reduced by FO, but the levels of other cytokines were unchanged. The adipose (but not muscle) of FO-treated subjects demonstrated a decrease in macrophages, a decrease in MCP-1, and an increase in capillaries, and subjects with the most macrophages demonstrated the greatest response to treatment. Adipose and muscle ω-3 fatty acid content increased after treatment; however, there was no change in insulin sensitivity or adiponectin. In vitro, M1-polarized macrophages expressed high levels of MCP-1. The addition of ω-3 fatty acids reduced MCP-1 expression with no effect on TNF-α. In addition, ω-3 fatty acids suppressed the upregulation of adipocyte MCP-1 that occurred when adipocytes were cocultured with macrophages. Thus, FO reduced adipose macrophages, increased capillaries, and reduced MCP-1 expression in insulin-resistant humans and in macrophages and adipocytes in vitro; however, there was no measureable effect on insulin sensitivity.
The development of type 2 diabetes represents a complex series of events that begins with the development of insulin resistance. The changes in adipose tissue that accompany obesity, the metabolic syndrome, and insulin resistance include increased adipose tissue macrophages, circulating inflammatory markers such as tumor necrosis factor-α (TNF-α) and interleukin (IL)-6 (1–3), and the development of a chronic inflammatory state. In addition to the infiltration of macrophages, other changes occur in the adipose tissue of obese, insulin-resistant subjects, including an increase in extracellular matrix (ECM) components, such as collagen VI, thrombospondin, and collagen V and a decrease in elastin (4–7). Along with adipocyte expansion, changes in the adipose vasculature have been described, including a decrease in capillaries and an increase in larger blood vessels (7,8), leading to the hypothesis that adipocyte necrosis and inflammation develop as a result of adipocyte expansion into a relatively hypoxic, nonelastic ECM (9).
Fish oils (FOs) are rich sources of ω-3 polyunsaturated fatty acids (ω-3 PUFAs), and there is a large amount of literature on the potential benefits of FOs on lowering serum triglycerides, cardiovascular protection, and immune modulation. There is considerable evidence supporting the anti-inflammatory effects of ω-3 PUFAs (10), and FOs may be an adjunct in the treatment of rheumatoid arthritis, inflammatory bowel disease, and asthma (11,12). Although the mechanism of this effect is complex, part of the anti-inflammatory action involves an inhibition of the production of eicosanoids from arachadonic acid (13). In addition, a number of studies have demonstrated that FOs have a peroxisome proliferator–activated receptor γ (PPARγ)–like effect (14). PPARγ agonist drugs, such as the thiazolidinediones, improve insulin sensitivity and have anti-inflammatory properties. Previous studies have demonstrated thiazolidinedione-mediated reductions in plasma inflammatory markers and adipose tissue macrophages and an increase in blood adiponectin (15–18). Although the effects of FOs on adipose inflammation are unknown, previous studies have generally not found that FOs improve insulin sensitivity in humans (19).
This study was performed to determine whether FOs would ameliorate the adipose tissue inflammation, fibrosis, and vascular abnormalities that are found in subjects with obesity and insulin resistance. After 12 weeks of treatment with standard clinical doses of ω-3 PUFAs, we found a decrease in adipose tissue macrophages, an increase in adipose capillaries, and a decrease in macrophage chemoattractant protein 1 (MCP-1) levels.
RESEARCH DESIGN AND METHODS
Human subjects.
Nondiabetic subjects with either impaired glucose tolerance, impaired fasting glucose, or at least three features of the metabolic syndrome were recruited. The participants signed consent forms that were approved by the institutional review boards from either the University of Arkansas for Medical Sciences or the University of Kentucky. Participants were excluded for any history of coronary disease, history of inflammatory disease, or the chronic use of any anti-inflammatory medication or other medication likely to change adipocyte metabolism. No subjects were consuming ω-3 PUFA supplements or excessive quantities of foods containing ω-3 PUFAs. A baseline food history questionnaire was administered, and no subject was consuming >0.7 g/day of total ω-3 PUFAs, and <2% of the ω-3 PUFAs were from marine sources. Baseline measures included oral glucose tolerance test, serum lipids, thyroid function, and routine laboratories (liver enzymes, creatinine, and electrolytes) to exclude type 2 diabetes or other chronic conditions. If subjects met the inclusion criteria, insulin sensitivity was measured with a frequently sampled intravenous glucose tolerance test, as described previously (7,20,21). This test yields a robust index of insulin sensitivity (SI) that correlates well with the glucose disposal rate from the euglycemic clamp (22). All participants underwent an incisional abdominal adipose biopsy in order to remove ∼4 g of tissue and a needle muscle biopsy. Subjects were then randomized to receive either Omega-3-Acid Ethyl Esters (LOVAZA, FO), 4 g/day, or identically packaged placebo (corn oil). FO and matching placebo tablets were supplied by GlaxoSmithKline (Research Triangle Park, NC). The subjects were unaware of their drug/placebo assignment and reported no gastrointestinal side effects or “fish taste.”
Of the 34 participants, 23 had either impaired glucose tolerance or impaired fasting glucose and 22 were women. Table 1 shows the clinical features of the subjects that were randomized into either the FO or placebo group. There were no significant differences between the groups in BMI, age, sex, SI, lipids, or glucose. The mean BMI was 33 kg/m2 in both groups (range, 27–43). Hypertriglyceridemia was not a criteria for selection into the study, and mean fasting triglycerides were 163 ± 23 and 150 ± 7.6 mg/dL in the placebo and FO groups, respectively.
TABLE 1.
Baseline characteristics of the subjects

Plasma cytokines.
Plasma cytokines were measured using Luminex assays, using the Milliplex cytokine high sensitivity assay, the human metabolic hormone assay, and adipokine A assay kits. Total and high-molecular-weight adiponectin were measured using a multimeric adiponectin ELISA kit (Alpco, Salem, NH).
Histochemistry and immunohistochemistry.
As described previously (5), adipose samples were fixed in Bouin’s solution, paraffin embedded, and cut into 5-μm-thick sections. After a series of xylene/alcohol washes, the slides were stained, dehydrated, and mounted in cytoseal (Richard-Allan Scientific, Kalamazoo, MI). To assess fibrosis in adipose tissue, a Masson’s trichrome stain (Trichrome Stain Kit, HT15; Sigma-Aldrich) was used, along with staining for collagen VI (rabbit biotinylated anti-human ColVI, C7510-61Z; US Biological) (5). Quantification of fibrosis was performed as previously described (7), using National Institutes of Health ImageJ on the composite photographed images to identify the stained areas in relation to the entire area. Macrophages were identified in the adipose tissue using an antibody to CD68 (clone KP1; Dako) (5) and visualized using a horseradish peroxidase–conjugated secondary antibody with color development using a diaminobenzidine (DAB) substrate. Ten random fields were photographed for each sample using the 10× objective, and a macrophage counting routine was developed in ImageJ software to avoid subjectivity issues that can be introduced by manual counting. The counting routine was verified by three independent manual counts on a subset of slides under blinded conditions where the subject identity and treatment were not known (5).
The quantitation of blood vessels was performed by performing double staining for endothelial cells, using a biotin-labeled Ulex europaeus agglutinin (UEA) lectin (L8262; Sigma-Aldrich) and a monoclonal antibody to alpha smooth muscle actin (ASMA) (SC130616; Santa Cruz Biotech). Capillaries stained only with the endothelial stain, whereas larger blood vessels were identified by the ASMA ring around the endothelial cells, as described previously (7). The antigens were stained using a mixture of UEA lectin (40 μg/mL) and ASMA antibody (1:25 dilution) diluted in 2.5% horse serum (S-2012; Vector Laboratories). Each antigen was visualized in a sequential manner. UEA was developed first with streptavidin-conjugated horseradish peroxidase enzyme (SA-5004; Vector Laboratories) followed by color development using the ImmPACT NovaRED peroxidase substrate kit (SK-4805; Vector Laboratories). ASMA-bound antibody was identified with the ImmPRESS anti-mouse Ig (peroxidase) polymer detection kit (MP-7402; Vector Laboratories) and visualized using the ImmPACT SG peroxidase (SK-4705; Vector Laboratories). These dyes exhibit different spectral peaks, allowing for easy separation. Twenty random fields were photographed for each subject using the 20× objective with the Nuance multispectral camera (Caliper Life Sciences, Hopkinton, MA). This system captures a photograph of the sample at 10-nm intervals from 435 to 760 nm to build a spectral graph of the sample and allowing for separation of the spectra of each chromogenic dye. Capillaries and vessels were manually counted under blinded conditions, as described above. The number of capillaries and larger vessels were normalized to tissue surface area as measured by ImageJ software.
RNA isolation and mRNA analysis.
Total RNA was isolated from human adipose tissue using RNAeasy Lipid Tissue Mini (Qiagen, Valencia, CA), and RNA quantity and quality were verified using an Agilent 2100 Bioanalyzer (Palo Alto, CA).
Real-time RT-PCR was performed as described previously (23), where 18S RNA was used as a standard to control for differences in individual samples. The primers used for MCP-1, CD68, and 18S were described previously (23).
To obtain high-throughput measures of gene expression in response to FO treatment, we used the NanoString nCounter analysis system (NanoString Technologies, Seattle, WA) on 36 samples, including pre- and posttreatment samples from nine placebo-treated subjects and nine FO-treated subjects. NanoString allows the multiplexed measurement of up to 800 genes in one reaction (24), using two 50-bp probes, which are hybridized to the target mRNA in solution. This system does not rely on enzymatic amplification to produce cDNA and is highly sensitive and reproducible, as demonstrated in previous studies (25). To further demonstrate reproducibility, we analyzed the FO-mediated changes in MCP-1 and CD68 using both nanostring and conventional real-time RT-PCR. Similar changes were observed with both techniques, and the effect size was no different between these different methods. Comparing nanostring to real-time RT-PCR, the effect size for MCP-1 was 0.539 and 0.524, and for CD68, the effect size was 0.595 and 0.518, respectively. For these studies, we designed a custom “chip” containing 116 genes of interest (Supplementary Table 1) in adipose tissue, and data were expressed in relation to six different constitutive probes.
Measurement of adipose tissue and muscle fatty acids.
Lipids were extracted from tissues (adipose, 100 mg; muscle, 20 mg) using acidified organic solvents with the addition of 50 pmol of analysis-specific internal standards, including C15 fatty acid, synthetic glycerophospholipids incorporating a C17 fatty acid, and mass-labeled di- and triglycerides. After evaporation to dryness, the material was dissolved in 1 mL 4:1 MeOH:CHCl3, and an aliquot was removed for phosphorous determination after wet digestion in perchloric acid (26). A portion of this material was saponified using methanolic KOH, and the released fatty acids were recovered and converted to their 3-acyloxymethyl-1-methylpyridinium iodide (AMMP) derivatives (27) using methods described previously (28). In brief, the extracted saponified material was evaporated to dryness and derivatized by reaction with 2-bromo-1-methylpyridinium iodide and 3-carbinol-1-methylpyridinium iodide. AMMP derivatives were analyzed by high-performance liquid chromatography electrospray ionization tandem mass spectrometry using an ABSciex 4000 Q-Trap hybrid linear ion trap triple quadrupole mass spectrometer operated in positive mode with ion source. Instrument settings were optimized using a set of AMMP-derivatized fatty acid standards. Fatty acid molecular species were quantitated by selected ion monitoring using fatty acid species–specific precursor product ion transitions. Calibration was accomplished by reference to a set of synthetic fatty acid AMMP derivatives prepared from accurate mass standards. Where necessary, product ion spectra were generated for the most abundant species to determine the position of double bonds. For adipose tissue, data were expressed per tissue weight; although essentially identical results were obtained if expressed relative to oleate (the most abundant lipid). For muscle, the amount of available tissue was low, and tissue weight was less precise; therefore, data were normalized to oleate.
Tissue culture.
THP-1 cells were polarized to differentiate into M1, M2a, and M2c macrophages, as described previously (5). In brief, THP-1 monocytes were differentiated into M1 macrophages using 100 ng/mL lipopolysaccaride (R&D Systems, Minneapolis, MN) and 20 ng/mL INF-γ (R&D Systems), and into M2 macrophages using 25 nmol/L phorbol ester (12-O-tetradecanoylphorbol-13-acetate) (Sigma-Aldrich, St. Louis, MO), followed by 20 ng/mL of either IL-4 (R&D Systems) for M2a or IL-10 (R&D Systems) for M2c. Adipocytes were obtained by induction of the differentiation of adult-derived human adipocyte stem cells (ADHASC), as described previously (29). In brief, preadipocytes were obtained by collagenase digestion, and differentiation was induced 2 days postconfluence using differentiation medium (DMEM:Ham’s F-10 vol/vol 1:1, 3% FBS [Invitrogen], 15 mmol/L HEPES, pH 7.4 [Invitrogen], 33 μmol/L biotin [Sigma-Aldrich], 17 μmol/L pantothenate [Sigma-Aldrich], 1 μmol/L dexamethazone [Sigma-Aldrich], 0.25 mmol/L isobutylmethylxanthine [Sigma-Aldrich], 1 × 10⁻⁷ mol/L insulin [Novo Nordisk, Clayton, NC], and 1 μmol/L rosiglitazone [SmithKline Beecham, Philadelphia, PA]) for 3 days.
For coculture experiments, polarized macrophages were grown on a plate with ADHASC cells grown on inserts so that both shared the same medium. After coculture for 24 h, the wells (macrophages) and the inserts (adipocytes) were separated and RNA was extracted. Docosahexanoic acid (DHA; 22:5, n-3, 100 μmol/L) (Cayman Chemical, Ann Arbor, MI), to mimic the effect of FO in vivo, was conjugated to fatty acid–free BSA, as previously described (30), and added to the medium of macrophage/adipocyte cocultures in six-well plates. Control cultures contained 0.1% ethanol as a vehicle control.
Statistical analysis.
All data from samples were expressed as mean ± SEM. Two-sample Student t tests were used to compare groups with respect to continuous variables. Pearson correlation coefficients were used to describe the linear association between variables. SI was not normally distributed and therefore was analyzed on a log scale.
RESULTS
The effects of drug or placebo treatment on standard clinical outcomes are shown in Table 2. Although the subjects in this study demonstrated modestly elevated baseline triglycerides, there was a small but significant decrease in triglycerides in the FO treatment group and no change with placebo, and there were no other significant changes in serum lipids between the groups. The oral glucose tolerance test was performed before and after treatment, and 23 subjects were either impaired glucose tolerance or impaired fasting glucose before randomization. After FO or placebo treatment, no changes were observed in fasting or 2-h glucose, insulin sensitivity (SI), or first-phase insulin secretion (AIRglu) (measured using the frequently sampled intravenous glucose tolerance test) in either group.
TABLE 2.
Changes in clinical parameters with treatment

Previous studies have demonstrated that erythrocyte ω-3 PUFA content is altered by FO administration (31), but fewer studies have examined adipose tissue or muscle levels of ω-3 fatty acids in response to treatment. To characterize adipose tissue and muscle lipid content and determine the impact of the treatment groups, tissue total lipids were analyzed using mass spectrometry, as described in research design and methods. The distribution of total adipose and muscle lipids is shown in Supplementary Table 2. The vast majority of adipose tissue lipid was oleate (18:1, n-9), palmitate (16:0), and linoleate (18:2, n-6); the ω-3 PUFA linolenic acid, eicosapenanoic acid (EPA), and DHA constituted 1.1, 0.26, and 0.40% (by weight) of adipose lipids, respectively. In muscle, the relative abundance of lipids was somewhat different, with proportionally more of the saturated lipids palmitate and stearate and very low levels of EPA and DHA (Supplementary Table 2). Figure 1 shows the response of adipose and muscle EPA and DHA to FO and placebo treatments. All subjects treated with FO demonstrated an increase in tissue EPA and DHA, whereas there was no change in the placebo-treated subjects. Further, the FO-treated subjects demonstrated no changes in any other fatty acid. Although the placebo-treated subjects were receiving 4 g/day of corn oil, which is composed predominantly of linoleate, oleate, and palmitate, there was no significant change in any lipid component in the adipose tissue or muscle in these subjects.
FIG. 1.

FO treatment increased adipose and muscle EPA and DHA. Adipose (A) and muscle (B) lipids were analyzed in biopsy samples before and after treatment with FO or placebo. There were no significant changes in the placebo-treated subjects, and data are expressed in relation to oleate, which is abundant in both tissues. The changes in EPA and DHA were significant (P < 0.05) compared with baseline and with placebo-treated subjects. Data are expressed as mean ± SEM.
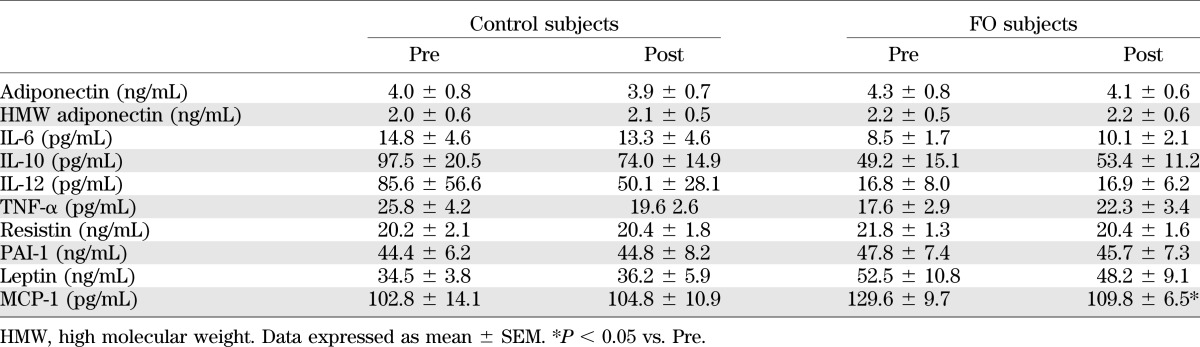
Table 3 illustrates the measurements of a number of different blood adipokine levels. Previous studies have demonstrated that FO can invoke a PPARγ effect in vitro, and when given to animals (18,32). However, in these subjects, no changes in adiponectin were observed. In addition, no changes in the levels of IL-6, IL-10, IL-12, TNF-α, resistin, PAI-1, or leptin were noted. However, a significant decrease in the blood MCP-1 level was observed.
TABLE 3.
Changes in plasma cytokines
To further examine changes in inflammation, fibrosis, and vascularity, adipose tissue and muscle from the FO- and placebo-treated subjects were examined using histochemistry and immunohistochemistry. As shown in Fig. 2, there was a significant decrease in macrophage number in adipose after FO treatment and no change with placebo. Crown-like structures are clusters of macrophages, often involving giant cells, surrounding a necrotic adipocyte (large arrow in Fig. 2). After FO treatment, there was a significant decrease in crown-like structures, but there was no change in placebo-treated subjects. Macrophage number was also assessed in muscle, and no significant changes were observed in either group (data not shown).
FIG. 2.

Effects of FO treatment on adipose macrophages and capillaries. Before and after treatment with FO, adipose tissue from biopsies was analyzed histochemically. A: CD68 staining. A representative image showing macrophages (small arrows) and crown-like structures (large arrow). Data are expressed as mean ± SEM. B: Effects of FO and placebo on macrophage number (*P < 0.05 vs. pretreatment). C: Effects of treatment on the number of crown-like structures (CLS) (*P < 0.05 vs. pretreatment). D: Capillary and large vessels were identified by staining with lectin and α-smooth muscle actin, and representative images are shown. E: Effects of placebo and FO on the number of capillaries in adipose tissue.
Previous studies have found that the adipose from obese, insulin-resistant subjects contained fewer capillaries and more large vessels than lean, insulin-sensitive subjects (7,8). To determine whether the treatment of subjects with FO altered vascularity, adipose tissue capillaries and larger vessels were quantified. As shown in Fig. 2, there was a small but consistent and significant increase in adipose capillaries, with no change in placebo-treated subjects. The number of large blood vessels was unchanged in both groups. There were no significant changes in muscle capillaries after FO treatment (data not shown).
The adipose tissue of obese, insulin-resistant subjects contains more collagen VI, along with other changes in the ECM (5–7). The overall degree of fibrosis in the adipose tissue of FO- and placebo-treated subjects was examined using histochemistry. No changes in overall fibrosis or collagen VI were noted (data not shown).
To analyze changes in gene expression in adipose tissue, RNA was extracted from the adipose tissue of FO- and placebo-treated subjects. As shown in Fig. 3, there were significant changes in MCP-1 and CD68 mRNA levels in the whole group of subjects. Although there was an overall decrease in adipose tissue macrophages after FO, there was considerable variation between subjects, which was strongly related to the degree of adipose tissue inflammation at baseline. As shown in Fig. 4A, the baseline adipose tissue macrophage number was strongly correlated with the change in macrophage number after FO treatment, suggesting that the subjects with the most inflammation benefitted the most from FO treatment.
FIG. 3.

Changes in gene expression in adipose tissue after FO treatment. A: MCP-1. B: CD68. *P < 0.05 vs. pretreatment. Data are expressed as mean ± SEM. A.U., arbitrary units.
FIG. 4.

Correlation between the number of macrophages in adipose at baseline, and the change after FO treatment. A: Change in macrophage number was associated with baseline macrophages. The expression of other genes was significantly associated with the change in macrophage number, and these include CTGF (B), IL-8 (C), and TIMP-2 (D). All correlations are significant at P < 0.05. A.U., arbitrary units.
To obtain a broader view of gene expression changes in response to FO, 116 genes (Supplementary Table 1) involving various aspects of inflammation, ECM, and vascularity were analyzed using NanoString in nine placebo and nine FO-treated subjects. Somewhat surprisingly, despite a significant decrease in macrophage number, and an increase in capillaries, there were no significant changes in gene expression, except for the previously described changes in MCP-1 and CD68. Specifically, there were no significant changes in the expression of the classic adipokines, including TNF-α, IL-1, IL-12, and IL-6. Although there were no net changes, the expression of several genes varied with the changes in macrophage number. For example, the change in expression of CTGF, IL-8, and TIMP-2 correlated significantly with the change in macrophage number with FO treatment (Fig. 4). CTGF and TIMP-2 decreased in parallel with a decrease in macrophage number, whereas IL-8 increased in subjects who demonstrated the greatest decrease in macrophages.
FO in adipose could directly affect macrophages or adipocytes, or could be secondary to other systemic effects. To examine a direct effect, THP-1 cells were polarized into M1, M2a, and M2c macrophages, as described in Research Design and Methods. The MCP-1 gene was highly expressed in M1 macrophages, with much lower expression by M2 macrophages (Fig. 5A). When DHA was added to cultures of M1 macrophages, there was a dose-dependent decrease in MCP-1 expression, even though there was no change in TNF-α (Fig. 5B). Further experiments were performed in M1 macrophages to determine the specificity of the effects of DHA. M1 macrophages were treated with different fatty acids: α-linolenic acid (ALA), DHA, EPA, and linoleic, oleic, and palmitic acids, all at 100 μmol/L, followed by the measurement of MCP-1 and TNF-α expression. As shown in Fig. 5C, all the ω-3 PUFAs induced a significant reduction in MCP-1 expression, and there was no effect of linoleic, oleic, or palmitic acids. In contrast, the ω-3 PUFAs had no significant effect on M1 macrophage TNF-α expression (Fig. 5D), whereas TNF-α expression was significantly increased by linoleic and palmitic acids. To examine the effects on adipocytes, ADHASC cells were induced to differentiate. Adipocytes secreted low levels of MCP-1 when cultured alone (Fig. 5A), but there was a six- to ninefold upregulation in expression in response to coculture with macrophages, and adipocyte expression of CTGF was upregulated twofold by macrophage coculture. The addition of DHA significantly diminished the expression of both MCP-1 (Fig. 5C) and CTGF (Fig. 5D) in adipocytes in coculture with each type of polarized macrophage.
FIG. 5.

Effects of DHA on adipocytes and macrophages in tissue culture. A: MCP-1 expression by adipocytes and polarized macrophages. B: Effects of the addition of increasing concentrations of DHA to TNF-α and MCP-1 expression in M1 macrophages. *P < 0.05 vs. MCP-1. The following lipids were conjugated to BSA and added at a concentration of 100 μmol/L to M1 macrophages in culture: ALA, DHA, EPA, and linoleic, oleic, and palmitic acids. After 24 h, cells were harvested followed by the measurement of expression of MCP-1 (C) and TNF-α (D). *P < 0.05 vs. control. DHA (100 μmol/L) was added to the coculture of adipocytes with polarized macrophages followed by measurement of expression of MCP-1 (E) and CTGF (F). *P < 0.05 vs. control. Data are expressed as mean ± SEM. A.U., arbitrary units.
DISCUSSION
Obesity and insulin resistance are associated with a number of changes in adipose tissue, including chronic inflammation, macrophage infiltration, decreased vascularity, and increased fibrosis (5–7). Precisely how tissue inflammation develops is not clear, although adipocyte enlargement may be an inciting event, resulting in hypoxia, adipocyte necrosis, and macrophage infiltration (8,9). There is considerable evidence demonstrating the anti-inflammatory effects of FO, and this has been the subject of several reviews (10,33). As a result of these anti-inflammatory properties of FO, a number of studies have been conducted in humans with rheumatoid arthritis, inflammatory bowel disease, and other conditions to examine a potential therapeutic use for FO, and many of these studies have favored the use of FO (11,34,35).
This study was conducted to examine the potential effects of FO on adipose inflammation in humans. Nondiabetic subjects with the metabolic syndrome and insulin resistance were randomized to either FO (4 g/day) or placebo for 12 weeks. From the adipose tissue and muscle biopsies, an increase in total EPA and DHA was noted in the FO group, but not the placebo group. The placebo tablets contained corn oil, which is composed predominantly of linoleic, oleic, and palmitic acids; however, there were no changes in the tissue content of these lipids, likely because these fatty acids are abundant in the diet.
After treatment with FO, there were remarkably few changes in clinical parameters, except for the expected decrease in plasma triglycerides. In particular, there was no significant change in insulin sensitivity or adiponectin levels. A number of studies in rodents have demonstrated a reduction in insulin resistance along with decreased plasma and/or tissue lipid levels (36), probably due to a PPARα agonist effect of ω-3 fatty acids (37). In high fat–fed rats, this reduction in tissue lipid accumulation was accompanied by an increase in adiponectin, a decrease in TNF-α, and an increase in PPARα mRNA levels (38). In addition to PPARα agonist properties, FOs have well-documented PPARγ stimulatory effects in different cell types (14), and the addition of EPA to human adipocytes resulted in an increase in PPARγ mRNA levels (39). Adiponectin is a well-described target of PPARγ activation, and FO increased adiponectin plasma levels and increased secretion from rat adipocytes through PPARγ (18,32).
Human studies, however, have not demonstrated such clear effects of FO. In patients with diabetes, FO treatment lowers blood triglycerides but does not affect glycemic control (40), as one would expect from a PPARγ agonist. A number of studies have been performed with FO, using different preparations and doses, in different subgroups of subjects. In subjects with polycystic ovary syndrome who received 3.6 g/day of total ω-3 PUFAs, there was no change in insulin sensitivity (41), and a meta-analysis of other studies concluded that ω-3 PUFAs have no significant effect on insulin sensitivity (19). Similarly with adiponectin, two recent studies have treated insulin-resistant subjects with FO and found no effects on plasma adiponectin or insulin resistance (41,42).
Based on these previous studies, and the data in this study, which reveal no significant change in insulin sensitivity, it was somewhat surprising that changes in adipose tissue were observed. As described above, FO-treated subjects demonstrated a decrease in adipose tissue macrophages, along with decreased plasma and adipose tissue MCP-1, and an increase in adipose tissue capillaries. Human adipose tissue contains both M1 and M2 macrophages, with M1 predominating in crown-like structures that increase in adipose tissue with obesity and insulin resistance (5). Treatment with FO decreased M1 macrophage abundance and the number of crown-like structures. Muscle macrophages are also associated with insulin resistance (43), but no changes in muscle macrophages were noted.
To determine whether there are direct effects of FO on adipocytes and macrophages, we examined the effects of DHA on adipocytes and macrophages in vitro. Human THP-1 monocytes were polarized in vitro and treated with DHA and other fatty acids. All the ω-3 PUFAs (ALA, DHA, and EPA) decreased MCP-1 expression in the M1 macrophages, whereas other fatty acids had no effect. This effect was relatively specific to MCP-1, since the ω-3 PUFAs had no significant effect on macrophage TNF-α. Thus, FO may not only reduce macrophage abundance in adipose but also alter the inflammatory phenotype of the remaining macrophages. In vitro coculture studies demonstrate that macrophages have dramatic effects on adipocyte gene expression, increasing proinflammatory gene products and also gene products that promote ECM accumulation, such as CTGF (5). The addition of DHA to the coculture system greatly reduced the macrophage effect on adipocytes.
Among the human subjects who were treated with FO, some demonstrated a large reduction in macrophage number and others demonstrated a much more modest response. As shown in Fig. 4, there was a very strong relationship between the number of macrophages in adipose tissue and the magnitude of the response to treatment. Changes in adipose tissue gene expression were also strongly correlated with the change in macrophage number. However, the changes in gene expression did not include typical inflammatory cytokines, such as TNF-α, IL-1, and IL-12. Instead, the expression of CTGF, TIMP-2, and IL-8 changed proportionally with the FO-induced changes in macrophage number.
In subjects who demonstrated the greatest decrease in macrophages with FO, there was an increase in IL-8 and decreases in CTGF and TIMP-2. IL-8 is induced by IL-1β and TNF-α and serves to recruit monocytes and neutrophils, but also has a potent proangiogenic function in vascular cells (44). In a recent study, IL-8 was expressed by myeloid angiogenic cells, which are phenotypically similar to M2 macrophages (45). TIMP-2 inhibits MMP-2 activity, which is necessary for the degradation of the vascular basement membrane and capillary budding. In addition, TIMP-2 interferes with VEGF angiogenic signaling independently of its effect on MMP-2 (46). Overall, these changes in IL-8 and TIMP-2 would be expected to be proangiogenic and assist with adipose tissue remodeling and could explain the increase in capillaries observed with FO.
In summary, this study examined the effects of FO treatment on adipose tissue inflammation in obese subjects with the metabolic syndrome. Although there were no changes in insulin sensitivity, adipose tissue macrophages were decreased and adipose capillaries increased in the FO-treated subjects, along with a decrease in adipose and plasma MCP-1. Relatively few additional changes in gene expression were detected; although there was evidence suggesting that subjects with the greatest degree of adipose inflammation responded most strongly to the FO treatment. These results suggest that FO treatment has direct beneficial effects on the adipose phenotype and that a more prolonged treatment may lead to improved metabolic function.
Supplementary Material
ACKNOWLEDGMENTS
This work was supported by grants DK-80327 (P.A.K.), DK-71349 (C.A.P. and P.A.K.), UL1-RR-033173 (Clinical and Translational Science Award), and P20-RR-021954 and by an investigator-initiated grant to P.K. from GlaxoSmithKline, which manufactures Omega-3-Acid Ethyl Esters and supplied the drug and matching placebo. No other potential conflicts of interest relevant to this article were reported.
GlaxoSmithKline played no role in the design, collection, analysis, or interpretation of the data.
M.S. and P.A.K. researched data and wrote the manuscript. B.S.F., R.U., B.Z., A.J.M., L.R.S., J.L., A.A., R.E., M.C., and R.E.M. researched data. R.G.W. and C.A.P. researched data and edited the manuscript. P.A.K. is the guarantor of this work and, as such, had full access to all the data in the study and takes responsibility for the integrity of the data and the accuracy of the data analysis.
The authors thank Regina Dennis (University of Arkansas for Medical Sciences) and Stacy BeBout (University of Kentucky) for their assistance with subject recruitment.
Footnotes
Clinical trial reg. no. NCT00579436, clinicaltrials.gov.
This article contains Supplementary Data online at http://diabetes.diabetesjournals.org/lookup/suppl/doi:10.2337/db12-1042/-/DC1.
REFERENCES
- 1.Weisberg SP, McCann D, Desai M, Rosenbaum M, Leibel RL, Ferrante AW., Jr Obesity is associated with macrophage accumulation in adipose tissue. J Clin Invest 2003;112:1796–1808 [DOI] [PMC free article] [PubMed] [Google Scholar]
- 2.Xu H, Barnes GT, Yang Q, et al. Chronic inflammation in fat plays a crucial role in the development of obesity-related insulin resistance. J Clin Invest 2003;112:1821–1830 [DOI] [PMC free article] [PubMed] [Google Scholar]
- 3.Kern PA, Ranganathan S, Li C, Wood L, Ranganathan G. Adipose tissue tumor necrosis factor and interleukin-6 expression in human obesity and insulin resistance. Am J Physiol Endocrinol Metab 2001;280:E745–E751 [DOI] [PubMed] [Google Scholar]
- 4.Varma V, Yao-Borengasser A, Bodles AM, et al. Thrombospondin-1 is an adipokine associated with obesity, adipose inflammation, and insulin resistance. Diabetes 2008;57:432–439 [DOI] [PMC free article] [PubMed] [Google Scholar]
- 5.Spencer M, Yao-Borengasser A, Unal R, et al. Adipose tissue macrophages in insulin-resistant subjects are associated with collagen VI and fibrosis and demonstrate alternative activation. Am J Physiol Endocrinol Metab 2010;299:E1016–E1027 [DOI] [PMC free article] [PubMed] [Google Scholar]
- 6.Pasarica M, Gowronska-Kozak B, Burk D, et al. Adipose tissue collagen VI in obesity. J Clin Endocrinol Metab 2009;94:5155–5162 [DOI] [PMC free article] [PubMed] [Google Scholar]
- 7.Spencer M, Unal R, Zhu B, et al. Adipose tissue extracellular matrix and vascular abnormalities in obesity and insulin resistance. J Clin Endocrinol Metab 2011;96:E1990–E1998 [DOI] [PMC free article] [PubMed] [Google Scholar]
- 8.Pasarica M, Sereda OR, Redman LM, et al. Reduced adipose tissue oxygenation in human obesity: evidence for rarefaction, macrophage chemotaxis, and inflammation without an angiogenic response. Diabetes 2009;58:718–725 [DOI] [PMC free article] [PubMed] [Google Scholar]
- 9.Sun K, Kusminski CM, Scherer PE. Adipose tissue remodeling and obesity. J Clin Invest 2011;121:2094–2101 [DOI] [PMC free article] [PubMed] [Google Scholar]
- 10.Calder PC. n-3 polyunsaturated fatty acids, inflammation, and inflammatory diseases. Am J Clin Nutr 2006;83(Suppl.):1505S–1519S [DOI] [PubMed] [Google Scholar]
- 11.Cleland LG, James MJ. Fish oil and rheumatoid arthritis: antiinflammatory and collateral health benefits. J Rheumatol 2000;27:2305–2307 [PubMed] [Google Scholar]
- 12.Belluzzi A, Brignola C, Campieri M, Pera A, Boschi S, Miglioli M. Effect of an enteric-coated fish-oil preparation on relapses in Crohn’s disease. N Engl J Med 1996;334:1557–1560 [DOI] [PubMed] [Google Scholar]
- 13.Thies F, Nebe-von-Caron G, Powell JR, Yaqoob P, Newsholme EA, Calder PC. Dietary supplementation with gamma-linolenic acid or fish oil decreases T lymphocyte proliferation in healthy older humans. J Nutr 2001;131:1918–1927 [DOI] [PubMed] [Google Scholar]
- 14.Deckelbaum RJ, Worgall TS, Seo T. n-3 fatty acids and gene expression. Am J Clin Nutr 2006;83(Suppl.):1520S–1525S [DOI] [PubMed] [Google Scholar]
- 15.Pajvani UB, Hawkins M, Combs TP, et al. Complex distribution, not absolute amount of adiponectin, correlates with thiazolidinedione-mediated improvement in insulin sensitivity. J Biol Chem 2004;279:12152–12162 [DOI] [PubMed] [Google Scholar]
- 16.Bodles AM, Varma V, Yao-Borengasser A, et al. Pioglitazone induces apoptosis of macrophages in human adipose tissue. J Lipid Res 2006;47:2080–2088 [DOI] [PubMed] [Google Scholar]
- 17.Phillips SA, Ciaraldi TP, Kong APS, et al. Modulation of circulating and adipose tissue adiponectin levels by antidiabetic therapy. Diabetes 2003;52:667–674 [DOI] [PubMed] [Google Scholar]
- 18.Neschen S, Morino K, Rossbacher JC, et al. Fish oil regulates adiponectin secretion by a peroxisome proliferator-activated receptor-gamma-dependent mechanism in mice. Diabetes 2006;55:924–928 [DOI] [PubMed] [Google Scholar]
- 19.Akinkuolie AO, Ngwa JS, Meigs JB, Djoussé L. Omega-3 polyunsaturated fatty acid and insulin sensitivity: a meta-analysis of randomized controlled trials. Clin Nutr 2011;30:702–707 [DOI] [PMC free article] [PubMed] [Google Scholar]
- 20.Bergman RN, Finegood DT, Ader M. Assessment of insulin sensitivity in vivo. Endocr Rev 1985;6:45–86 [DOI] [PubMed] [Google Scholar]
- 21.Boston RC, Stefanovski D, Moate PJ, Sumner AE, Watanabe RM, Bergman RN. MINMOD Millennium: a computer program to calculate glucose effectiveness and insulin sensitivity from the frequently sampled intravenous glucose tolerance test. Diabetes Technol Ther 2003;5:1003–1015 [DOI] [PubMed] [Google Scholar]
- 22.Bergman RN, Prager R, Volund A, Olefsky JM. Equivalence of the insulin sensitivity index in man derived by the minimal model method and the euglycemic glucose clamp. J Clin Invest 1987;79:790–800 [DOI] [PMC free article] [PubMed] [Google Scholar]
- 23.Di Gregorio GB, Yao-Borengasser A, Rasouli N, et al. Expression of CD68 and macrophage chemoattractant protein-1 genes in human adipose and muscle tissues: association with cytokine expression, insulin resistance, and reduction by pioglitazone. Diabetes 2005;54:2305–2313 [DOI] [PubMed] [Google Scholar]
- 24.Geiss GK, Bumgarner RE, Birditt B, et al. Direct multiplexed measurement of gene expression with color-coded probe pairs. Nat Biotechnol 2008;26:317–325 [DOI] [PubMed] [Google Scholar]
- 25.Northcott PA, Shih DJ, Remke M, et al. Rapid, reliable, and reproducible molecular sub-grouping of clinical medulloblastoma samples. Acta Neuropathol 2012;123:615–626 [DOI] [PMC free article] [PubMed] [Google Scholar]
- 26.Ren H, Federico L, Huang H, et al. A phosphatidic acid binding/nuclear localization motif determines lipin1 function in lipid metabolism and adipogenesis. Mol Biol Cell 2010;21:3171–3181 [DOI] [PMC free article] [PubMed] [Google Scholar]
- 27.Boyanovsky BB, Li X, Shridas P, Sunkara M, Morris AJ, Webb NR. Bioactive products generated by group V sPLA(2) hydrolysis of LDL activate macrophages to secrete pro-inflammatory cytokines. Cytokine 2010;50:50–57 [DOI] [PMC free article] [PubMed] [Google Scholar]
- 28.Yang WC, Adamec J, Regnier FE. Enhancement of the LC/MS analysis of fatty acids through derivatization and stable isotope coding. Anal Chem 2007;79:5150–5157 [DOI] [PubMed] [Google Scholar]
- 29.Rasouli N, Yao-Borengasser A, Varma V, et al. Association of scavenger receptors in adipose tissue with insulin resistance in nondiabetic humans. Arterioscler Thromb Vasc Biol 2009;29:1328–1335 [DOI] [PMC free article] [PubMed] [Google Scholar]
- 30.Finlin BS, Varma V, Nolen GT, et al. DHA reduces the atrophy-associated Fn14 protein in differentiated myotubes during coculture with macrophages. J Nutr Biochem 2012;23:885–891 [DOI] [PMC free article] [PubMed] [Google Scholar]
- 31.Harris WS. The omega-3 index: clinical utility for therapeutic intervention. Curr Cardiol Rep 2010;12:503–508 [DOI] [PubMed] [Google Scholar]
- 32.Banga A, Unal R, Tripathi P, et al. Adiponectin translation is increased by the PPARgamma agonists pioglitazone and omega-3 fatty acids. Am J Physiol Endocrinol Metab 2009;296:E480–E489 [DOI] [PMC free article] [PubMed] [Google Scholar]
- 33.Fritsche K. Fatty acids as modulators of the immune response. Annu Rev Nutr 2006;26:45–73 [DOI] [PubMed] [Google Scholar]
- 34.Belluzzi A. N-3 fatty acids for the treatment of inflammatory bowel diseases. Proc Nutr Soc 2002;61:391–395 [DOI] [PubMed] [Google Scholar]
- 35.Woods RK, Thien FC, Abramson MJ. Dietary marine fatty acids (fish oil) for asthma in adults and children. Cochrane Database Syst Rev 2002;3:CD001283. [DOI] [PubMed] [Google Scholar]
- 36.Lombardo YB, Chicco A, D’Alessandro ME, Martinelli M, Soria A, Gutman R. Dietary fish oil normalize dyslipidemia and glucose intolerance with unchanged insulin levels in rats fed a high sucrose diet. Biochim Biophys Acta 1996;1299:175–182 [DOI] [PubMed] [Google Scholar]
- 37.Neschen S, Moore I, Regittnig W, et al. Contrasting effects of fish oil and safflower oil on hepatic peroxisomal and tissue lipid content. Am J Physiol Endocrinol Metab 2002;282:E395–E401 [DOI] [PMC free article] [PubMed] [Google Scholar]
- 38.Svegliati-Baroni G, Candelaresi C, Saccomanno S, et al. A model of insulin resistance and nonalcoholic steatohepatitis in rats: role of peroxisome proliferator-activated receptor-alpha and n-3 polyunsaturated fatty acid treatment on liver injury. Am J Pathol 2006;169:846–860 [DOI] [PMC free article] [PubMed] [Google Scholar]
- 39.Chambrier C, Bastard JP, Rieusset J, et al. Eicosapentaenoic acid induces mRNA expression of peroxisome proliferator-activated receptor gamma. Obes Res 2002;10:518–525 [DOI] [PubMed] [Google Scholar]
- 40.Friedberg CE, Janssen MJ, Heine RJ, Grobbee DE. Fish oil and glycemic control in diabetes. A meta-analysis. Diabetes Care 1998;21:494–500 [DOI] [PubMed] [Google Scholar]
- 41.Vargas ML, Almario RU, Buchan W, Kim K, Karakas SE. Metabolic and endocrine effects of long-chain versus essential omega-3 polyunsaturated fatty acids in polycystic ovary syndrome. Metabolism 2011;60:1711–1718 [DOI] [PMC free article] [PubMed] [Google Scholar]
- 42.Koh KK, Quon MJ, Shin KC, et al. Significant differential effects of omega-3 fatty acids and fenofibrate in patients with hypertriglyceridemia. Atherosclerosis 2012;220:537–544 [DOI] [PubMed] [Google Scholar]
- 43.Varma V, Yao-Borengasser A, Rasouli N, et al. Muscle inflammatory response and insulin resistance: synergistic interaction between macrophages and fatty acids leads to impaired insulin action. Am J Physiol Endocrinol Metab 2009;296:E1300–E1310 [DOI] [PMC free article] [PubMed] [Google Scholar]
- 44.Waugh DJ, Wilson C. The interleukin-8 pathway in cancer. Clin Cancer Res 2008;14:6735–6741 [DOI] [PubMed] [Google Scholar]
- 45.Medina RJ, O’Neill CL, O’Doherty TM, et al. Myeloid angiogenic cells act as alternative M2 macrophages and modulate angiogenesis through interleukin-8. Mol Med 2011;17:1045–1055 [DOI] [PMC free article] [PubMed] [Google Scholar]
- 46.Stetler-Stevenson WG, Seo DW. TIMP-2: an endogenous inhibitor of angiogenesis. Trends Mol Med 2005;11:97–103 [DOI] [PubMed] [Google Scholar]
Associated Data
This section collects any data citations, data availability statements, or supplementary materials included in this article.