

Abstract
Background.
This study examined the association of cognitive and physical functions with age-related transition and progression of activities of daily living (ADL) disability in a population-based longitudinal cohort of nondisabled older adults.
Methods.
A longitudinal population-based cohort study of 5,317 initially nondisabled older adults with an average age of 73.6 years of an urban Chicago community were interviewed annually for up to 8 years from 2000 through 2008. Cognitive function was assessed using a standardized global cognitive score and physical function using a combination of measured walk, tandem stand, and chair stand. A novel two-part model was used to access the relationship between cognitive and physical functions and age at onset and progression of ADL disability.
Results.
The sample consisted of 5,317 participants, 65% blacks, and 61% females. Twenty-five percent reported an onset of ADL disability during follow-up. After adjusting for confounders, lower cognitive and physical functions were associated with an increased risk for lower age at onset. Lower cognitive function was longitudinally associated with increased rate of progression of disability after onset. However, lower physical function did not alter the rate of progression of ADL disability.
Conclusions.
Cognitive and physical functions were associated with age at onset. However, only cognitive function was associated with the rate of progression of ADL disability.
Keywords: Physical disability, Age at onset, Progression, Cognitive function, Physical function
Disability is generally seen as the outcome of multiple comorbid chronic conditions that affect people as they age and represents the cumulative impact of age-related conditions on a person’s ability to maintain essential activities of daily living (ADL (1)). This conceptualization has resulted in two basic approaches to investigating disability and its determinants. The first approach has emphasized maintenance of independence in the ability to live in the community or to perform basic self-care tasks. The second approach has focused on late-life disability as a progressive process that can be linked to the gradual increase in organ system pathologies and chronic disease processes (2).
Disability is a complex process with factors that influence transitions into a disabled state and factors that influence progression toward more severe levels of disability. The theoretical models of disability suggest that age-related transitions and progressive changes occur at various stages in the degenerative aging process (3,4). On the biological aspect of disability, pathology has to accumulate to a sufficient degree to produce organ dysfunction and impairment, which is often a function of age; impairment in one or multiple organs or domains has to reach a certain level of severity in order to produce functional limitations (5,6). Moreover, changes throughout this process may also be conceptualized as age-related transitions from nondisabled to disable state followed by progressive change in the number of functional limitations.
Few investigations to date have captured and systematically examined these two aspects of the disability process simultaneously (7,8). In addition, with the exception of specific demographic characteristics, such as sex and race (9), previous research has tended to consider the influence of risk factors for disability transitions or progression as age invariant, that is, the magnitude of the association between a specific risk factor and changes in disability status as constant across age (10). However, age-related degenerative transitions provide important clinical and pathological changes in the health status of older adults. Thus, in this study, we propose a two-part regression approach to model transitions to disability and progression of disability simultaneously to see if certain risk factors differentially affect transitions and progression. In addition, instead of modeling incident disability as a function of time since baseline, we model onset as age at first occurrence of disability. This allows us to more specifically characterize the influence of age on the relationship between risk factor and onset of disability.
In this investigation, we focus on two well-known determinants of aging-related disability: cognitive function and physical (or motor) function. Poor cognitive function is generally seen as a strong risk factor for late-life disability (11–14), although its potential differential impact on onset or progression has not been studied previously. Similarly, physical function is another well-established predictor of changes in disability status in older age, with better physical function being associated with lower risk of disability (15,16). In addition to these two factors, gender, race, education, body mass index, and history of chronic health conditions may influence the risk of disability among older adults (17–19) and need to be adjusted for in analyses. Therefore, in this article, we will study the role of cognitive and physical functions on the age at onset and progression after onset of disability among older adults after adjusting for above-described confounders.
METHODS
Participants
This article is based on data from the Chicago Neighborhood and Disability Study, which is a longitudinal study of a cohort of participants 65 years and older. To maintain the age distribution of the cohort, participants were added from the source population as they turned 65 years old. The main focus of this study was to investigate risk factors associated with the occurrence of disability and its change over time. The Chicago Neighborhood and Disability Study was performed from 2000 through 2008 in three adjacent neighborhoods on the south side of Chicago with study participants from the original cohort of the Chicago Health and Aging Project (20). Of the 5,935 study participants, 5,317 were not disabled and included in this study. The average age of study sample was 73.2 (SD = 6.4) years with an average follow-up time of 6.8 (SD = 2.2) years. Disability data consisted of in-home interviews conducted every 3 years and annual telephone interviews, otherwise. Data on cognitive and physical functions were collected during in-home interviews.
Measure of Disability
The ADL disability measure focused on the ability to perform six basic self-care tasks, such as bathing, dressing, eating, showering, toileting, and getting out of bed to chair (21). Responses indicating needing help with or inability to perform a specific ADL were coded as a disability in that task. A summary score was computed by adding the number of tasks a participant was unable to perform without help ranging from 0 to 6.
Cognitive Function
Cognitive function was evaluated using a battery of four tests including two tests of episodic memory (immediate and delayed recall) derived from the East Boston Memory Story (22,23): a test of perceptual speed (the Symbol Digits Modalities Test (24)) and a test of general orientation and global cognition (the Mini-Mental State Examination (25)). Because tests loaded on a single factor that accounted for about 75% of the variance in a factor analysis (26), we constructed a composite measure of global cognitive function based on all four tests. This measure combines variables with different ranges and floor–ceiling effects by averaging the four tests together after centering and scaling to the baseline mean and standard deviation. Thus, a participant whose performance matches the average participant at baseline has a composite cognitive score of 0, and a person who performs 1 SD better than average on every test has a composite cognitive score of +1. For the age at onset of disability, we used cognitive function collected from the baseline interview. For the progression of disability model, we used the cognitive function collected from the most recent in-home interview a participant completed before onset of disability. This was done to accommodate the dynamic change in cognitive function at the age of onset of disability, which may provide a more precise estimate of effect of cognitive function on the rate of progression of disability after onset.
Physical Function
Physical function was based on three performance tests: tandem stand, measured walk, and chair stand (16). Each test was coded from the lowest level of performance to highest level, ranging from 0 to 5, with “0” meaning unable to do the easiest part of the test. Those who were able to perform the tests were given scores from 1 to 5 based on how well they performed each of the three performance tests, and the scores were added to create a total physical function score ranging from 0 to 15 for the study participants (27). The physical function data were collected during the in-home interview. Therefore, we used baseline physical function scores for the age at onset, and the scores at the interview just before the time at onset for the progression of disability. There were 196 participants who were unable to perform physical function tests and dropped from analysis.
Covariates
Covariates, such as gender (males or females), race (blacks or nonblacks), education (measured in number of years of schooling completed), body mass index (kg/m2), and the number of physician-diagnosed self-reported chronic health conditions (cancer, myocardial infarction, hypertension, stroke, diabetes, and hip fracture) observed at baseline were selected because they relate to the disability process and may influence the association between cognitive and physical function and disability. For the progression model, in addition to the above-described measures, we also included the age at onset as a covariate because there is evidence that participants with later age at onset had higher rate of progression over time (28).
Statistical Analysis
Descriptive measures were computed using means and standard deviation for continuous variables and percentages for categorical variables. Onset of ADL disability was defined as a transition from ADL equal to 0 to ADL greater than or equal to 1 on at least two consecutive yearly reports. This can be thought as following an accelerated failure time model with baseline hazard defined using a Weibull parameterization. Progression of disability after onset is based on the total number of ADL disabilities, which is assumed to follow a count model with a negative binomial error distribution to account for overdispersion. To examine the association between cognitive and physical functions and disability onset and progression, we used two-part models to systemically consider potential confounding factors. The core model (Model A) was adjusted for sex, race, body mass index, and the number of comorbid conditions. The next model (Model B) included cognitive and physical functions in addition to the variables in the core model. A random effect for the baseline hazard was added to the accelerated failure time model and a different random effect was added to the count model with both these random effects from a bivariate normal distribution. Each participant had multiple measurements over the follow-up period. Hence, a time to event model for age at onset and a progression model after onset were implemented using PROC NLMIXED in SAS software Version (9.2), with a Cholesky decomposition for the variance of the bivariate normal random effects and the parameters estimated using a Laplace approximation of the joint likelihood (29). This approach is similar to a two-part model with an extreme value Gompertz distribution and latent normal distribution that were used to model biological disease processes of CD-4 count but with different distributional assumptions (30).
To test the distributional assumptions, we used an independent accelerated failure time model with Weibull distribution and compared it with an accelerated failure time model with exponential and gamma distribution. The difference in the −2 log-likelihood values were 263 and 184, respectively, both of which were significant under a chi-square distribution. Similarly, we compared the goodness of fit from a negative binomial model with the Poisson regression model and found a difference of 782 between the two models, which was again significant. In addition, the overdispersion parameter in the negative binomial model was about 1.3, suggesting that the data did not follow a Poisson model. In summary, specifying a Weibull and negative binomial distribution for onset and progression models, respectively, resulted in a better model fit than other commonly used distributions for failure time and count data.
For an accelerated failure time model, age as an outcome was used when a change in status from no disability to any disability was observed, thereby termed as an “event.” If the study participant had no event during the study or was lost during follow-up, then that participant was treated as censored. In terms of notations, Let ti be the age at onset of ADL disability for the ith individual with censoring variable ci and event indicator di. The accelerated failure time form of the survival function given the random effect bi is obtained by the following expression (31):
where 1/σ is the shape parameter, and the log-likelihood function is assumed to be right censored.
The second part of the model measures the change in the number of ADL disability using a negative binomial regression model for the overdispersed count data (32). Given the random effect c i, the negative binomial model for number of ADL tasks unable to be performed (yi) is obtained by:
where yi is the number of ADL disabilities ranging from 0 to 6 for the participants, and α is the parameter of interest describing the progression of disability scores over time.
The joint log-likelihood for the two-part model with random intercept is expressed as follows:
where p(ti|bi) comes from a Weibull accelerated failure time model, and p(yi|ci) comes from a negative binomial distribution. The distribution of the random effects p(bi, ci) is assumed to follow jointly normal distribution of the form N(0,Σ). Maximization of the likelihood with respect to the parameters φ = (β′,α′,Σ) is complicated by the integration with respect to the random effects. Hence, we used Laplace approximation to estimate the parameters of the joint log-likelihood function.
RESULTS
The Chicago Neighborhood and Disability Study consisted of 5,935 (67% blacks) study participants who were followed longitudinally with annual data collection for up to 9 years. At baseline, 618 participants had at least one ADL disability and 5,317 participants had no ADL disability. Table 1 shows that there were significant differences between participants with and without any ADL disability at baseline. To reduce the potential for reverse causality between the major risk factors (cognitive and physical function) and ADL disability, we restricted our analysis to participants with no ADL disability at baseline. Among those with no disability at baseline, the average follow-up time was 6.3 (SD = 2.1) years. At baseline, participants had an average cognitive function score of 0.41 (SD = 0.6) and physical function score of 11.1 (SD = 2.9). Approximately, 65% of participants were 65–74 years old.
Table 1.
Baseline Characteristics of Nondisabled and Disabled Study Participants
| Characteristic | Nondisabled (n = 5,317) | Disabled (n = 618) | p Value |
| Mean (SD) | Mean (SD) | ||
| Age (y) | 73.2 (6.4) | 79.3 (8.3) | <.0001 |
| Education (in years) | 12.7 (3.3) | 11.4 (3.4) | <.0001 |
| Cognitive functioning | 0.4 (0.6) | −0.5 (1.1) | <.0001 |
| Physical functioning | 11.1 (2.9) | 2.8 (3.1) | <.0001 |
| No. (%) | No. (%) | p Value | |
| Age (y) | |||
| 65–74 | 3,459 (65) | 245 (40) | |
| 74–85 | 1,565 (29) | 232 (38) | <.0001 |
| 85+ | 293 (5) | 141 (23) | |
| Gender | |||
| Males | 2,090 (39) | 134 (22) | <.0001 |
| Females | 3,227 (61) | 484 (78) | |
| Ethnicity | |||
| Blacks | 3,480 (65) | 434 (70) | 0.017 |
| Whites | 1,837 (35) | 184 (30) |
Table 2 shows the proportion of participants who reported at least one ADL limitation for two consecutive interviews among those free of ADL disability the previous year and still alive at the end of the yearly interval. This yearly proportion of participants with onset of ADL disability ranged from 4.2% to 11.2%. The average age at onset of disability ranged from 78.0 to 83.1 years. At the time of onset, the average number of ADL disability reported by those with onset ranged from 1.94 to 2.50. From the table, we can see that participants with higher age at onset also had higher average number of ADL tasks unable to perform. In addition, about 20% of participants were lost during follow-up and were treated as censored observations.
Table 2.
Number of Participants With Onset of ADL Disability, Average Age at Onset, and Average Number of ADL Tasks Unable to Perform at Onset by Follow-up Year
| Year of Data Collection | Number of Onset (%) | Age at Onset | Number of Tasks |
| Mean (SD) | Mean (SD) | ||
| Follow-up year 1 | 244 (4.8) | 78.0 (7.88) | 2.13 (1.43) |
| Follow-up year 2 | 203 (4.2) | 79.5 (7.47) | 2.23 (1.61) |
| Follow-up year 3 | 174 (4.2) | 81.0 (7.15) | 2.37 (1.62) |
| Follow-up year 4 | 207 (5.9) | 79.5 (7.20) | 2.11 (1.51) |
| Follow-up year 5 | 159 (5.3) | 80.5 (7.05) | 2.18 (1.49) |
| Follow-up year 6 | 86 (4.2) | 83.1 (6.20) | 2.50 (1.82) |
| Follow-up year 7 | 111 (6.4) | 81.7 (5.84) | 2.13 (1.41) |
| Follow-up year 8 | 118 (11.2) | 82.9 (3.99) | 1.94 (1.37) |
Table 3 describes the association of cognitive and physical functions in the presence of confounders with age at onset of disability. In Model A, race, body mass index, and comorbid conditions were associated with age at onset, and they remained significant after accounting for cognitive and physical functions. For a unit change in cognitive function (Table 3, Model B), the log of age at onset increased by 0.026 (95% confidence interval [CI]: 0.018–0.034). By taking the antilog, age at onset was 3% higher per unit increase in cognitive function (rate ratio = 1.03, 95% CI: 1.02–1.04). For example, if the predicted age at onset was 75 years for participants with cognitive function of 0, then for participants with similar characteristics and cognitive function of 1, the predicted age at onset was 77.0 (95% CI: 76.4–77.4) years. In terms of physical function (Table 3, Model B), for a unit change in physical function, the log of age at onset increased by 0.010 (95% CI: 0.009–0.011). In other words, age at onset was 1% higher per unit increase in physical function (rate ratio = 1.01, 95% CI: 1.01–1.02). For example, if the predicted age at onset was 75 years for participants with physical function of 0, then for participants with similar characteristics and physical function of 14, the predicted age at onset was 86.9 (95% CI: 85.2–88.6) years. The age at onset for blacks was 0.95 (95% CI: 0.94–0.96) times lower than whites. In addition, the Weibull shape parameter was estimated to be 19.36 (95% CI: 16.46–22.30), suggesting that rate of onset of disability increased significantly over time.
Table 3.
Weibull Regression Model for Age at Onset of ADL Disability
| Models | A | B | ||
| Coefficient (SE) | Rate ratio (95% CI) | Coefficient (SE) | Rate ratio (95% CI) | |
| Cognitive function | 0.026* (0.004) | 1.03 (1.02–1.04) | ||
| Physical function | 0.010* (0.0007) | 1.01 (1.01–1.02) | ||
| Body mass index | −0.003* (0.0004) | 0.99 (0.99–0.99) | −0.003† (0.0006) | 0.99 (0.99–0.99) |
| Comorbid conditions | −0.019* (0.001) | 0.99 (0.99–0.99) | −0.017* (0.001) | 0.98 (0.98–0.98) |
| Blacks | −0.054* (0.005) | 0.95 (0.94–0.96) | −0.047* (0.005) | 0.95 (0.94–0.96) |
| Males | 0.002 (0.004) | 1.00 (1.00–1.01) | 0.004 (0.004) | 1.00 (1.00–1.01) |
| Education | 0.0003 (0.0006) | 1.00 (1.00–1.00) | −0.002 (0.001) | 1.00 (1.00–1.00) |
| Intercept | 4.587* (0.005) | 4.478* (0.008) | ||
| Shape | 19.894* | 19.359* | ||
| Random variance | 1.234* | 1.316* | ||
Notes: CI = confidence interval; SE = standard error.
*p < .0001.
† p < .01.
The coefficients from the age at onset model was used to predict the cumulative probability functions or the accumulated risk of ADL disability, after participants had attained 75 years of age (Figure 1) for specific (10th and 90th) percentile values of cognitive and physical functions. From the figures, participants with lower cognitive and physical functions (10th percentile) had a significantly higher risk of disability compared with participants with higher cognitive and physical functions (90th percentile). Thus, the results from age at disability analysis suggest that cognitive and physical functions were independently associated with age at onset of disability.
Figure 1.
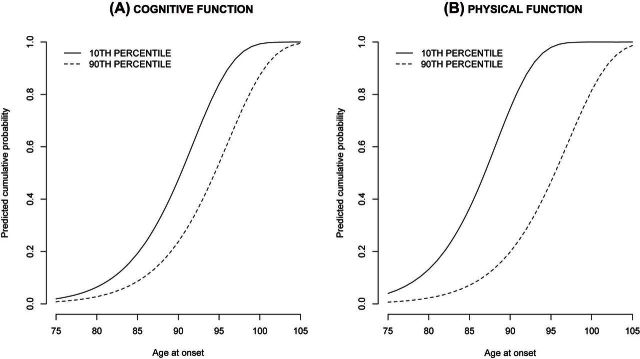
Predicted cumulative probability of onset of activities of daily living disability.
Table 4 describes the association of cognitive and physical functions with progression of disability. In Model A, sex, body mass index, and age at onset were associated with progression of disability, and they remained significant after accounting for cognitive and physical functions. Using Model B, the coefficient for time since onset (0.210; 95% CI: 0.170–0.250) represents the log of the change in predicted disability scores per year of follow-up since onset for a 75-year participant (the reference category for the centered age variable). In other words, expected disability was 1.23 (95% CI: 1.18–1.28) times higher per year of follow-up since onset. In terms of cognitive function, expected disability was 0.89 (95% CI: 0.82–0.96) times lower for a unit change in cognitive function. In addition, for a unit change in cognitive function, expected disability was 0.94 (95% CI: 0.93–0.96) times lower per year of follow-up. For physical function, expected disability was 0.98 (95% CI: 0.96–0.99) times lower for a unit change in physical function. However, expected disability did not change for interaction of physical function with time. Thus, physical function had a stationary effect on progression, whereas cognitive function had a dynamic effect on progression. In addition, age at onset was associated with a faster progression in disability.
Table 4.
Negative Binomial Regression Model for Progression of ADL Disability
| Models | A | B | ||
| Coefficient (SE) | Rate ratio (95% CI) | Coefficient (SE) | Rate ratio (95% CI) | |
| Time since onset | 0.217* (0.008) | 1.24 (1.22–1.26) | 0.210* (0.020) | 1.23 (1.18–1.28) |
| Age at onset | −0.012† (0.003) | 0.99 (0.98–0.99) | −0.016* (0.004) | 0.98 (0.97–0.99) |
| Cognitive function | −0.116† (0.038) | 0.89 (0.82–0.96) | ||
| Physical function | −0.020† (0.009) | 0.98 (0.96–0.99) | ||
| Age × Time since onset | 0.008* (0.001) | 1.01 (1.01–1.01) | 0.007* (0.001) | 1.01 (1.01–1.01) |
| Cognitive function × Time since onset | −0.057* (0.010) | 0.94 (0.93–0.96) | ||
| Physical function × Time since onset | −0.002 (0.002) | 1.00 (0.99–1.00) | ||
| Body mass index | −0.011† (0.003) | 0.99 (0.99–0.99) | −0.007† (0.003) | 0.99 (0.99–0.99) |
| Comorbid conditions | 0.024 (0.019) | 1.02 (0.98–1.06) | 0.016 (0.019) | 1.02 (0.98–1.06) |
| Black | 0.029 (0.047) | 1.03 (0.94–1.13) | −0.072 (0.048) | 0.93 (0.84–1.02) |
| Male | 0.160† (0.039) | 1.10 (1.08–1.26) | 0.133† (0.039) | 1.14 (1.06–1.23) |
| Education | −0.0006 (0.005) | 1.00 (1.00–1.00) | 0.010 (0.006) | 1.01 (0.99–1.02) |
| Intercept | −0.135‡ (0.083) | 0.108 (0.090) | ||
| Overdispersion | 1.486* | 1.521* | ||
| Random variance | 0.354* | 0.323* | ||
Notes: CI = confidence interval; SE = standard error.
*p < .0001.
† p < .01.
‡ p < .05.
The coefficients from the progression model was used to predict the rate progression of disability in 75-year-old black male participants with 12 years of education (Figure 2) for specific (10th and 90th) percentile values of cognitive and physical functions. We plotted curves for participants with poor cognition (10th percentile) and found that they had a faster progression than participants with better cognition (90th percentile). Also, participants with poor physical function (10th percentile) had higher expected disability than participants with higher physical function (90th percentile). However, the rate of progression was not different by physical function. Thus, the results from progression model suggest that cognitive and physical functions had different effects on the rate of progression of disability in older adults.
Figure 2.
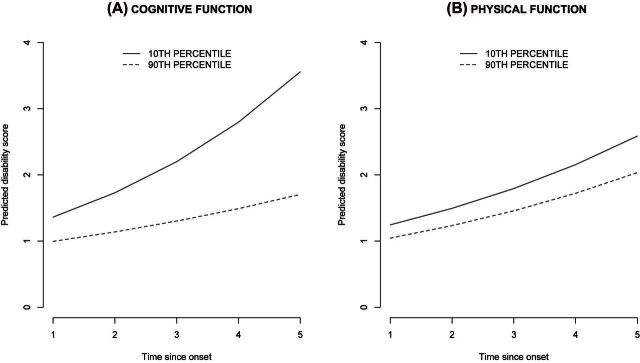
Predicted progression of activities of daily living disability for time since onset.
DISCUSSION
In this study, better cognitive and physical functions were associated with higher age of onset of ADL disability. Higher age at onset was associated with a greater rate of progression of ADL disability. However, better cognitive and better physical functions were found to offset the rate of progression associated with a later age at onset. That is, older participants with higher cognitive and physical function levels had lower levels of ADL disability when compared to those with lower cognitive and physical functions. In addition, the rate of progression was worse in older participants with lower levels of cognitive.
To date, few studies have simultaneously considered the effects of cognitive and physical functions as predictors of ADL disability in older adults (33–35). However, none of those studies investigated the effect of cognitive and physical functions on age at onset and progression of ADL disability in older adults. The results from this study can be used to better understand the determinants of ADL disability in older adults. For this purpose, we used baseline characteristics of patients to predict the age at onset of ADL disability. Cognitive and physical functions for progression models were assessed at data collection before the time of onset. Some participants might have had cognitive function measured 1 or 2 years before onset. Thus, the estimates of the progression are somewhat conservative with regards to the predictors at the time of onset and provide conservative estimates of the change in disability.
The analysis of aging-related effects depends on three potential determinants of disability changes over time, typically referred to as age, time in study, and cohort effects (36). In this article, we studied disability as an age-related change by directly modeling age at onset instead of modeling time-since-baseline effect conditional upon age at baseline. This modeling approach allowed us to directly estimate the impact of cognitive and physical function on the age at which older participants develop disability rather than baseline time at which they enter the study. Shaw and colleagues (37) highlighted a similar approach to suggest that aging-related change rather than time-since-baseline effect must be the primary issue of interest in gerontological research.
A secondary issue of concern is the healthy participation effect where study participants tend to be healthier than nonparticipants. However, in this study of disability, the association between cognitive and physical functions and age at onset and progression of disability should provide conservative estimates due to the healthy participation effect. In addition, we excluded any study participants with ADL disability at baseline. In essence, nondisabled participants irrespective of their age study were healthy with respect to their disability status. Thus, in our analysis, we reduced the bias due to healthy participation effect by excluding participants with disability at baseline. Hence, the parameter estimates from the models will be less biased while providing a direct estimate of the aging effect.
Limitations
The main shortcoming of this study is that only two patterns of the disability mechanism, namely, age at onset and progression of ADL disability, were studied. A third mechanism recovery occurred in 68 (5%) participants who were included in the progression mechanism. The inclusion of this small fraction of participants might have slightly underestimated our progression model. However, future research is needed to develop analytical methods that can study several patterns of disability mechanism. We also used two modes of data collection, in-home interviews and telephone interviews, which might have introduced an additional source of measurement error in our disability assessment. However, we adjusted for interview type using an indicator variable for telephone survey in our analytical models. Another limitation of the study is the 3-year interval between cognitive and physical performance tests. This limited our ability to study the association of cognitive and physical functions more closely to the age at onset and progression of ADL disability. Yet again, this is likely to have resulted in a conservative estimate of the association between cognitive and physical functions and progression of disability.
CONCLUSIONS
We found that cognitive and physical functions were associated with age at onset of ADL disability. Also, cognitive function at the time before disability onset was associated with progression of ADL disability. However, physical function did not seem to affect progression of ADL disability. The findings of this research suggest that physical function has a larger impact on age at onset of ADL disability than on progression of ADL disability. In addition, cognitive function affects both the age at onset and progression of ADL disability. Overall, the results from our two-stage regression models further specify the role of both physical and cognitive functions in specific stages of the disability process that affect older adults as they age.
Funding
This work was supported by grants from the National Institutes for Health (R01 AG032247 and R01 AG11101).
References
- 1.Vita AJ, Terry RB, Hubert HB, Fries JF. Aging, health risks and cumulative disability. N Engl J Med. 1998;338(15):1035–1041. doi: 10.1056/NEJM199804093381506. [DOI] [PubMed] [Google Scholar]
- 2.Barberger-Gateau P, Fabrigoule C. Disability and cognitive impairment in the elderly. Disabil Rehabil. 1997;19(5):175–193. doi: 10.3109/09638289709166525. [DOI] [PubMed] [Google Scholar]
- 3.Nagi SZ. Disability concepts revised: implications for prevention. In: Pope AM, Tarlov AR, editors. Disability in America: Toward a National Agenda for Prevention. Washington, DC: National Academy Press; 1991. [Google Scholar]
- 4.Pope AM, Tarlov AR. Disability in America: Toward a National Agenda for Prevention. Washington, DC: National Academy Press; 1991. [Google Scholar]
- 5.Verbrugge LM, Jette AM. The disablement process. Soc Sci Med. 1994;33(4):132–147. doi: 10.1016/0277-9536(94)90294-1. [DOI] [PubMed] [Google Scholar]
- 6.Wolf DA, Hunt K, Knickman J. Perspectives on the recent decline in disability at older ages. Milbank Q. 2005;83(3):365–395. doi: 10.1111/j.1468-0009.2005.00406.x. [DOI] [PMC free article] [PubMed] [Google Scholar]
- 7.Hass S, Rohlfsen RL. Life course determinants of racial and ethnic disparities in functional health trajectories. Soc Sci Med. 2010;70:240–250. doi: 10.1016/j.socscimed.2009.10.003. [DOI] [PubMed] [Google Scholar]
- 8.Taylor M. Capturing transitions and trajectories: the role of socioeconomic status in later life disability. J Gerontol A Biol Sci Med Sci. 2010;65B(6):733–743. doi: 10.1093/geronb/gbq018. [DOI] [PMC free article] [PubMed] [Google Scholar]
- 9.Jagger C, Arthur AJ, Spiers NA, Clark M. Patterns of onset of disability in activities of daily living with age. J Am Geriatr Soc. 2001;49(4):404–409. doi: 10.1046/j.1532-5415.2001.49083.x. [DOI] [PubMed] [Google Scholar]
- 10.Jagger C, Matthews RJ, Matthews FE, et al. Cohort differences in disease and disability in the young-old: findings from the MRC Cognitive Function and Ageing Study (MRC-CFAS) BMC Public Health. 2007;7:156–164. doi: 10.1186/1471-2458-7-156. [DOI] [PMC free article] [PubMed] [Google Scholar]
- 11.Wu SC, Leu SY, Li CY. Incidence of and predictors for chronic disability in activities of daily living among older people in Taiwan. J Am Geriatr Soc. 1999;47(9):1082–1086. doi: 10.1111/j.1532-5415.1999.tb05231.x. [DOI] [PubMed] [Google Scholar]
- 12.Carpenter GI, Hastie CL, Morris JN, Fries BE, Ankri J. Measuring change in activities of daily living in nursing home residents with moderate to severe cognitive impairment. BMC Geriatr. 2006;3:6–7. doi: 10.1186/1471-2318-6-7. [DOI] [PMC free article] [PubMed] [Google Scholar]
- 13.Dodge HH, Kadowaki T, Hayakawa T, et al. Cognitive impairment as a strong predictor of incident disability in specific ADL-IADL tasks among community-dwelling elders: the Azuchi Study. Gerontologist. 2005;45(2):222–230. doi: 10.1093/geront/45.2.222. [DOI] [PubMed] [Google Scholar]
- 14.Raji MA, Al Snih S, Ray LA, Patel KV, Markides KS. Cognitive status and incident disability in older Mexican Americans: findings from the Hispanic established population for the epidemiological study of the elderly. Ethn Dis. 2004;14(1):26–31. [PubMed] [Google Scholar]
- 15.Nieto ML, Albert SM, Morrow LA, Saxton J. Cognitive status and physical function in older african americans. J Am Geriatr Soc. 2008;56(11):2014–2019. doi: 10.1111/j.1532-5415.2008.01938.x. [DOI] [PMC free article] [PubMed] [Google Scholar]
- 16.Guralnik JM, Simonsick EM, Ferrucci L, Glynn RJ, Berkman LF, Blazer DG. A short physical performance battery assessing lower extremity function: association with self-reported disability and prediction of mortality and nursing home admission. J Gerontol Med Sci. 1994;49(2):M85–M94. doi: 10.1093/geronj/49.2.m85. [DOI] [PubMed] [Google Scholar]
- 17.Guralnik JM, Simonsick EM, Ferrucci L, et al. Lower-extremity function in persons over the age of 70 years as a predictor of subsequent disability. N Engl J Med. 1995;332(9):556–561. doi: 10.1056/NEJM199503023320902. [DOI] [PMC free article] [PubMed] [Google Scholar]
- 18.Ramsay SE, Whincup PH, Morris RW, Lennon LT, Wannamethee SG. Extent of social inequalities in disability in the elderly: results from a population-based study of British men. Ann Epidemiol. 2008;18(12):896–903. doi: 10.1016/j.annepidem.2008.09.006. [DOI] [PMC free article] [PubMed] [Google Scholar]
- 19.Xie J, Matthews FE, Jagger C, Bond J, Brayne C. The oldest old in England and Wales: a descriptive analysis based on the MRC Cognitive Function and Ageing Study. Age Ageing. 2008;37(4):396–402. doi: 10.1093/ageing/afn061. [DOI] [PMC free article] [PubMed] [Google Scholar]
- 20.Bienias JL, Beckett LA, Benett DZ, Wilson RS, Evans DA. Design of the Chicago Health and Aging Project. J Alzheimers Dis. 2001;5:349–355. doi: 10.3233/jad-2003-5501. [DOI] [PubMed] [Google Scholar]
- 21.Katz S, Apkom CA. A measure of primary sociobiological functions. Int J Health Serv. 1976;6:493–508. doi: 10.2190/UURL-2RYU-WRYD-EY3K. [DOI] [PubMed] [Google Scholar]
- 22.Albert M, Smith LA, Scherr PA, Taylor JO, Evans DA. Use of brief cognitive tests to identify individuals in the community with clinically diagnosed Alzheimer's disease. Int J Neurosci. 1991;57:167–178. doi: 10.3109/00207459109150691. [DOI] [PubMed] [Google Scholar]
- 23.Wilson RS, Bennette DA, Bienias JL, Mendes de Leon CF, Morris MC, Evans DA. Cognitive activity and incident AD in a population-based sample of older adults. Neurology. 2002;59(12):1910–1914. doi: 10.1212/01.wnl.0000036905.59156.a1. [DOI] [PubMed] [Google Scholar]
- 24.Smith A. Symbol Digits Modalities Test. Los Angeles, CA: Western Psychological Services; 1982. [Google Scholar]
- 25.Folstein MF, Folstein SE, McHugh TR. “Mini-Mental State”. A practical method for grading the cognitive state of patients for the clinician. J Psychiatr Res. 1975;12(3):189–198. doi: 10.1016/0022-3956(75)90026-6. [DOI] [PubMed] [Google Scholar]
- 26.Wilson RS, Benette DA, Beckett LA, Morris MC, Gilley DW, Bienias JL, Scherr PA, Evans DA. Cognitive activity in older persons from a geographically defined population. J Gerontol B Psychol Sci Soc Sci. 1999;54(3):155–160. doi: 10.1093/geronb/54b.3.p155. [DOI] [PubMed] [Google Scholar]
- 27.Mendes de Leon CF, Barnes LL, Bienias JL, Skarupski KA, Evans DA. Racial disparities in disability: recent evidence from self-reported and performance-based disability measures in a population-based study of older adults. J Gerontol B Psychol Sci Soc Sci. 2005;60:S263–S271. doi: 10.1093/geronb/60.5.s263. [DOI] [PubMed] [Google Scholar]
- 28.Dunlop DD, Hughes SL, Manheim LM. Disability in activities of daily living: patterns of change and a hierarchy of disability. Am J Public Health. 1997;87:378–383. doi: 10.2105/ajph.87.3.378. [DOI] [PMC free article] [PubMed] [Google Scholar]
- 29.SAS Institute Inc. SAS 9.1.3 Help and Documentation. Cary, NC: SAS Institute Inc.; 2011. [Google Scholar]
- 30.Albert PS, Shih JH. Modeling tumor growth and random onset. Biometrics. 2003;597:897–906. doi: 10.1111/j.0006-341x.2003.00104.x. [DOI] [PubMed] [Google Scholar]
- 31.Hosmer DW, Lemeshow S, May S. Applied Survival Analysis. 2nd ed. Hoboken, NJ: John Wiley & Sons Inc.; 2008. [Google Scholar]
- 32.Agresti A. Categorical Data Analysis. 2nd ed. Hoboken, NJ: John Wiley & Sons Inc.; 2002. [Google Scholar]
- 33.Braungart Fauth E, Zarit SH, Malmberg B, Johansson B. Physical, cognitive, and psychosocial variables from disablement process model predicts patterns of independence and transition into disability for the oldest old. Gerontologist. 2007;75(5):613–624. doi: 10.1093/geront/47.5.613. [DOI] [PubMed] [Google Scholar]
- 34.Kim JM, Stewart R, Glozier N, et al. Physical health, depression and cognitive function as correlates of disability in an older Korean population. Int J Geriatr Psychiatry. 2005;20(2):160–167. doi: 10.1002/gps.1266. [DOI] [PubMed] [Google Scholar]
- 35.Kempen GI, Ormel J. The impact of physical performance and cognitive status on subsequent ADL disability in low-functioning older adults. Int J Geriatr Psychiatry. 1998;13(7):480–483. doi: 10.1002/(sici)1099-1166(199807)13:7<480::aid-gps805>3.0.co;2-s. [DOI] [PubMed] [Google Scholar]
- 36.Mendes de Leon CF. Aging and the elapse of time: a comment on the analysis of change. J Gerontol B Psychol Sci Soc Sci. 2007;62B(3):S198–S202. doi: 10.1093/geronb/62.3.s198. [DOI] [PubMed] [Google Scholar]
- 37.Shaw BA, Krause N, Liang J, Bennett J. Tracking changes in social relations throughout late life. J Gerontol B Biol Sci Soc Sci. 2007;62B(2):S90–S99. doi: 10.1093/geronb/62.2.s90. [DOI] [PubMed] [Google Scholar]