

Abstract
To investigate the role mitochondrial membrane lipids play in the actions of calorie restriction (CR), C57BL/6 mice were assigned to four groups (control and three 40% CR groups) and fed diets containing soybean oil (also in the control diet), fish oil, or lard. The fatty acid composition of the major mitochondrial phospholipid classes, proton leak, and H2O2 production were measured in muscle mitochondria following 1 month of CR. The results indicate that phospholipid fatty acids reflected the polyunsaturated fatty acid profile of the dietary lipid sources. Capacity for Complex I– and III–linked H2O2 production was decreased with CR, although there was no difference between CR groups. The CR lard group had lower proton leak than all other groups. The results indicate that a decreased degree of unsaturation in muscle mitochondrial membranes is not required for reduced H2O2 production with CR. However, dietary lipids do have some influence on proton leak with CR.
Key Words: Fatty acids, Reactive oxygen species, Proton leak, Phospholipids, Energy restriction
CALORIE restriction (CR) without malnutrition has been shown to delay the onset of age-related diseases and prolong mean and maximum life spans in variety of species (1) . However, its underlying mechanisms are not fully understood. It has been proposed that alterations in mitochondrial membrane composition may play a central role in the retardation of aging with CR (2). This idea is consistent with the membrane theory of aging which proposes that the number of double bonds in membrane phospholipids is inversely correlated with life span (3–6), and CR has been reported to alter membrane composition in a manner that decreases long-chain n−3 polyunsaturated fatty acid (PUFA) content and decreases the degree of unsaturation of membranes (7,8). This decrease in membrane unsaturation is hypothesized to influence aging by protecting membranes against lipid peroxidation and preventing oxidative stress (6,9). However, alterations in membrane lipid composition could also influence membrane proteins and membrane properties (permeability, fluidity, etc.).
In addition to being a site of oxidative damage, the inner mitochondrial membrane is also one of the primary cellular locations for reactive oxygen species (ROS) production. The mitochondrial electron transport chain (ETC) Complexes I and III, which are embedded in the inner mitochondrial membrane, are both major sites of ROS production (10–12), and it is possible that alterations in membrane lipid composition could influence aging by modulating ROS production from these complexes. It has been reported that CR decreases mitochondrial ROS production in skeletal muscle (13,14), liver (15,16), heart (17,18), kidneys (17), and brain (17,19). There is also some evidence to suggest that alterations in membrane lipid composition may influence mitochondrial ROS production (20,21). However, it remains to be determined if changes in membrane lipid composition contribute to CR-induced alterations in ROS production.
CR-related changes in membrane lipid composition could also have an influence on membrane permeability. Studies have shown that mitochondrial proton leak shows a positive correlation with membrane unsaturation index (UI) and n−3 PUFAs (22,23). There is also evidence that CR alters mitochondrial proton leak in skeletal muscle (24, 25) and liver (16,26). It is not yet known, however, if CR-related alterations in membrane composition play a role in changes in mitochondrial proton leak.
One strategy to determine the role mitochondrial membrane lipids play in the actions of CR is to manipulate membrane fatty acid composition by feeding CR animals diets that differ in lipid composition. The purpose of the current study was to determine if dietary lipid source (fish oil, soybean oil, or lard) alters skeletal muscle mitochondrial membrane composition, ROS production and proton leak in mice fed a CR diet for 1 month. Skeletal muscle mitochondria were studied because muscle is a post-mitotic tissue that accumulates oxidative damage with aging, and CR has been shown to mitigate this damage (27). This study will help determine if specific changes in membrane fatty acid composition are required for CR-induced alterations in mitochondrial ROS production and proton leak.
Methods
Chemicals
All chemicals and reagents were purchased from Sigma-Aldrich (St Louis, MO), except for the protein assay kit (BioRad, Hercules, CA) and bovine serum albumin (MP Biochemicals, Santa Ana, CA).
Animals and Diets
One hundred and four male C57BL/6 mice were purchased from the Jackson Laboratory (Sacramento, CA) at 14 weeks of age. After 14 days on commercial rodent chow diet (Harlan Teklad #7012, Madison, WI), the mice were randomly assigned into four dietary groups (n = 26 per diet group) and fed a modified AIN-93G purified diet. The control group was fed 95% of a predetermined ad libitum intake (12.5 kcal). This slight restriction in food intake was initiated to prevent excessive weight gain during the study. The three CR dietary groups were maintained on 60% of the daily allowance of the ad libitum intake (8.6 Kcal), and these diets were identical except for dietary lipid sources. The diets (% total Kcal/d) contained 20.3% protein, 63.8% carbohydrate, and 15.9% fat. The dietary fat for the control group was soybean oil. The dietary fats for the three CR group were soybean oil (high in n−6 PUFAs; Super Store Industries, Lathrop, CA), fish oil (high in n−3 PUFAs: 18% eicosapentaenoic acid, 12% docosahexaenoic acid, Jedwards International, Inc. Quincy, MA), or lard (high in saturated fatty acid [SFA] and monounsaturated fatty acid [MUFA], ConAgra Foods, Omaha, NE). To insure adequate linoleic acid levels, the CR fish group was supplemented with soybean oil (Table 1). The mice were fed the control or CR diets for 1 month. The fatty acid composition of dietary lipids is shown in Table 2. All mice were housed individually in a vivarium maintained at 22–24°C and 40–60% relative humidity with a 12-hour light-dark cycle and free access to water. It should be noted that the same mice were not used for all of the procedures, and separate groups of mice were used for measures of membrane fatty acid composition, proton leak kinetics and mitochondrial hydrogen peroxide production. All experimental procedures were approved by the University of California Institutional Animal Care and Use Committee.
Table 1.
Dietary Composition
| Ingredients | Dietary group (g/100 g diet) | ||
|---|---|---|---|
| Control/CR soy | CR fish | CR lard | |
| Corn starch | 39.7 | 39.7 | 39.7 |
| Casein | 20.0 | 20.0 | 20.0 |
| Maltodextrin | 13.2 | 13.2 | 13.2 |
| Sucrose | 10.0 | 10.0 | 10.0 |
| Soybean oil | 7.0 | 1.0 | 0.0 |
| Fish oil | 0.0 | 6.0 | 0.0 |
| Lard | 0.0 | 0.0 | 7.0 |
| Cellulose | 5.0 | 5.0 | 5.0 |
| Mineral mix | 3.5 | 3.5 | 3.5 |
| Vitamin mix | 1.0 | 1.0 | 1.0 |
| l-Cystine | 0.3 | 0.3 | 0.3 |
| Choline bitartrate | 0.25 | 0.25 | 0.25 |
| t-Butylhydroquinone | 0.0014 | 0.0028 | 0.0014 |
Note: CR = calorie restriction. All diets contained AIN-93G mineral mix and AIN-93 vitamin mix obtained from Dyets Inc. (Bethlehem, PA).
Table 2.
Major Fatty Acid Composition of the Experimental Fats
| Fatty acid | Soybean oil (%) | Fish oil (%) | Lard (%) |
|---|---|---|---|
| 14:0 | 0.1 | 7.5 | 1.4 |
| 16:0 | 10.2 | 16.5 | 23.7 |
| 16:1n-7 | 0.1 | 9.6 | 0.0 |
| 18:0 | 4.0 | 3.2 | 15.0 |
| 18:1n−9 | 21.2 | 8.7 | 39.2 |
| 18:1n−7 | 0.0 | 2.9 | 0.0 |
| 18:2n−6 | 55.0 | 1.3 | 15.2 |
| 18:3n−3 | 8.0 | 0.1 | 0.5 |
| 18:4n−3 | 0.0 | 3.0 | 0.1 |
| 20:4n−6 | 0.0 | 0.9 | 0.2 |
| 20:5n−3 | 0.0 | 17.7 | 0.0 |
| 22:6n−3 | 0.0 | 10.3 | 0.0 |
| Other | 1.3 | 18.4 | 4.7 |
| Saturates | 14.8 | 28.3 | 40.3 |
| Total n−3 | 8.1 | 33.9 | 0.7 |
| Total n−6 | 55.0 | 3.2 | 16.0 |
| n−6/n−3 | 6.8 | 0.1 | 24.4 |
Isolation of Mitochondria From Skeletal Muscle
At the end of 1-month CR, mice were euthanized by cervical dislocation after an overnight fast. Muscle mitochondria were isolated as previously described (28) with modifications. Briefly, muscle from the entire hind limb was rapidly dissected and placed in ice-cold basic medium containing 140 mM KCl, 20 mM Hepes, 5 mM MgCl2, and 1 mM EGTA. Muscle was washed and trimmed of connective tissue and fat and minced into small pieces in 5 vol of ice-cold homogenization medium containing basic medium with 1% bovine serum albumin, 1 mM ATP, and two units of Subtilisin A (protease) per gram muscle wet weight. Muscle was incubated in the homogenization medium for 2 minutes with constant swirling and then diluted sixfold (vol/vol) using homogenization medium without Subtilisin A. The mixture was centrifuged at 10,000g (Beckman Coulter Model J2-21M) for 10 minutes to remove the Subtilisin A. The supernatant was discarded, and the pellet was homogenized (10% wt/vol in homogenization medium) in an ice-cold glass-Teflon motor-driven homogenizer. The homogenate was centrifuged at 500g for 10 minutes after which the pellet was discarded, and the supernatant was centrifuged at 10,000g for 10 minutes. The resulting pellet was resuspended in wash medium (basic medium with 1% bovine serum albumin) and incubated on ice for 5 minutes (myofibrillar repolymerization). Samples were then centrifuged at 500g for 10 minutes in the above wash medium. The retained supernatant was centrifuged at 10,000g for 10 minutes, and the pellet was retained. This pellet was resuspended in basic medium and centrifuged at 10,000g for 10 minutes. This final pellet was resuspended in a minimal volume of the basic medium. The final pellet was used for hydrogen peroxide, proton leak, or lipid peroxidation assays. The rest was stored under liquid nitrogen for lipid analysis.
Protein Assays
Protein concentrations of mitochondrial samples were determined using the BioRad protein assay method, with bovine serum albumin as the standard.
Organ Weight Measurements
Internal organs (brain, liver, heart, kidneys, and lungs) and fat pads (subcutaneous, epididymal, perirenal, visceral, and interscapular areas) were removed from the mice immediately after sacrifice. All tissues were cleaned of fat or connective tissue and weighed.
Lipid Extraction and Fatty Acid Analysis
To confirm that dietary lipid manipulations were influencing membrane fatty acid composition of phosphatidyl choline (PC), phosphatidyl ethanolamine (PE), and cardiolipin (CL), hind-limb muscle mitochondria were used. Specifically, isolated mitochondria from mice hind-limb skeletal muscle were shipped on dry ice to Lipid Technologies LLC (Austin, MN) and analyzed for membrane fatty acid composition. Lipids were extracted from the mitochondria membrane using the Bligh-Dyer extraction method (29). A mixture of mitochondrial membrane, chloroform and methanol (2:1 vol/ vol), and water were prepared in order to recover the lipid in a chloroform layer. Lipid classes were separated by preparative thin-layer chromatography, and the desired corresponding lipid fractions were scraped from the thin layer plates (Rf: PC = 0.22, PE = 0.47, and CL = 0.78) and methylated with boron trifluoride (10%) in excess methanol in an 80°C water bath for 90 minutes. The resulting fatty acid methyl esters were separated and quantified with a Shimadzu capillary gas chromatograph (model 2010) utilizing a 30-m Restek free fatty acid phase coating (30). The instrument temperature was programmed from 160 to 240°C at 7°C/min with a final hold of 7 minutes. Identification of fatty acid methyl esters was made by comparison with authentic standards (NuChek Prep, Elysian, MN). Results were expressed as the percentage of each individual fatty acid in relation to the total fatty acids of each lipid class.
H2O2 Production by Skeletal Muscle Mitochondria
The rate of mitochondrial H2O2 production was determined fluorimetrically (excitation 320 nm, emission 400 nm) at 37°C using p-hydroxyphenylacetate (PHPA; 500 μg), horseradish peroxidase (four units), superoxide dismutase (100 U/mL), and mitochondria (0.1 mg) suspended in incubation medium (10 mM potassium phosphate buffer, 154 mM KCl, 0.1 mM EGTA, and 3 mM MgCl2, pH 7.4). Fluorescence was measured using a Perkin-Elmer LS 55 luminescence spectrometer equipped with a peltier water heating system and a magnetic stirring sample compartment (31). Measurements were completed with substrates alone (10 mM succinate or 10 mM pyruvate/5 mM malate), substrate and rotenone (5 μM), or substrate and antimycin A (5 μM). Rotenone (Complex I inhibitor) and antimycin A (Complex III inhibitor) maintain Complexes I and/or III of the ETC in reduced state. The rates of H2O2 production were expressed as pmol H2O2/min/mg protein. A standard curve generated over a range of H2O2 concentrations was used to determine the amount of H2O2 produced.
Measurement of Mitochondrial Oxygen Consumption
Mitochondrial oxygen consumption (nmol O/min/mg protein) was measured using a previously described method (32) with modifications. Mitochondrial respiration was monitored using a Clark-type oxygen electrode (Hansatech, Norfolk, UK). All measurements were completed at 30°C using mitochondria (0.25 mg mitochondrial protein/mL) in air-saturated incubation medium (145 mM KCl, 5 mM KH2PO4, 30 mM Hepes, 3 mM MgCl2, and 0.1 mM EGTA, pH 7.4). Respiration was initiated by the addition of 5 μM succinate (plus 5 μM rotenone) in the absence (State 4) and in the presence (State 3) of 500 μM ADP. Respiratory control ratios were calculated as State 3 divided by State 4 respiration rates. The respiratory control ratio values for the four experimental groups were not different from each other statistically (Supplementary Table 1).
Measurement of Proton Leak Kinetics
Mitochondrial membrane potential (△ Ψm) in nonphosphorylating skeletal muscle was assessed simultaneously with oxygen consumption measurements using a methyl-triphenylphosphonium (TPMP+)-sensitive electrode. All measurements were completed using mitochondria (0.25 mg/mL) in the abovementioned incubation medium. A TPMP+ (0–2.5 μM) standard curve was generated in each sample prior to the initiation of respiration and membrane potential measurements. Proton leak kinetics were determined by titrating the ETC with incremental additions of malonate (0.1–2.4 mM), an inhibitor of Complex II, in the presence of 5 mM succinate, 5 μM rote-none, oligomycin (8 μg/mL), and nigericin (0.08 μg/mL; (33)). Membrane potentials were calculated using a modified Nernst equation (33). A TPMP+-binding correction for skeletal muscle of 0.35 (μl/mg protein)−1 was used for membrane potential calculations (34).
Measurement of Lipid Peroxidation Levels
Lipid peroxidation was measured by the thiobarbituric acid reactive substances (TBARS) test (35), except 0.07 mM per assay of butylated hydoxytoluene was added to prevent artificial lipid peroxidation during the boiling step (36). To 1 mL of muscle mitochondrial sample (0.25–0.50 mg protein), butylated hydoxytoluene was added, followed by the addition of 2 mL of TCA-TBA-HCl reagent (15% wt/vol trichloracetic acid, 0.375% wt/vol thiobarbituric acid, and 0.25 N hydrochloric acid) and mixed thoroughly. The solution was heated for 15 minutes in a boiling water bath, then cooled and centrifuged at 1000g for 10 minutes to remove the precipitate. The absorbance of the supernatant was determined at 535 nm (ε = 1.56 x 10⁵/M/cm) against a blank that contained all the reagents minus the mitochondria. Results were expressed as nmol TBARS per mg protein.
Statistical Analysis
All results were expressed as the mean ± SE. Normality of the data distribution was performed using Shapiro–Wilk tests. Comparisons between the control and CR soy group were used to determine the influence of CR on each variable of interest, whereas comparisons among the three CR groups were used to determine the influence of dietary lipids on the variables of interest. Wilcoxon/Kruskal–Wallis tests or analysis of variance were performed as appropriate using JMP software (SAS Institute Inc. Cary, NC).
Results
Organ and Body Weights
Organ and body weights for each of the four diet groups are summarized in Table 3. One month of CR (Control vs CR soy) produced a decrease (p < .05) in body weight (22.7%), liver (14.4%), kidney (21.9%), heart (16.7%), lung (12.5%), brain (7%), and hind-limb muscle (21.8%) weights. CR decreased the weights of all fat pads (p < .05), with the exception of the interscapular fat pad (Table 4).
Table 3.
Organ and Body weights (g) at the End of 1 mo calorie restriction (CR) in Mice Consuming a Control Diet (Control n = 23) or CR Diets Containing Soybean Oil (CR Soy n = 26), Fish Oil (CR Fish n = 25), or Lard (CR Lard n = 24)
| Control | CR fish | CR lard | CR soy | |
|---|---|---|---|---|
| Body weight | 27.7 ± 0.4a | 22.5 ± 0.3b | 22.3 ± 0.3b | 21.4 ± 0.2c |
| Liver | 1.04 ± 0.03a | 0.95 ± 0.02b | 0.94 ± 0.02b | 0.89 ± 0.01c |
| Muscle | 1.47 ± 0.05a | 1.22 ± 0.03b | 1.13 ± 0.04b | 1.15 ± 0.04b |
| Kidney | 0.32 ± 0.006a | 0.28 ± 0.003b | 0.23 ± 0.002c | 0.25 ± 0.002d |
| Heart | 0.12 ± 0.002a | 0.10 ± 0.002b | 0.10 ± 0.002b | 0.10 ± 0.002b |
| Lungs | 0.16 ± 0.007a | 0.13 ± 0.006b | 0.15 ± 0.004a | 0.14 ± 0.005b |
| Brain | 0.43 ± 0.01a | 0.41 ± 0.01a,b | 0.40 ± 0.01b | 0.40 ± 0.01b |
Note: Values in a row that do not share a common superscript indicate a significant difference (p < .05) between treatments.
Table 4.
Fat Pad Weights (g) at the E nd of 1 mo calorie restriction (CR) in Mice Consuming a Control Diet (Control n = 8)or CR Diets Containing Soybean Oil (CR Soy n = 9), Fish Oil (CR Fish n = 10), or Lard (CR Lard n = 8)
| Control | CR fish | CR lard | CR soy | |
|---|---|---|---|---|
| Subcutaneous | 0.97 ± 0.10a | 0.80 ± 0.08a | 0.74 ± 0.10a,b | 0.61 ± 0.06b |
| Epididymal | 0.89 ± 0.10a | 0.59 ± 0.07b | 0.57 ± 0.07b | 0.41 ± 0.06b |
| Perirenal | 0.28 ± 0.03a | 0.15 ± 0.02b | 0.12 ± 0.02b | 0.10 ± 0.02b |
| Visceral | 0.45 ± 0.05a | 0.42 ± 0.01a | 0.42 ± 0.02a | 0.30 ± 0.02b |
| Interscapular | 0.16 ± 0.02a,b | 0.15 ± 0.01a | 0.12 ± 0.01b | 0.12 ± 0.01a,b |
Note: Comparisons are between the treatments within a specific fat pad (row). Values in rows that do not share a common superscript indicate a significant difference (p < .05) between treatments.
Within the CR groups, dietary lipids did produce some differences in body and organ weights. Soybean oil-fed CR mice had lower body and liver weights (p < .05) than the other groups. This dietary group also had the lowest (p < .05) amount of visceral fat. Kidney weights were different (p < .05) between all three CR groups.
Mitochondrial Phospholipid Fatty Acid Composition
Hind-limb muscle mitochondrial fatty acid composition of the phospholipids PC, PE, and CL are presented in Tables 5–7, respectively. Lipid analysis showed that muscle mitochondrial membrane lipids changed in a manner, which reflected the dietary lipid sources.
When investigating the effect of CR (CR soy vs control) on mitochondrial phospholipid fatty acid composition, it was observed that most of the fatty acid changes occurred in PC. In PC, CR increased the highly unsaturated fatty acid (HUFA) composition (p < .05) in n−3 fatty acids and decreased HUFA (p < .05) in n−6 fatty acids. This was due to CR-induced decreases in 20:3n−6,20:4n−6, and 22:4n−6. However, CR did not alter UI, SFA, MUFA, PUFAs, total n−3, total n−6, and total HUFAs in any of the three phospholipids. In PE, CR only increased (p < .05) 18:3n−6 and decreased (p < .05) 22:5n−3 content. In CL, CR did not markedly affect fatty acid composition.
To examine the effects of dietary lipids on the mitochondrial membrane fatty acid composition of CR mice, comparisons were made between the three CR dietary groups. The fish oil group had increased levels of n−3 fatty acids and decreased n−6 fatty acids in all phospholipids compared with the soy and lard groups. The fish oil group also had increased UI and increased levels of HUFA in PC and CL compared with the other diet groups. However, dietary lipids did not alter all phospholipids in the same fashion. For instance, fish oil increased MUFA content in CL but decreased MUFA levels in PC. Lard increased MUFA levels only in PC. Comparisons between the lard and soy groups showed differences in HUFA composition for both PC and CL, with the lard group showing a decreased proportion of n−3 fatty acids and increased proportion of n−6 fatty acids in HUFA. There were relatively few fatty acid differences between the lard and soy groups in PE.
Table 5.
Fatty Acid Composition (%) of Phosphatidyl Choline From Muscle Mitochondria of Mice Consuming a Control Diet (Control n = 4) or CR Diets Containing Lard (CR Lard n = 4), Soybean Oil (CR Soy n = 5), or Fish Oil (CR Fish n = 5)
| Control | CR fish | CR lard | CR soy | |
|---|---|---|---|---|
| 14:0 | 0.76 ± 0.08a | 1.53 ± 0.10b | 0.90 ± 0.12a | 0.95 ± 0.14a |
| 16:0 | 35.3 ± 0.5a,b | 36.4 ± 0.5a | 35.4 ± 0.8a,b | 33.9 ± 1.1b |
| 18:0 | 6.0 ± 0.1a | 5.2 ± 0.1b | 6.7 ± 0.2c | 7.0 ± 0.3c |
| 20:0 | 0.01 ± 0.01 | 0.02 ± 0.01 | 0.01 ± 0.01 | 0.02 ± 0.01 |
| 24:0 | 0.12 ± 0.01 | 0.18 ± 0.03 | 0.15 ± 0.01 | 0.14 ± 0.01 |
| 16:1n−7 | 3.5 ± 0.4a,b | 2.9 ± 0.1a | 3.3 ± 0.1b | 2.8 ± 0.1a |
| 18:1n−7 | 2.7 ± 0.3a,b | 2.1 ± 0.3a | 3.6 ± 0.4b | 2.8 ± 0.5a,b |
| 18:1n−9 | 4.9 ± 0.3a | 3.6 ± 0.1b | 6.6 ± 0.5c | 5.6 ± 0.1c |
| 22:1n−9 | 0.04 ± 0.03 | 0.02 ± 0.00 | 0.07 ± 0.04 | 0.06 ± 0.03 |
| 18:2n−6 | 11.9 ± 0.7a | 2.7 ± 0.2b | 8.7 ± 0.6c | 13.3 ± 1.0a |
| 18:3n−6 | 0.10 ± 0.00a | 0.08 ± 0.01a | 0.10 ± 0.01a,b | 0.11 ± 0.01b |
| 20:3n−6 | 1.19 ± 0.03a | 0.18 ± 0.01b | 1.13 ± 0.01a | 0.90 ± 0.05c |
| 20:4n−6 | 10.9 ± 0.4a | 3.1 ± 0.1b | 10.8 ± 0.2a | 8.7 ± 0.7c |
| 22:4n−6 | 0.42 ± 0.01a | 0.04 ± 0.00b | 0.58 ± 0.03c | 0.36 ± 0.02d |
| 22:5n−6 | 0.55 ± 0.05a | 0.39 ± 0.00b | 0.95 ± 0.10c | 0.55 ± 0.06a |
| 18:3n−3 | 0.49 ± 0.03a | 0.15 ± 0.01b | 0.09 ± 0.01c | 0.52 ± 0.02a |
| 20:5n−3 | 0.14 ± 0.00a | 1.73 ± 0.08b | 0.09 ± 0.01c | 0.17 ± 0.02a |
| 22:5n−3 | 2.7 ± 0.1a | 3.3 ± 0.1b | 2.0 ± 0.1c | 2.2 ± 0.2c |
| 22:6n−3 | 16.1 ± 1.1a | 32.5 ± 1.3b | 15.9 ± 0.8a | 17.1 ± 1.8a |
| Unsaturation Index | 200.2 ± 6.7a | 251.8 ± 7.7b | 192.6 ± 5.0a | 196.9 ± 12.1a |
| % SFA | 42.3 ± 0.5 | 43.6 ± 0.6 | 43.3 ± 0.9 | 42.3 ± 1.1 |
| % MUFA | 11.6 ± 0.6a | 9.4 ± 0.4b | 14.3 ± 0.3c | 12.1 ± 0.7a |
| % PUFA | 44.8 ± 1.1a | 44.5 ± 1.3a | 40.6 ± 0.9b | 44.1 ± 2.1a,b |
| % Total n−3 | 19.5 ± 1.2a | 37.9 ± 1.3b | 18.1 ± 0.8a | 20.0 ± 1.9a |
| % Total n−6 | 25.3 ± 0.5a | 6.5 ± 0.1b | 22.4 ± 0.5c,d | 24.1 ± 0.9a,d |
| HUFA | 32.7 ± 1.5a | 41.7 ± 1.4b | 31.8 ± 0.9a | 30.6 ± 2.5a |
| % n−3 HUFA* | 59.5 ± 0.9a | 90.9 ± 0.2c | 57.0 ± 1.0a | 65.1 ± 1.0b |
| % n−6 HUFA* | 40.4 ± 0.9a | 9.1 ± 0.2c | 42.7 ± 1.0a | 34.8 ± 1.0b |
Notes: CR = calorie restriction; HUFA = highly unsaturated fatty acid; MUFA = monounsaturated fatty acid; PUFA = polyunsaturated fatty acid; SFA = saturated fatty acid. Comparisons are between the treatments within a row. Values in rows that do not share a common superscript indicate a significant difference (p < .05) between treatments.
*Values are percent of total HUFA amount.
Mitochondrial H2O2 Production
The influence of CR and dietary lipid composition on mitochondrial H2O2 production is summarized in Figure 1. To examine the effects of CR on H2O2 production, comparisons were made between the control and CR soy groups. There were no differences (p > .05) between the two groups when H2O2 production was measured in mitochondria respiring on succinate, a Complex II substrate (Figure 1A). Succinate was used as a substrate to assess both electron backflow into Complex I and forward electron transport into Complex III. Succinate plus rotenone (Complex I inhibitor) was also used to assess H2O2 production after blocking backflow into Complex I. There were no differences between the control and CR soy group for the succinate plus rotenone measurements. Succinate plus antimycin A (Complex III inhibitor) was used to stimulate maximum H2O2 production by maintaining both Complex I (via backflow) and Complex III in a reduced state. Under these conditions, H2O2 production was decreased by 40% (p < .05) in the CR soy compared with control group.
Figure 1.
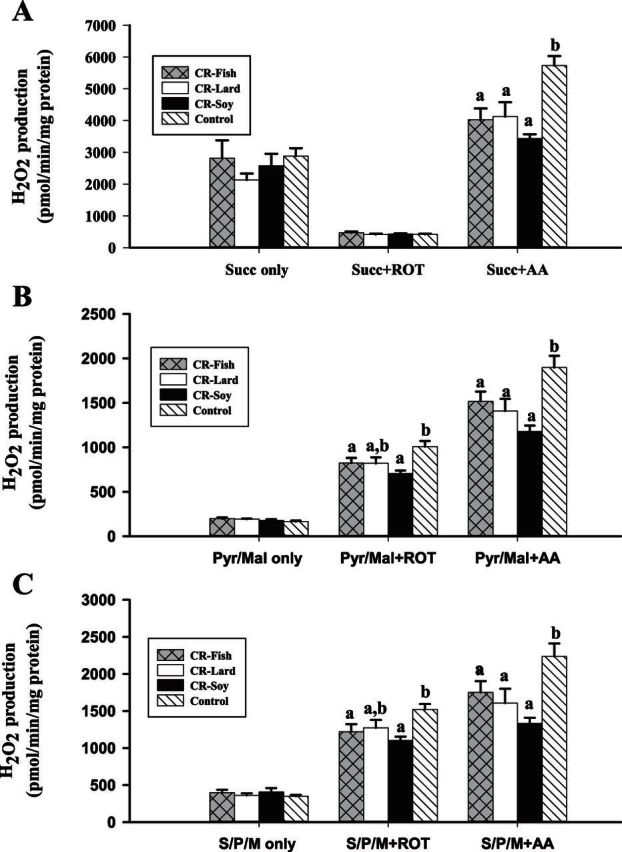
Hydrogen peroxide production in skeletal muscle mitochondria from mice consuming a control diet (Control n = 10) or calorie restriction (CR) diets containing lard (CR lard n = 6), soybean oil (CR soy n = 8), or fish oil (CR fish n = 9). All measurements were completed on freshly isolated mitochondria. H2O2 production was monitored in mitochondria respiring on succinate (Panel A), Pyruvate/Malate (Panel B) , or Succinate plus Pyruvate/Malate (Panel C). All comparisons were within substrate only or within the substrate and inhibitor combination. Bars that do not share a common letter indicate a significant difference (p < .05) between treatments. AA, Antimycin A; ROT, Rotenone.
When using Complex I-linked substrates (pyruvate/malate; Figure 1B) or substrates for both Complexes I and II (pyruvate/malate/succinate; Figure 1C), the rate of H2O2 production did not differ (p < .05) between control and CR soy groups. However, the rate of H2O2 production was lower in the CR soy versus control group when antimycin A or rotenone was used. When incubated with pyruvate/malate, rotenone maximizes ROS production from Complex I by blocking electron transport to coenzyme Q and maintaining Complex I in a reduced state. With pyruvate/malate plus rotenone, H2O2 production was decreased (p < .05) by 30% in the CR soy versus control group indicating a decreased capacity for ROS production from Complex I with CR (Figure 1B). When used with pyruvate/malate, antimycin A blocks electron flow in Complex III and creates an environment in which both Complexes I and III are maintained in a reduced state. Under these conditions, H2O2 production was decreased (p < .05) by 38% in the CR versus control group (Figure 1B). The overall magnitude of this decrease was too large to be explained by Complex I alone, suggesting that CR also induces a decrease in capacity for Complex III-linked ROS production. The results using Complex I and II substrates (pyruvate/malate/succinate; Figure 1C) were the same as those observed for pyruvate/malate, indicating decreased (p < .05) H2O2 production in the CR group with rotenone or antimycin A. Overall, the substrate and inhibitor studies indicated that CR induced a decrease in capacity for ROS production from both Complexes I and III.
To examine the effects of dietary lipids on H2O2 production in CR mice, comparisons were made within the three CR dietary groups. The results showed that there were no differences in H2O2 production between any of the CR groups for all the assessed conditions. These results suggested that a specific mitochondrial membrane lipid profile (or a specific source of dietary fat) was not required for the reduced ROS production with CR in muscle mitochondria.
Mitochondrial Proton Leak Kinetics
Mitochondrial proton leak kinetics are summarized in Figure 2. To examine the effects of CR on proton leak kinetics, comparisons were made between the CR soy and the control groups. State 4 oxygen consumption and membrane potential (furthest points to the right on the proton leak kinetics plot) were not significantly different between the CR soy and control group, although membrane potential tended to be higher at similar respiration rates suggesting a trend toward a decrease in proton leak in the CR soy group. When assessing the effects of dietary fats on proton leak, CR lard had the lowest proton leak because this group had the highest membrane potential at any given oxygen consumption rate when compared with the other three groups. In particular, State 4 respiration rate was lower (p < .05) in the lard group than the other CR groups despite the fact that State 4 membrane potential was not different between any of the diet groups. The results of this study indicate that dietary lipid composition does influence mitochondrial proton leak in skeletal muscle of CR mice.
Figure 2.

Proton leak kinetics curves in hind-limb muscle mitochondria at the end of 1 mo calorie restriction (CR) from mice consuming a control diet (Control n = 7) or CR diets containing lard (CR lard n = 8), soybean oil (CR soy n = 7), or fish oil (CR fish n = 7). Leak-dependent respiration and membrane potential were measured simultaneously using a Clark-type electrode and a TPMP+-sensitive electrode, respectively. The furthest point on the right in each panel represents State 4 respiration. All measurements were completed using mitochondria (0.25 mg/mL) in incubation medium (145 mM KCl, 5 mM KH2PO4, 30 mM Hepes, 3 mM MgCl2, and 0.1 mM EGTA, pH 7.4). A methyl-triphenyl-phosphonium (TPMP+; 0–2.5 μM) standard curve was generated in each sample prior to the initiation of respiration and membrane potential measurements. All assays were performed in the presence of 5 mM succinate, 5 μM rotenone, oligomycin (8 μg/mL) and nigericin (0.08 μg/mL), and incremental additions of malonate (0.1–2.4 mM).
Table 6.
Fatty Acid Composition (%) of Phosphatidyl Ethanolamine From Muscle Mitochondria of Mice Consuming a Control Diet (Control n = 4) or CR Diets Containing Lard (CR Lard n = 4) Soybean Oil (CR Soy n = 5), or Fish Oil (CR Fish n = 5)
| Control | CR fish | CR lard | CR soy | |
|---|---|---|---|---|
| 14:0 | 1.1 ± 0.1a | 4.9 ± 3.2a,b | 2.4 ± 0.8b | 5.4 ± 3.2a,b |
| 16:0 | 7.0 ± 0.7 | 8.0 ± 0.7 | 6.5 ± 0.6 | 7.5 ± 1.0 |
| 18:0 | 35.2 ± 1.9 | 32.4 ± 2.4 | 36.3 ± 1.1 | 32.9 ± 3.5 |
| 20:0 | 0.11 ± 0.02a,b | 0.11 ± 0.02a | 0.06 ± 0.02b | 0.14 ± 0.04a,b |
| 24:0 | 0.08 ± 0.03a | 0.15 ± 0.01b | 0.10 ± 0.02a,b | 0.12 ± 0.05a,b |
| 16:1n−7 | 0.76 ± 0.02a | 0.91 ± 0.07b | 0.73 ± 0.04a | 1.08 ± 0.35a,b |
| 18:1n−7 | 0.82 ± 0.09 | 0.77 ± 0.08 | 0.97 ± 0.08 | 0.98 ± 0.12 |
| 18:1n−9 | 3.8 ± 0.7 | 3.7 ± 0.7 | 4.2 ± 0.8 | 4.9 ± 0.6 |
| 22:1n−9 | 0.11 ± 0.04a,b | 0.23 ± 0.04a | 0.06 ± 0.02b | 0.24 ± 0.11a |
| 18:2n−6 | 5.6 ± 0.2a,b | 3.2 ± 0.8a | 5.1 ± 1.3a,b | 6.5 ± 1.0b |
| 18:3n−6 | 0.21 ± 0.02a | 0.34 ± 0.04b | 0.19 ± 0.01a | 0.52 ± 0.19b |
| 20:3n−6 | 2.1 ± 0.10a | 1.1 ± 0.13b | 2.1 ± 0.14a | 1.8 ± 0.42a-b |
| 20:4n−6 | 16.3 ± 0.4a | 11.3 ± 0.9b | 18.9 ± 0.7c | 15.3 ± 3.2a,b,c |
| 22:4n−6 | 0.47 ± 0.16a,b,c | 0.13 ± 0.01a | 0.80 ± 0.07b | 0.53 ± 0.07c |
| 22:5n−6 | 0.60 ± 0.21 | 0.63 ± 0.10 | 0.92 ± 0.08 | 1.45 ± 0.95 |
| 18:3n−3 | 0.09 ± 0.01a | 0.07 ± 0.02a,b | 0.05 ± 0.02b | 0.13 ± 0.04a |
| 20:5n−3 | 0.13 ± 0.10a | 0.66 ± 0.09b | 0.47 ± 0.30a,b | 0.12 ± 0.06a |
| 22:5n−3 | 2.1 ± 0.12a | 2.8 ± 0.17b | 1.7 ± 0.14a,c | 1.7 ± 0.13c |
| 22:6n−3 | 12.5 ± 1.6a | 18.1 ± 1.8b | 10.0 ± 1.6a | 10.1 ± 1.9a |
| Unsaturation Index | 183.9 ± 10.0 | 194.2 ± 8.3 | 180.9 ± 9.2 | 170.3 ± 6.7 |
| % SFA | 43.6 ± 2.5 | 46.0 ± 3.5 | 47.3 ± 0.6 | 48.7 ± 1.1 |
| % MUFA | 9.0 ± 1.2 | 7.8 ± 0.6 | 7.9 ± 0.6 | 9.0 ± 0.4 |
| % PUFA | 40.3 ± 1.8a,b | 38.6 ± 1.2a,b | 40.8 ± 1.0a | 38.4 ± 0.9b |
| % Total n−3 | 14.8 ± 1.7a | 21.7 ± 1.8b | 12.2 ± 1.4a | 12.1 ± 1.9a |
| % Total n−6 | 25.3 ± 0.5a | 16.7 ± 1.5b | 28.1 ± 0.7c,d | 26.2 ± 2.1a,d |
| HUFA | 34.6 ± 1.9 | 35.3 ± 1.6 | 35.6 ± 2.0 | 31.8 ± 1.9 |
| % n−3 HUFA* | 42.4 ± 2.6a | 61.3 ± 3.6b | 34.1 ± 2.3c,d | 38.6 ± 7.2a,d |
| % n−6 HUFA* | 57.1 ± 2.5a | 38.4 ± 3.6b | 64.6 ± 2.2a | 60.9 ± 7.0a |
Notes: CR = calorie restriction; HUFA = highly unsaturated fatty acid; MUFA = monounsaturated fatty acid; PUFA = polyunsaturated fatty acid; SFA = saturated fatty acid. Comparisons are between the treatments within a row. Values in rows that do not share a common superscript indicate a significant difference (p < .05) between treatments.
*Values are percent of total HUFA amount.
Lipid Peroxidation in Skeletal Muscle Mitochondria
TBARS were measured to assess lipid peroxidation in skeletal muscle mitochondria from the four groups of mice (Figure 3). Comparisons between the control and CR soy groups indicated no change in TBARS levels with 1 month of CR. However, comparisons between the CR groups indicated that dietary lipids did influence the levels of TBARS. CR mice consuming fish oil had higher mitochondrial TBARS when compared with CR mice consuming lard (p < .05). However, there were no differences in TBARS between the CR fish and CR soy groups or between the CR lard and CR soy groups. These results indicate that lipid peroxidation is increased in the diet group that consumed the highest amount of n−3 PUFA and had the greatest amount of n−3 PUFA in their mitochondrial membrane.
Figure 3.

Thiobarbituric acid reactive substances (nmol/mg protein) production in hind-limb muscle mitochondria at the end of 1 mo calorie restriction (CR) from mice consuming a control diet (Control n = 8) or CR diets containing lard (CR lard n = 8), soybean oil (CR soy n = 8), or fish oil (CR fish n = 8). Bars that do not share a common letter indicate a significant difference (p < .05) between treatments.
Discussions
Effect of Dietary Fats and CR on Mitochondrial Membrane Phospholipid Fatty Acid Composition
It has been proposed that CR may increase life span by preventing oxidative damage to membranes through a decrease in unsaturation of membrane phospholipids (9). However, it is possible that CR-induced changes in membrane phospholipids could also influence aging through changes in membrane-linked processes. The purpose of this study was to determine if mitochondrial phospholipid fatty acid composition influences alterations in mitochondrial ROS production and proton leak with CR. One strategy for determining the role membrane fatty acids play in the actions of CR is to use dietary lipids to alter membrane fatty acid composition. Dietary lipids have been shown to alter the fatty acid profile of mitochondrial membranes from liver (20,37,38), heart (37,38), brain (37), and skeletal muscle (38). Taken together, these dietary intervention studies have demonstrated that mitochondrial membrane composition is altered by dietary lipids in a manner reflecting the fatty acid content of the primary lipid source in the diets. It has been shown that these changes occur rapidly with alterations in rat heart mitochondrial phospholipid fatty acid composition observed within 10 days of changing dietary lipid composition (39). To our knowledge, however, there have been no studies using dietary lipids to manipulate mitochondrial membrane fatty acid composition in CR animals. It was reported that CR diluted the effects of dietary lipid manipulations on plasma membrane phospholipid fatty acid composition, and no differences in total membrane n−3 fatty acid content between animals consuming fish oil, safflower oil, or beef tallow were observed (40). In contrast, the results of our study indicate that CR does not prevent dietary lipids from altering muscle mitochondrial fatty acid composition. In particular, fish oil markedly increased n−3 fatty acid content in mitochondrial phospholipids from CR mice. The discrepancies between our findings and this previous study (40) could reflect differences in plasma and mitochondrial membrane response to dietary lipids. Also, the two studies used different tissues (muscle vs liver), which could contribute to the disparity in results. Nonetheless, the results of our study indicate that mitochondrial phospholipids in CR mice can be substantially altered by changes in diet lipid composition.
Table 7.
Fatty Acid Composition of (%) Cardiolipin From Muscle Mitochondria of Mice Consuming a Control Diet (Control n = 4) or CR Diets Containing Lard (CR Lard n = 4) Soybean Oil (CR Soy n = 5), or Fish Oil (CR Fish n = 5)
| Control | CR fish | CR lard | CR soy | |
|---|---|---|---|---|
| 16:0 | 6.7 ± 1.8a,b | 7.4 ± 0.5a | 4.4 ± 1.0b | 5.2 ± 1.1a,b |
| 18:0 | 3.0 ± 1.0 | 2.9 ± 0.4 | 2.5 ± 0.8 | 3.0 ± 0.6 |
| 20:0 | 0.05 ± 0.02 | 0.03 ± 0.01 | 0.01 ± 0.01 | 0.08 ± 0.04 |
| 24:0 | 0.13 ± 0.01a | 0.20 ± 0.02b | 0.10 ± 0.02a | 0.32 ± 0.09b |
| 16:1n−7 | 3.9 ± 0.3a | 8.3 ± 0.2b | 5.0 ± 0.3c | 3.3 ± 0.2a |
| 18:1n−7 | 12.9 ± 0.7a | 13.8 ± 0.5a | 12.3 ± 0.8b,c | 10.7 ± 0.4c |
| 18:1n−9 | 4.2 ± 0.6 | 4.1 ± 0.4 | 4.1 ± 0.5 | 4.5 ± 0.7 |
| 22:1n−9 | 0.08 ± 0.03 | 0.12 ± 0.05 | 0.09 ± 0.03 | 0.13 ± 0.04 |
| 18:2n−6 | 53.1 ± 3.6a | 35.4 ± 1.0b | 53.3 ± 2.9a | 55.6 ± 2.3a |
| 18:3n−6 | 0.35 ± 0.16 | 0.22 ± 0.07 | 0.27 ± 0.07 | 0.28 ± 0.08 |
| 20:3n−6 | 1.41 ± 0.22a | 1.39 ± 0.02a | 2.19 ± 0.20b | 1.15 ± 0.15a |
| 20:4n−6 | 0.9 ± 0.1a,b | 0.7 ± 0.0a | 0.8 ± 0.0b | 0.7 ± 0.0a,b |
| 22:4n−6 | 0.23 ± 0.06a | 0.10 ± 0.01b | 0.34 ± 0.11a | 0.21 ± 0.02a |
| 22:5n−6 | 0.25 ± 0.04a,b | 0.36 ± 0.02a | 0.38 ± 0.03a | 0.22 ± 0.01b |
| 18:3n−3 | 0.87 ± 0.03a | 0.65 ± 0.03b | 0.33 ± 0.01c | 0.84 ± 0.04a |
| 20:5n−3 | 0.10 ± 0.03a | 0.61 ± 0.04b | 0.10 ± 0.04a | 0.10 ± 0.02a |
| 22:5n−3 | 0.68 ± 0.09a | 1.10 ± 0.02b | 0.67 ± 0.07a | 0.78 ± 0.06a |
| 22:6n−3 | 6.3 ± 0.6a | 16.6 ± 0.7b | 8.4 ± 0.5c | 6.4 ± 0.4a |
| Unsaturation Index | 187.9 ± 10.1a | 223.7 ± 5.1b | 202.4 ± 7.0a,b | 190.7 ± 5.7a |
| % SFA | 10.0 ± 2.8 | 10.9 ± 0.9 | 7.2 ± 1.7 | 8.8 ± 1.6 |
| % MUFA | 22.2 ± 1.53a | 27.6 ± 0.67b | 22.7 ± 0.97a | 20.3 ± 1.02a |
| % PUFA | 66.2 ± 4.5a,b | 59.2 ± 1.5b | 68.6 ± 3.2a | 68.4 ± 2.6a |
| % Total n−3 | 8.1 ± 0.6a | 19.7 ± 0.6b | 9.7 ± 0.5a | 8.5 ± 0.4a |
| % Total n−6 | 58.1 ± 4.1a | 39.5 ± 1.1b | 58.9 ± 3.1a | 59.8 ± 2.5a |
| HUFA | 11.2 ± 1.0a,c | 22.5 ± 0.7b | 13.7 ± 0.7c | 11.1 ± 0.5a |
| % n−3 HUFA* | 72.7 ± 1.5a,c | 87.5 ± 0.3b | 70.8 ± 0.6c | 76.6 ± 1.3a |
| % n−6 HUFA* | 27.3 ± 1.5a,c | 12.5 ± 0.3b | 29.2 ± 0.6c | 23.4 ± 1.3a |
Notes: CR = calorie restriction; HUFA = highly unsaturated fatty acid; MUFA = monounsaturated fatty acid; PUFA = polyunsaturated fatty acid; SFA = saturated fatty acid. Comparisons are between the treatments within a row. Values in rows that do not share a common superscript indicate a significant difference (p < .05) between treatments.
* Values are percent of total HUFA amount.
It has been reported that CR increases 18:2n−6 and decreases long-chain PUFAs in liver (7,41), spleen (42), and heart (43) membrane phospholipids. However, little is known about the influence of CR on the membrane phospholipid composition of skeletal muscle mitochondria. It has been reported that CR increases 18:2n−6 and decreases long-chain PUFAs in liver mitochondrial phospholipids, but no significant changes in any fatty acids were observed in skeletal muscle mitochondria with CR (8). Our results indicate that muscle mitochondrial fatty acid alterations with short-term (1 month) CR depend on phospholipid class. In particular, there were no significant changes in muscle mitochondrial PE and CL fatty acids with CR. However, the fatty acid composition of skeletal muscle mitochondrial PC was altered by CR. CR resulted in an increase in relative content of n−3 HUFA and a concomitant decrease in n−6 HUFA. These changes in HUFA content were in part due to a decrease in the relative content of 20:4n−6. Our fatty acid data indicate that responsiveness to CR is phospholipid class dependent in muscle mitochondria with PC showing the most noticeable changes. These results are consistent with other studies, which have demonstrated that CR induces minor changes in membrane fatty acid composition in some tissues (reviewed in (44)).
When examining the effects of dietary lipids on mitochondrial phospholipid fatty acid composition within the CR groups, we found that fatty acid profiles of mitochondrial phospholipids reflected the n−6 and n−3 fatty acid composition of the dietary lipids. Overall, fish oil had greater influence on membrane phospholipid composition than lard or soybean oil. Specifically, fish oil resulted in the highest relative amount of n−3 and lowest n−6 fatty acid content in all three PL classes and the highest UI in PC and CL. In contrast, lard feeding resulted in the highest relative amount of n−6 HUFA and concomitant lowest n−3 HUFA in PC and CL. These results are in line with previous work which has shown that dietary PUFA plays a more important role in determining membrane lipid composition than dietary saturated or MUFAs (45) because mammals are able to synthesize saturated fats and MUFAs but not n−3 or n−6 PUFAs. The high n−3 PUFAs in fish oil translated to high n−3 levels in the mitochondrial membranes of the mice consuming this diet. Also, the high n−6/n−3 ratio in lard resulted in the highest relative amount of n−6 in HUFAs from the lard group. Thus, dietary lipids can be used as an effective way to manipulate the levels of n−6 and n−3 fatty acids in skeletal muscle mitochondria of CR mice.
Effect of Dietary Fats and CR on Mitochondrial ROS Production by Skeletal Muscle Mitochondria
In addition to membrane lipid changes, CR has also been reported to decrease mitochondrial ROS production in a variety of tissues (46,47). In skeletal muscle, mitochondrial ROS production is decreased with long-term CR (14,27) but the time course for this CR-induced decrease in ROS production is still not entirely clear. It has been reported that skeletal muscle mitochondrial ROS production is not altered following 2 months (48) or 3 months (8) of CR. In contrast, another study found that muscle mitochondrial H2O2 production was decreased after 2 weeks of CR and remained suppressed through later assessment points (13). The results of our study indicated that H2O2 production was not altered at 1 month of CR in mitochondria respiring on substrate (succinate, pyruvate/malate, or succinate/pyruvate/malate) without ETC inhibitors. However, 1 month of CR did alter H2O2 production when the sites of the ROS production were dissected using ETC inhibitors. Our data indicated diminished ROS producing capacity from both Complexes I and III in all three CR groups. These results indicate that CR produces relatively rapid (within 1 month) changes in the mitochondrial ETC, which could influence ROS production under conditions, which increase the redox state of the ETC.
In mitochondria, the major sites of ROS production are the Complexes I and III of the ETC (15). Because ROS are produced by these membrane-bound proteins, it is conceivable that mitochondrial membrane composition could influence the rate of ROS production. However, relatively little is known about the influence of membrane lipid composition on mitochondrial ROS production. Previous studies (20,21) have reported that increased n−3 HUFA content in liver mitochondrial membrane phospholipids is associated with decreased ROS production. In contrast, another study found basal rates of ROS production were not associated with membrane n−3 HUFA content in rat heart mitochondria (49). However, it is not known if fatty acid composition of mitochondrial phospholipids influences muscle mitochondrial ROS production in the same manner as in liver and heart. The results from our study indicate that alterations in mitochondrial phospholipid fatty acid composition do not significantly influence H2O2 production within CR regimens. Specifically, CR uniformly decreased H2O2 production regardless of skeletal muscle mitochondrial phospholipid fatty acid composition. Thus, the results of this study suggest that changes in skeletal muscle mitochondrial ROS production induced by short-term CR are exclusively due to protein changes.
Effect of Dietary Fats and CR on Muscle Mitochondrial Proton Leak
Mitochondrial proton leak is a membrane property that could be altered by CR and membrane lipid composition. Proton leak is a process where protons bypass the ATP synthase and passively cross the mitochondrial inner membrane. Overall proton leak is thought to consist of basal H+ leak that is unregulated and inducible H+ leak that is regulated by either the uncoupling proteins or the adenosine monophosphate/adenine nucleotide translocase pathway (50). It has been shown that basal proton leak increases with age (51–53), and it has been proposed that CR may oppose age-related increases in proton leak and improve mitochondrial efficiency by inducing a sustained decrease in proton leak (54). However, studies in liver have produced mixed results with CR inducing a decrease (26), increase (16), or no change (33,55) in mito-chondrial proton leak. In contrast, CR has generally been reported to decrease mitochondrial proton leak in skeletal muscle (14,24). Even very short-term CR (as little as 3 days) has been shown to be sufficient to decrease proton leak in muscle subsar-colemmal and intermyofibrillar mitochondria (25). The results of the present study are consistent with these findings with all of the CR groups showing a shift in the proton leak kinetics curve leftward (decrease in mitochondrial oxygen consumption) and upward (increase in membrane potential) indicating at least a trend toward decreased proton leak with CR.
It has been proposed that high HUFA content can modulate membrane packing leading to increased proton leak (56), and it has been reported that n−3 HUFA content of inner mitochondrial membrane phospholipids is positively correlated with proton leak (22). However, the overall influence of membrane lipid composition on proton leak is not entirely clear because comparative studies have indicate that membrane lipids play little role in proton leak differences between mammals of different body size (23). Also, studies using dietary (20) and genetic (21) approaches to increase n−3 HUFA content in mitochondrial phospholipids have found that proton leak is not altered in liver mitochondria with high levels of n−3 HUFA (20,21). The results of our study showed a shift in the proton leak kinetics curve toward decreased proton leak in all three CR groups regardless of mitochondrial fatty acid composition. Thus, these results indicate that CR-induced changes in muscle mitochondrial proton leak are largely independent of membrane lipid composition. However, the fact that the CR lard group had lower proton leak than all other groups indicates that dietary lipids do have some influence on proton leak. The CR lard mice had the lowest relative amount of n−3 HUFA in muscle mitochondrial phospholipids, and a decrease in proton leak in mitochondria from these animals is consistent with a positive association between n−3 HUFA and proton leak. However, additional studies are needed to determine the exact cause of the decrease in proton leak in the CR lard group.
A cornerstone of the membrane theory of aging is that increased lipid peroxidation and oxidative damage to membranes with increased levels of HUFA lead to a decrease in life span. In the present study, the CR fish group had a higher UI and increased levels of n−3 HUFAs in mitochon-drial phospholipids than the other diet groups. Despite consuming a diet containing twice the amount of the antioxidant t-butylhydroquinone as the other groups, the fish oil group had increased mitochondrial lipid peroxidation compared with both the control and CR lard groups. It is possible that mice may require more dietary antioxidants than rats when consuming fish oil because the level of antioxidant used in the present study did not produce increases in oxidative stress markers in rats fed a fish oil diet for six months (20). Our results are in agreement with other studies showing that fatty acid UI is positively associated with level of mitochondrial oxidative damage (49,57). Similarly, long-term ingestion of fish oil increased oxidative stress and decreased life span in senescence-accelerated mice (58). Studies of longer duration are needed to determine if the increase in lipid per-oxidation observed in the fish oil group translates to changes in mitochondrial ROS production and life span.
Conclusions
The results of the present study indicate that skeletal muscle mitochondrial membrane composition can readily be altered in CR mice by dietary lipids. Thus, dietary lipid manipulations can be used to determine if changes in mitochondrial phospholipid fatty acids contribute to specific actions of CR. The current study indicates that membrane lipid composition does not play a role in decreasing muscle mitochondrial H2O2 production following 1 month of CR. However, dietary lipid composition can influence mitochondrial proton leak response to short-term CR. Additional studies are needed to determine the long-term consequences of altering mitochondrial lipid composition in skeletal muscle and other tissues from CR animals.
Funding
This work was supported by the National Institutes of Health (RO1 AG028125 to K.H., G.L.L., J.M.V., P.N., and J.J.R.).
Supplementary Material
Supplementary material can be found at: http://biomedgerontology.oxfordjournals.org/
References
- 1. Weindruch R, Sohal RS. Seminars in medicine of the Beth Israel Deaconess Medical Center. Caloric intake and aging. N Engl J Med. 1997;337:986–994 [DOI] [PMC free article] [PubMed] [Google Scholar]
- 2. Yu BP. Membrane alteration as a basis of aging and the protective effects of calorie restriction. Mech Ageing Dev. 2005;126:1003–1010 [DOI] [PubMed] [Google Scholar]
- 3. Pamplona R, Portero-Otin M, Riba D, et al. Mitochondrial membrane peroxidizability index is inversely related to maximum life span in mammals. J Lipid Res. 1998;39:1989–1994 [PubMed] [Google Scholar]
- 4. Portero-Otin M, Bellmunt MJ, Ruiz MC, Barja G, Pamplona R. Correlation of fatty acid unsaturation of the major liver mitochondrial phospholipid classes in mammals to their maximum life span potential. Lipids. 2001;36:491–498 [DOI] [PubMed] [Google Scholar]
- 5. Hulbert AJ, Pamplona R, Buffenstein R, Buttemer WA. Life and death: metabolic rate, membrane composition, and life span of animals. Physiol Rev. 2007;87:1175–1213 [DOI] [PubMed] [Google Scholar]
- 6. Pamplona R, Barja G, Portero-Otin M. Membrane fatty acid unsaturation, protection against oxidative stress, and maximum life span: a homeoviscous-longevity adaptation? Ann N Y Acad Sci. 2002;959: 475–490 [DOI] [PubMed] [Google Scholar]
- 7. Laganiere S, Yu BP. Modulation of membrane phospholipid fatty acid composition by age and food restriction. Gerontology.1993;39:7–18 [DOI] [PubMed] [Google Scholar]
- 8. Faulks SC, Turner N, Else PL, Hulbert AJ. Calorie restriction in mice: effects on body composition, daily activity, metabolic rate, mitochondrial reactive oxygen species production, and membrane fatty acid composition. J Gerontol A Biol Sci Med Sci. 2006;61:781–794 [DOI] [PubMed] [Google Scholar]
- 9. Yu BP, Lim BO, Sugano M. Dietary restriction downregulates free radical and lipid peroxide production: plausible mechanism for elongation of life span. J Nutr Sci Vitaminol (Tokyo).2002;48:257–264 [DOI] [PubMed] [Google Scholar]
- 10. Lambert AJ, Brand MD. Reactive oxygen species production by mitochondria. Methods Mol Biol. 2009;554:165–181 [DOI] [PubMed] [Google Scholar]
- 11. Andreyev AY, Kushnareva YE, Starkov AA. Mitochondrial metabolism of reactive oxygen species. Biochemistry.2005;70:200–214 [DOI] [PubMed] [Google Scholar]
- 12. Murphy MP. How mitochondria produce reactive oxygen species. Biochem J. 2009;417:1–13 [DOI] [PMC free article] [PubMed] [Google Scholar]
- 13. Bevilacqua L, Ramsey JJ, Hagopian K, Weindruch R, Harper ME. Effects of short- and medium-term calorie restriction on muscle mitochondrial proton leak and reactive oxygen species production. Am J Physiol Endocrinol Metab. 2004;286:E852–E861 [DOI] [PubMed] [Google Scholar]
- 14. Bevilacqua L, Ramsey JJ, Hagopian K, Weindruch R, Harper ME. Long-term caloric restriction increases UCP3 content but decreases proton leak and reactive oxygen species production in rat skeletal muscle mitochondria. Am J Physiol Endocrinol Metab. 2005;289:E429–E438 [DOI] [PubMed] [Google Scholar]
- 15. Gredilla R, Barja G, Lopez-Torres M. Effect of short-term caloric restriction on H2O2 production and oxidative DNA damage in rat liver mitochondria and location of the free radical source. J Bioenerg Biomembr.2001;33:279–287 [DOI] [PubMed] [Google Scholar]
- 16. Lambert AJ, Merry BJ. Effect of caloric restriction on mitochondrial reactive oxygen species production and bioenergetics: reversal by insulin. Am J Physiol Regul Integr Comp Physiol. 2004;286:R71–R79 [DOI] [PubMed] [Google Scholar]
- 17. Sohal RS, Agarwal S, Candas M, Forster MJ, Lal H. Effect of age and caloric restriction on DNA oxidative damage in different tissues of C57BL/6 mice. Mech Ageing Dev. 1994;76:215–224 [DOI] [PubMed] [Google Scholar]
- 18. Judge S, Judge A, Grune T, Leeuwenburgh C. Short-term CR decreases cardiac mitochondrial oxidant production but increases carbonyl content. Am J Physiol Regul Integr Comp Physiol. 2004;286:R254–R259 [DOI] [PubMed] [Google Scholar]
- 19. Sanz A, Caro P, Ibanez J, Gomez J, Gredilla R, Barja G. Dietary restriction at old age lowers mitochondrial oxygen radical production and leak at complex I and oxidative DNA damage in rat brain. J Bioenerg Biomembr. 2005;37:83–90 [DOI] [PubMed] [Google Scholar]
- 20. Ramsey JJ, Harper ME, Humble SJ, et al. Influence of mitochondrial membrane fatty acid composition on proton leak and H2O2 production in liver. Comp Biochem Physiol B Biochem Mol Biol. 2005;140:99–108 [DOI] [PubMed] [Google Scholar]
- 21. Hagopian K, Weber KL, Hwee DT, et al. Complex I-associated hydrogen peroxide production is decreased and electron transport chain enzyme activities are altered in n−3 enriched fat−1 mice. PLoS One. 2010;5:e12696. [DOI] [PMC free article] [PubMed] [Google Scholar]
- 22. Brookes PS, Buckingham JA, Tenreiro AM, Hulbert AJ, Brand MD. The proton permeability of the inner membrane of liver mitochondria from ectothermic and endothermic vertebrates and from obese rats: correlations with standard metabolic rate and phospholipid fatty acid composition. Comp Biochem Physiol B Biochem Mol Biol. 1998;119:325–334 [DOI] [PubMed] [Google Scholar]
- 23. Porter RK, Hulbert AJ, Brand MD. Allometry of mitochondrial proton leak: influence of membrane surface area and fatty acid composition. Am J Physiol. 1996;271:R1550–R1560 [DOI] [PubMed] [Google Scholar]
- 24. Asami DK, McDonald RB, Hagopian K, Horwitz BA, Warman D, Hsiao A, et al. Effect of aging, caloric restriction, and uncoupling protein 3 (UCP3) on mitochondrial proton leak in mice. Exp Gerontol. 2008;43:1069–1076 [DOI] [PMC free article] [PubMed] [Google Scholar]
- 25. Johnson G, Roussel D, Dumas JF, et al. Influence of intensity of food restriction on skeletal muscle mitochondrial energy metabolism in rats. Am J Physiol Endocrinol Metab. 2006;291:E460–E467 [DOI] [PubMed] [Google Scholar]
- 26. Hagopian K, Harper ME, Ram JJ, Humble SJ, Weindruch R, Ramsey JJ. Long-term calorie restriction reduces proton leak and hydrogen peroxide production in liver mitochondria. Am J Physiol Endocrinol Metab. 2005;288:E674–E684 [DOI] [PubMed] [Google Scholar]
- 27. Lass A, Sohal BH, Weindruch R, Forster MJ, Sohal RS. Caloric restriction prevents age-associated accrual of oxidative damage to mouse skeletal muscle mitochondria. Free Radic Biol Med. 1998;25:1089–1097 [DOI] [PMC free article] [PubMed] [Google Scholar]
- 28. Seifert EL, Estey C, Xuan JY, Harper ME. Electron transport chain-dependent and -independent mechanisms of mitochondrial H2O2 emission during long-chain fatty acid oxidation. J Biol Chem. 2010;285:5748–5758 [DOI] [PMC free article] [PubMed] [Google Scholar]
- 29. Bligh EG, Dyer WJ. A rapid method of total lipid extraction and purification. Can J Biochem Physiol. 1959;37:911–917 [DOI] [PubMed] [Google Scholar]
- 30. Forsythe CE, Phinney SD, Feinman RD, et al. Limited effect of dietary saturated fat on plasma saturated fat in the context of a low carbohydrate diet. Lipids.2010;45:947–962 [DOI] [PMC free article] [PubMed] [Google Scholar]
- 31. Hyslop PA, Sklar LA. A quantitative fluorimetric assay for the determination of oxidant production by polymorphonuclear leukocytes: its use in the simultaneous fluorimetric assay of cellular activation processes. Anal Biochem. 1984;141:280–286 [DOI] [PubMed] [Google Scholar]
- 32. Venditti P, Pamplona R, Portero-Otin M, De Rosa R, Di Meo S. Effect of experimental and cold exposure induced hyperthyroidism on H2O2 production and susceptibility to oxidative stress of rat liver mitochondria. Arch Biochem Biophys.2006;447:11–22 [DOI] [PubMed] [Google Scholar]
- 33. Ramsey JJ, Hagopian K, Kenny TM, et al. Proton leak and hydrogen peroxide production in liver mitochondria from energy-restricted rats. Am J Physiol Endocrinol Metab. 2004;286:E31–E40 [DOI] [PubMed] [Google Scholar]
- 34. Cadenas S, Echtay KS, Harper JA, et al. The basal proton conductance of skeletal muscle mitochondria from transgenic mice over-expressing or lacking uncoupling protein-3. J Biol Chem. 2002;277:2773–2778 [DOI] [PubMed] [Google Scholar]
- 35. Buege JA, Aust SD. Microsomal lipid peroxidation. Methods Enzymol. 1978;52:302–310 [DOI] [PubMed] [Google Scholar]
- 36. Guerrero A, Pamplona R, Portero-Otin M, Barja G, Lopez-Torres M. Effect of thyroid status on lipid composition and peroxidation in the mouse liver. Free Radic Biol Med. 1999;26:73–80 [DOI] [PubMed] [Google Scholar]
- 37. Tahin QS, Blum M, Carafoli E. The fatty acid composition of subcellular membranes of rat liver, heart, and brain: diet-induced modifications. Eur J Biochem. 1981;121:5–13 [DOI] [PubMed] [Google Scholar]
- 38. Quiles JL, Martinez E, Ibanez S, et al. Ageing-related tissue-specific alterations in mitochondrial composition and function are modulated by dietary fat type in the rat. J Bioenerg Biomembr. 2002;34:517–524 [DOI] [PubMed] [Google Scholar]
- 39. Yamaoka S, Urade R, Kito M. Mitochondrial function in rats is affected by modification of membrane phospholipids with dietary sardine oil. J Nutr.1988;118:290–296 [DOI] [PubMed] [Google Scholar]
- 40. Cha MC, Jones PJ. Energy restriction dilutes the changes related to dietary fat type in membrane phospholipid fatty acid composition in rats. Metabolism. 2000;49:977–983 [DOI] [PubMed] [Google Scholar]
- 41. Laganiere S, Yu BP. Effect of chronic food restriction in aging rats. I. Liver subcellular membranes. Mech Ageing Dev. 1989;48:207–219 [DOI] [PubMed] [Google Scholar]
- 42. Venkatraman J, Fernandes G. Modulation of age-related alterations in membrane composition and receptor-associated immune functions by food restriction in Fischer 344 rats. Mech Ageing Dev. 1992;63:27–44 [DOI] [PubMed] [Google Scholar]
- 43. Lee J, Yu BP, Herlihy JT. Modulation of cardiac mitochondrial membrane fluidity by age and calorie intake. Free Radic Biol Med.1999;26:260–265 [DOI] [PubMed] [Google Scholar]
- 44. Pamplona R, Barja G. An evolutionary comparative scan for longevity-related oxidative stress resistance mechanisms in homeotherms. Biogerontology. 2011;12:409–435 [DOI] [PubMed] [Google Scholar]
- 45. Hulbert AJ, Turner N, Storlien LH, Else PL. Dietary fats and membrane function: implications for metabolism and disease. Biol Rev Camb Philos Soc. 2005;80:155–169 [DOI] [PubMed] [Google Scholar]
- 46. Gredilla R, Barja G. Minireview: the role of oxidative stress in relation to caloric restriction and longevity. Endocrinology.2005;146:3713–3717 [DOI] [PubMed] [Google Scholar]
- 47. Sohal RS, Weindruch R. Oxidative stress, caloric restriction, and aging. Science. 1996;273:59–63 [DOI] [PMC free article] [PubMed] [Google Scholar]
- 48. Gredilla R, Phaneuf S, Selman C, Kendaiah S, Leeuwenburgh C, Barja G. Short-term caloric restriction and sites of oxygen radical generation in kidney and skeletal muscle mitochondria. Ann N Y Acad Sci. 2004;1019:333–342 [DOI] [PubMed] [Google Scholar]
- 49. Herrero A, Portero-Otin M, Bellmunt MJ, Pamplona R, Barja G. Effect of the degree of fatty acid unsaturation of rat heart mitochondria on their rates of H2O2 production and lipid and protein oxidative damage. Mech Ageing Dev. 2001;122:427–443 [DOI] [PubMed] [Google Scholar]
- 50. Brookes PS. Mitochondrial H(+) leak and ROS generation: an odd couple. Free Radic Biol Med.2005;38:12–23 [DOI] [PubMed] [Google Scholar]
- 51. Hagen TM, Yowe DL, Bartholomew JC., et al. Mitochondrial decay in hepatocytes from old rats: membrane potential declines, heterogeneity and oxidants increase. Proc Natl Acad Sci USA. 1997;94:3064–3069 [DOI] [PMC free article] [PubMed] [Google Scholar]
- 52. Harper ME, Monemdjou S, Ramsey JJ, Weindruch R. Age-related increase in mitochondrial proton leak and decrease in ATP turnover reactions in mouse hepatocytes. Am J Physiol. 1998;275:E197–E206 [DOI] [PubMed] [Google Scholar]
- 53. Lal SB, Ramsey JJ, Monemdjou S, Weindruch R, Harper ME. Effects of caloric restriction on skeletal muscle mitochondrial proton leak in aging rats. J Gerontol Biol Sci. 2001;56:B116–B122 [DOI] [PubMed] [Google Scholar]
- 54. Ramsey JJ, Harper ME, Weindruch R. Restriction of energy intake, energy expenditure, and aging. Free Radic Biol Med. 2000;29:946–968 [DOI] [PubMed] [Google Scholar]
- 55. Lambert AJ, Merry BJ. Lack of effect of caloric restriction on bioenergetics and reactive oxygen species production in intact rat hepatocytes. J Gerontol A Biol Sci Med Sci.2005;60:175–180 [DOI] [PubMed] [Google Scholar]
- 56. Brand MD, Couture P, Hulbert AJ. Liposomes from mammalian liver mitochondria are more polyunsaturated and leakier to protons than those from reptiles. Comp Biochem Physiol Biochem Mol Biol. 1994;108:181–188 [DOI] [PubMed] [Google Scholar]
- 57. Pamplona R, Portero-Otin M, Sanz A, Requena J, Barja G. Modification of the longevity-related degree of fatty acid unsaturation modulates oxidative damage to proteins and mitochondrial DNA in liver and brain. Exp Gerontol. 2004;39:725–733 [DOI] [PubMed] [Google Scholar]
- 58. Tsuduki T, Honma T, Nakagawa K, Ikeda I, Miyazawa T. Long-term intake of fish oil increases oxidative stress and decreases lifespan in senescence-accelerated mice. Nutrition. 2011;27:334–337 [DOI] [PubMed] [Google Scholar]