Abstract
Multi-epitope-ligand cartography (MELC) is an innovative high-throughput fluorescence microscopy–based method. A tissue section is analyzed through a repeated cycling of (1) incubation with a fluorophore-labeled antibody, (2) fluorescence imaging, and (3) soft bleaching. This method allows staining of the same tissue section with up to 100 fluorescent markers and to analyze their toponomic expression using further image processing and pixel-precise overlay of the corresponding images. In this study, we adapted this method to identify a large panel of murine leukocyte subpopulations in a whole frozen section of a peripheral lymph node. Using the resulting antibody library, we examined non-inflamed versus inflamed tissues of brain and spinal cord in the experimental autoimmune encephalomyelitis (EAE) model. The presence and activity of specific leukocyte subpopulations (different T cell subpopulations, dendritic cells, macrophages, etc.) could be assessed and the cellular localizations and the corresponding activation status in situ were investigated. The results were then correlated with quantitative RT-PCR.
Keywords: cellular localization, degenerative immunohistochemistry, immunostaining, lymph
Our knowledge of increasing numbers of cell subtype and activation status markers enables more and more subtle distinctions of individual cell subpopulations with specific functions. Fluorescence-activated flow cytometry is the most common technology used routinely to analyze cell suspensions. Because flow cytometry is limited by the availability of discriminable fluorescence dyes, analyses with more than six colors are uncommon. Moreover, the location of an individual cell and its interaction with surrounding cells and matrix is lost in flow cytometry but provides additional important information. A better understanding of the phenotypic composition of tissue-infiltrating leukocytes in context with the cellular environment is essential for immunology. Besides the stages of differentiation and cellular activation, cell-cell and cell-matrix interactions are crucial factors defining the biological activity of individual cells in vitro. Immunohistology is the current approach to evaluate the presence and location of certain markers within organelles or membranes of cells in their physiological environment. But, even more than flow cytometry, immunohistology is limited by the number of distinguishable fluorescence dyes. Therefore, serial sections must be studied, but this approach no longer allows investigation of the same cells.
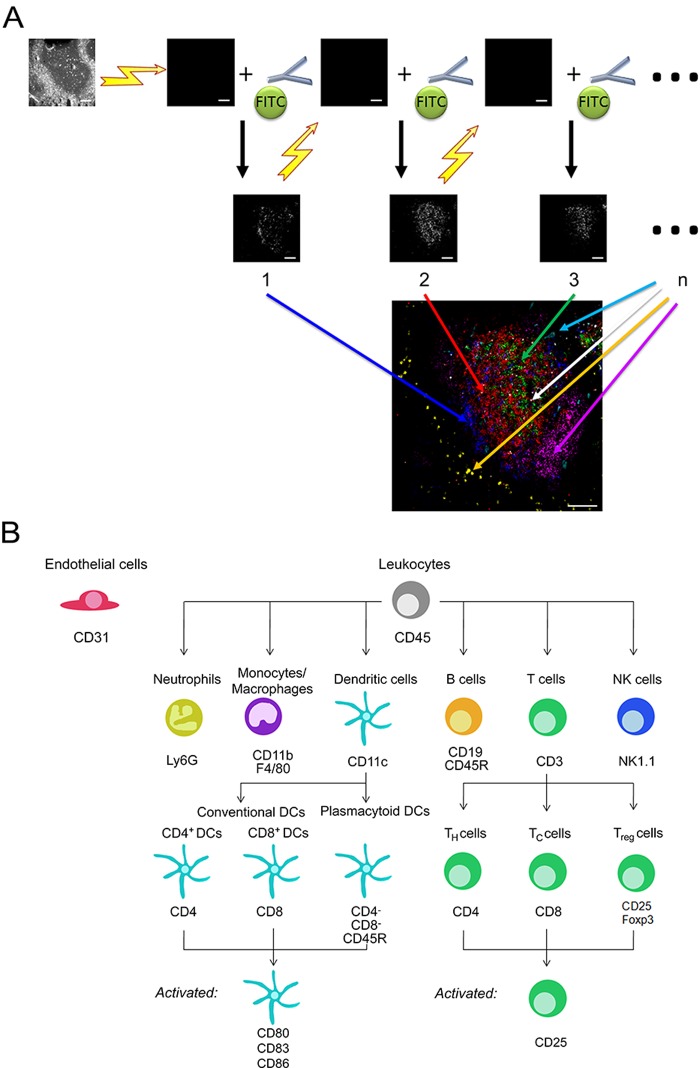
Recently, a new technique of automated multidimensional fluorescence microscopy was published to analyze proteome topology on structurally intact single cells as well as within the complexity of a tissue (Schubert et al. 2006). This technique, called multi-epitope-ligand cartography (MELC), enables the mapping of protein networks, the localization of different cell types, and the analysis of disease-related changes in the proteome (Schubert et al. 2006; Bonnekoh et al. 2007; Berndt et al. 2007; Ruetze et al. 2010). Cellular targets are labeled with fluorescent tags; subsequently, images of the fluorescence stainings are taken, and the fluorescence dye is completely bleached (Fig. 1A). Strikingly, this process can be repeated on the same sample, for all targets of interest, up to one hundred times (Schubert et al. 2006).
Figure 1.
(A) Concept of the multi-epitope-ligand cartography (MELC) technology. MELC builds on fluorescence imaging by bleaching each dye completely after labeling and imaging and then applying another set of labeled antibodies to image the localization of additional molecules. After repeating these steps many times, the superimposed images provide detailed molecular localization maps. Large MELC image of murine spleen tissue: CD4 (red), CD8a (green), CD11c (blue), CD19 (magenta), CD31 (cyan), Foxp3 (white), and Ly6G (yellow). (B) MELC allows the simultaneous detection of the indicated murine leukocytes. The various blood and tissue cells derived from lymphoid or myeloid progenitor cells as well as their activation and differentiation state can be detected. Bars = 100 µm.
The toponome of a cell undergoes constant changes due to migration, differentiation, changes in the cell cycle status, and its activation status. If alterations occur only in a small fraction of cells, such as in invading immune cells, stem cells, or tumor cells, the detection of these changes becomes difficult. With the MELC technology, different subpopulations of lymphocytes have been characterized in the blood of patients with psoriasis (Bonnekoh et al. 2006). The binding of a CD11a antibody to affected and unaffected psoriatic skin was studied, and combinatorial molecular phenotypes were investigated (Bonnekoh et al. 2007). The MELC application platform was also used in lymphoma diagnostics using tumor marker combinatorics for immunophenotyping, including its quantification and visualization (Bonnekoh et al. 2008), as well as in comparative topoproteome analysis of eczema (Eyerich et al. 2010). Furthermore, significant immunological changes in colorectal cancer were characterized using the MELC method (Berndt et al. 2008). In skin, identification of discrete p63-positive basal keratinocytes made it possible to localize epidermal stem cells in situ (Ruetze et al. 2010).
In the present study, the MELC technique was modified, on one hand, to characterize all major cell types that build a complete lymphatic organ, a murine lymph node; on the other hand, to show that the MELC technique is a valuable tool for the detection and classification of inflammatory-driven diseases. Using experimental autoimmune encephalitis (EAE), a commonly employed animal model of multiple sclerosis (MS), we could detect a variety of inflammatory cells (different T cell subpopulations, dendritic cells [DCs], macrophages/microglial cells, granulocytes, and natural killer [NK] cells) in the central nervous system (CNS) of EAE-diseased mice.
Materials and Methods
Animals
C57BL/6N mice (Charles River Laboratories, Sulzfeld, Germany) were housed under specific pathogen-free conditions. All animal experiments were performed in accordance with institutional, state, and federal guidelines.
EAE Induction
C57BL/6N mice (sex: male; age: 13 weeks) were immunized subcutaneously with 50 µg myelin oligodendrocyte glycoprotein (MOG) peptide 35–55 (Sigma-Genosys; St. Louis, MO) in 50 µl H2O emulsified in 50 µl CFA (Sigma-Aldrich; St. Louis, MO) that was enriched with 10 µg/ml Mycobacterium tuberculosis (H37Ra; Difco, Detroit, MI) at day 0 to induce EAE. In addition, 200 ng pertussis toxin (List Biological Laboratories; Campbell, CA) was administered intraperitoneally at days 0 and 2. EAE paralysis was scored as follows: 0, no disease; 1, tail weakness; 2, paraparesis; 3, paraplegia; 4, paraplegia with forelimb weakness; and 5, moribund or dead animals. The mice were sacrificed at day 13. Brain and spinal cord were removed and stored in RNAlater solution (Life Technologies; Darmstadt, Germany) at −80C.
qRT-PCR
After thawing, total RNA was prepared from brain and spinal cord using the RNeasy Plus Mini Kit (Qiagen; Hilden, Germany). Traces of genomic DNA were removed by DNase digestion with the RNase-free DNase Set (Qiagen). Subsequently, 1 µg RNA was reverse transcribed into single-stranded (ss) cDNA using the First Strand cDNA Synthesis Kit (Fermentas; St. Leon-Rot, Germany) as specified by the manufacturer. Real-time RT-PCR was performed in the LightCycler 2.0 (Roche; Basel, Switzerland) using the DyNAmo Capillary SYBR Green qPCR Kit (Finnzymes; Vantaa, Finland) and specific primers for hypoxanthine phosphoribosyltransferase (HPRT) (5′-gttggatacaggccagactttgttg-3′ and 5′-gattcaactt gcgctcatcttaggc-3′), CD3e (5′-atgcggtggaacactttctgg-3′ and 5′-gcacgtcaactctacactggt-3′), CD4 (5′-caagcgcctaagagaga tgg-3′ and 5′-cacctgtgcaagaagcagag-3′), CD11b (5′-atggac gctgatggcaatacc-3′ and 5′-tccccattcacgtctccca-3′), CD45 (5′-cagaaacgcctaagcctagttg-3′ and 5′-aggcaagtaggga cacttcatag-3′), Foxp3 (5′-cccaggaaagacagcaacctt-3′ and 5′-ccttgcctttctcatccagga-3′), and Ly6G (5′-cgcgtgcttgtagg tatgct-3′ and 5′-cgaagggtcttctaagaggca-3′); all primers were purchased from Eurofins MWG Operon (Ebersberg, Germany). The levels of gene expression normalized to HPRT were calculated using relative quantification (ΔΔCt) study software (LightCycler Software 4.05; Roche).
Sample Preparation
Cryostat tissue sections (5 µm) from spleen, lymph nodes, brain, and spinal cord of mice were prepared using a cryotome (CM 3050 S; Leica, Wetzlar, Germany). Samples were stored at −20C for several days or at −80C for longer intervals until use. For subsequent MELC analysis, the samples were incubated in acetone for 10 min at −20C and then air-dried for 10 min at room temperature. To rehydrate the sections, we incubated them with phosphate-buffered saline (PBS; pH 7.4; Lonza, Verviers, Belgium) for 5 min and then rinsed them five times in PBS. The samples were incubated in normal goat serum (1:30 in PBS) for 30 min and then washed five times with PBS.
MELC Technology
For the MELC data acquisition, a single tissue slide was placed on the stage of a fluorescence microscope, which is part of the MELC robot technology (US patent 6,150,173). This technology involves distinct hardware and software components as described earlier (Schubert et al. 2006; Bonnekoh et al. 2007). In brief, by a robotic process, FITC-labeled antibodies and wash solutions (PBS; Lonza) were added and removed under temperature controlled conditions. The phase contrast and fluorescence images were acquired by an inverted wide-field fluorescence microscope (DM IRE2; ×20 air lens; numerical aperture 0.7; Leica) with a cooled CCD camera (KX4; Apogee Imaging Systems, Roseville, CA), followed by soft bleaching (centered at 488 nm for FITC). Recording of all image data and coordination of all system components were controlled by software developed by MelTec GmbH & Co KG (Magdeburg, Germany). All of these processes (Ab binding/fluorescence detection/soft bleaching) were part of a fully automated cycle repeated for any given number of antibodies (Fig. 1A). As a control for unspecific tag-binding, the first MELC cycles were performed with FITC-labeled mouse IgG in different dilutions.
MELC Data Analysis
The fluorescence images produced for each tag-binding site were aligned pixel-wise using the corresponding phase-contrast images. Flat-field corrections were used to correct the images for illumination.
Results
MELC for the Detection of Murine Leukocytes
Using the MELC technique, it is possible to map the localization of up to 100 proteins (Schubert et al. 2006) in one tissue section or sample of cells using sequential rounds of fluorescence detection in situ. The sample is stained with fluorescence-labeled antibodies, an image is taken, and then the dye is completely bleached, and these steps are repeated, as shown in Fig. 1A. Thereby, MELC illustrates the spatial and temporal interactions of proteins, providing insights into functional networks. As a proof of principle, we established an antibody panel of 20 markers for leukocyte and endothelial cell subpopulations. Because we successfully selected a range of antibodies that bind to at least one specific epitope on all murine leukocytes (Suppl. Table S1), MELC offers the theoretical possibility of detecting all blood and tissue cells derived from the lymphoid or myeloid progenitor cell (Fig. 1B). Therefore, MELC is a valuable tool to visualize the cell composition of lymphoid organs and inflamed tissues. Expansion of the here described panel with additional available selection and/or activation markers is feasible.
MELC for the Characterization of Lymphoid Organs
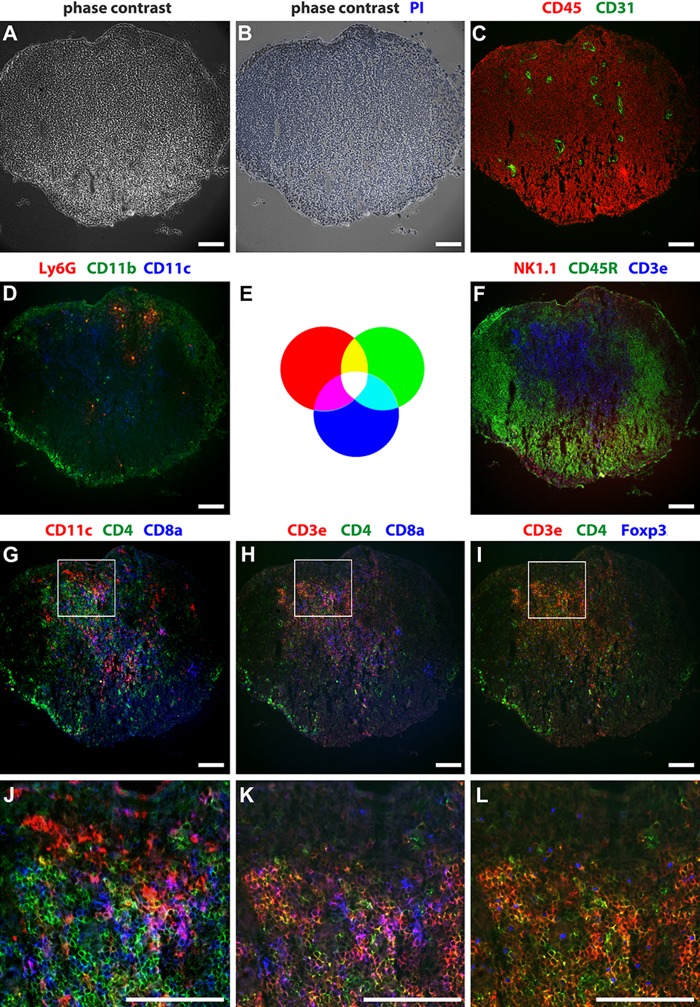
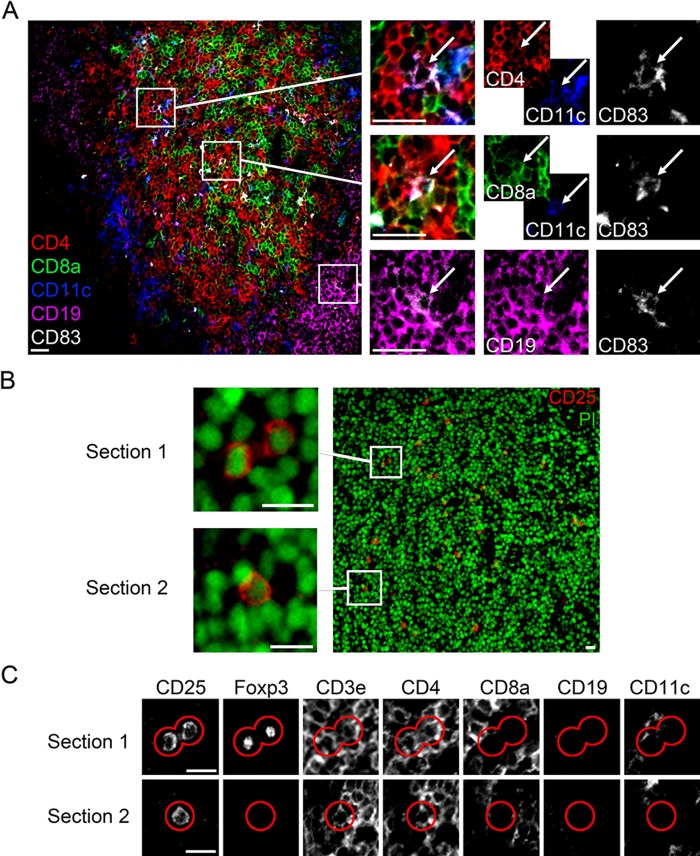
To apply the MELC technique on a whole lymphoid organ, we mapped 10 cell surface molecules, one intracellular molecule, and, in addition, the nuclei in a murine popliteal lymph node. As illustrated in Fig. 2, the MELC image displays the typical lymph node architecture. The lymph node is surrounded by a fibrous capsule. Almost all cells that build the lymph node carry the leukocyte common antigen CD45 (Fig. 2C, red). CD31+ blood vessels are distributed throughout the lymph node (Fig. 2C, green). The architecture of the lymph node is separated into the outer cortex, the paracortex, and the inner medulla. The outer cortex mainly consists of tightly packed CD45R+ B cells (Fig. 2F, green) arranged as follicles, and the paracortex mainly consists of CD3+ T cells (Fig. 2F, blue). The more wide-meshed medulla consists again mainly of CD45R+ B cells (Fig. 2F, green). CD11b+ macrophages are mainly located on the floor of the subcapsular sinus (Farr et al. 1980) and in the medulla (Fig. 2D, green). In the paracortex, T cells especially interact with CD11c+ dendritic cells (Fig. 2D vs. F, blue) (Willard-Mack 2006). A few Ly6G+ neutrophil granulocytes are located between the cortex and paracortex (Fig. 2D, red). NK1.1+ natural killer cells reside in the paracortex and in the medulla (Fig. 2F, red) (Bajénoff et al. 2006). Using additional selection markers, we could further distinguish between DC and T cell subpopulations (Fig. 2G–L). The magnification (Fig. 2J–L) of a tissue area where the cortex and paracortex meet allows a deeper insight into the interaction mode of dendritic cells (DC) and T cells as well as a more specific characterization of the involved T cells. CD11c+ DC can be further subdivided into CD11c+CD4+ (yellow) and CD11c+CD8+ (magenta) conventional DC (Fig. 2G, J) and CD11c+CD45R+ plasmacytoid DC (not shown). Here, we could distinguish between the three main T cell populations next to DC and B cells in one single tissue slide. As shown in Fig. 2H, K, we can distinguish CD3+CD4–CD8– DN T cells (red), representing 1% to 5% of T cells in mouse (Zhang et al. 2001), as well as CD3+CD4+ T helper cells (yellow) and CD3+CD8+ cytotoxic T cells (magenta). As expected, there is only a very minor population of CD3+CD4+CD8+ T cells. In addition, we can further discriminate CD3+CD4+Foxp3+ regulatory T cells from T helper cells (yellow with a blue nucleus) (Fig. 2I, L). Thus, it is possible to map different molecules in a single section and to display them in different combination, which allows the characterization of distinct immune cell populations within a whole organ. To analyze the activation state of different immune cells, we detected the activation markers CD83 and CD25 in a murine spleen. CD83 is expressed on the surface of CD11c+CD4+ and CD11c+CD8+ conventional DC as well as on CD19+ B cells (Fig. 3A). CD25 is expressed on activated CD3+CD4+ T helper cells (Fig. 3B, C, section 2) and on CD3+CD4+Foxp3+ regulatory T cells (Fig. 3B, C, section 1). The corresponding isotype controls clearly demonstrate the specificity of the stainings (Suppl. Fig. S2). In addition, it is now possible to extend the characterization or to use this technique to analyze inflammatory infiltration (see below).
Figure 2.
Mapping of cellular proteins by multi-epitope-ligand cartography (MELC) running 12 incubation-imaging-bleaching cycles on a single lymph node section. (A–L) MELC images of the same popliteal lymph node section, whereby J to L represent one enlarged tissue region of G to I. (E) The RGB wheel illustrates color combinations after overlay. (A) Phase contrast. (B) Phase contrast with propidium iodide (blue). (C) CD45+ (red), CD31+ (green). (D) Ly6G+ (red), CD11b+ (green), CD11c+ (blue). (F) NK1.1+ (red), CD45R+ (green), CD3e+ (blue). (G, J) CD11c+ (red), CD4+ (green), CD8a+ (blue). (H, K) CD3e+ (red), CD4+ (green), CD8a+ (blue). (I, L) CD3e+ (red), CD4+ (green), intracellular Foxp3+ (blue). Bars = 100 µm.
Figure 3.
Detection of the activation markers CD83 (A) and CD25 (B, C) in a murine spleen. (A) Multi-epitope-ligand cartography (MELC) images: CD83 (white) is expressed by CD4+ (red)/CD11c+ (blue) dendritic cells, by CD8a+ (green)/CD11c+ (blue) dendritic cells, and by CD19+ (magenta) B cells. Bars = 25 µm. (B) MELC image of murine spleen tissue with magnified sections 1 and 2; CD25 (red), propidium iodide (green). Bars = 10 µm. (C) Marker mapping of depicted cells (red line) in sections 1 and 2. Bars = 10 µm.
Characterization of Inflammatory Infiltrates in EAE Using MELC
To further evaluate the potential of the MELC technique in a murine disease model, we mapped several leukocyte surface molecules in the spinal cord and brain of EAE-diseased mice and of healthy control mice. EAE was induced by the subcutaneous injection of MOG peptide (35–55). The induced immune responses develop rapidly, and in general, within 2 weeks, one can observe inflammation in the CNS. Thereafter, focal inflammatory cell infiltrates can be detected in the CNS, and the mice suffer from progressively ascending (tail to hind limbs to forelimbs) paralysis (Costa et al. 2003).
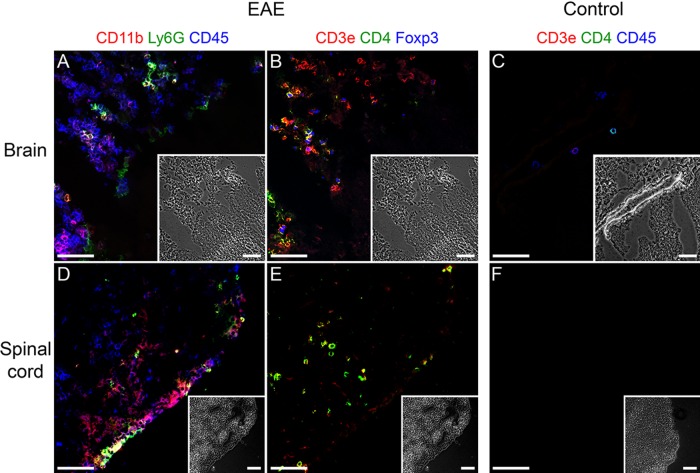
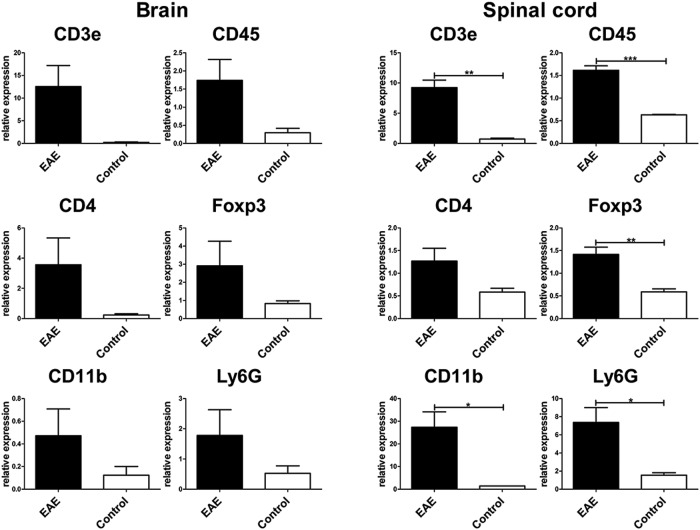
The spinal cord and brain of EAE-diseased mice (day 13 after EAE induction) showed a strong infiltration of CD45+ leukocytes (Fig. 4A, D, blue). A large fraction of the leukocytes consisted of CD45+CD11b+ macrophages/microglial cells, and a smaller fraction consisted of CD45+Ly6G+ neutrophil granulocytes (Fig. 4A, D). In the brains of EAE-diseased mice, large amounts of CD3+ T cells were present (Fig. 4B, red). Some of the T cells coexpressed the T helper cell marker CD4 (yellow) and some, in addition, the regulatory T cell–specific transcription factor Foxp3 (Fig. 4B, yellow with a blue nucleus). In the spinal cord, smaller amounts of CD3+ T cells were detectable (Fig. 4E), and almost all of them coexpressed CD4, but none of them coexpressed Foxp3 (Fig. 4E). In healthy brain, only four CD45+ leukocytes were detected in the proximity of a blood vessel (Fig. 4C, blue). One leukocyte turned out to be a CD3+CD4– T cell and one a CD3+CD4+ T helper cell. There was no inflammatory infiltrate present in the spinal cord of healthy mice (Fig. 4F). To verify the MELC images, we performed quantitative RT-PCR analysis for CD3, CD4, CD11b, CD45, Foxp3, and Ly6G mRNA from the spinal cord and brain of EAE-diseased mice and untreated control mice. As the MELC images indicate, EAE-diseased mice expressed more CD3, CD4, CD11b, CD45, Foxp3, and Ly6G mRNA than untreated control mice in the spinal cord as well as in the brain (Fig. 5).
Figure 4.
Detection of different CD markers in a tissue section of brain and spinal cord using the multi-epitope-ligand cartography (MELC) technique. (A, B, D, E) Organs of experimental autoimmune encephalomyelitis (EAE)–diseased mice (day 13 after EAE induction). (C, F) Organs of untreated control mice. (A, B, C) Brain. Note: A and B show the same section. (D, E, F) Spinal cord. Note: D and E show the same section. (A, D) MELC images: CD45+ (blue), CD11b+ (red), Ly6G+ (green). (B, E) MELC images: CD3e+ (red), CD4+ (green), Foxp3+ (blue). (C, F) MELC images: CD45+ (blue), CD3e+ (red), CD4+ (green). Each MELC image is depicted with its corresponding phase contrast image. Bars = 50 µm.
Figure 5.
Quantitative RT-PCR analysis of CD3e, CD4, CD11b, CD45, Foxp3, and Ly6G mRNA in the spinal cord and brain of untreated control mice (n=3) and experimental autoimmune encephalomyelitis (EAE)-diseased mice (n=4). Results were normalized to the expression of hypoxanthine phosphoribosyltransferase (HPRT). Data represent the mean ± SEM. Data were analyzed using unpaired t-test. Statistical significance has been defined as follows: *p<0.05; **p<0.01; ***p< 0.001. Data are representative of three experiments.
Discussion
In the present study, the MELC technique was applied to characterize most of the major cell types in a single tissue section. We selected antibodies against markers for leukocyte and endothelial cell subpopulations (Fig. 1B; Suppl. Table S1) and used the technique for the first time on a whole lymphatic organ, a popliteal lymph node. Ten cell surface molecules, one intracellular molecule (Foxp3), and the nuclei were mapped on one single tissue section (Fig. 2). Although up to 17-color flow cytometry data have been published by individual labs, analyses with >6 colors are uncommon (Perfetto et al. 2004). Obviously, flow cytometry is limited by the number of distinguishable fluorescence dyes. In contrast, only one dye, preferably FITC-conjugated antibodies, is necessary in the MELC technique. Hence, there are no limitations because of the availability of discriminable antibody dyes. In addition, the MELC technique shows the location of one individual cell and its interaction with the surrounding cells and matrix, whereas this information is completely lost in flow cytometry. Of course, multicolor stainings are reasonable only if you can clearly separate markers of distinct populations without any overlap. As an example, we added a seven-color staining in Fig. 1A. There is also a method to analyze the images automatically using combinatorial molecular phenotypes (CMP), where binarized signals are analyzed in a pixel-based manner (Schubert et al. 2006). This was used to distinguish healthy tissue from diseased tissue (Bonnekoh et al. 2007). But to date, it is still very challenging to define single cells in a tissue with fluorescence-based signals. Therefore, we have chosen to analyze non-binarized signals to define cellular subpopulations. In most cases, a parallel comparison of three-color stainings of the same tissue section is more convenient (Fig. 2). But the huge advantage of the MELC technique over serial staining is that you analyze the same cells distributed on one single section.
Here, we could localize simultaneously three DC subpopulations in relation to B- and T cell areas of a murine lymph node (Fig. 2). It has been shown that the different DC subpopulations have distinct functions regulating immune responses; therefore, it is absolutely essential to analyze their localization and interacting cell types in the tissues of disease models (Kronin et al. 2001; Domínguez and Ardavín 2010; Liu and Nussenzweig 2010; Fries and Griebel 2011). A growing number of markers for more advanced division of DCs into subpopulations make it inevitable to use this MELC technique. DCs activate T cells, and for functional understanding, it is necessary to discriminate the DC subpopulations and their T cell interaction partners in situ. In addition to the DCs, we mapped CD3+CD4+ helper, CD3+CD8+ cytotoxic, CD3+CD4+Foxp3+ regulatory, and CD3+CD4–CD8– T cells according to their local distribution within the lymph node (Fig. 2). The activation state of DCs, T cells, and B cells was analyzed in conjunction with basal CD83 and CD25 expression (Fig. 3).
Furthermore, we investigated whether the MELC technique could be a valuable tool for the detection and classification of inflammatory-driven diseases. To test this, MELC experiments were performed on brain and spinal cord from EAE-diseased mice. EAE is a model for the first, inflammatory phase of MS plaque generation (Wekerle 1991). MS plaques are not fully understood yet, but differences in immunopathology seem to result in various forms of MS (Lucchinetti et al. 2000). Here, we successfully used MELC to show that the plaques in the CNS of EAE-diseased mice mainly consist of different T cell subpopulations, macrophages/microglial cells, and granulocytes (Fig. 4). According to severe pathological scores in the progress of EAE (Suppl. Fig. S1), we identified an increased number of several inflammatory cell types in the brain and spinal cord sections of mice at the peak of the disease on day 13 (Fig. 4). Among the infiltrating CD45+ leukocytes were distinct populations of CD3+CD4+ T helper cells and Foxp3+ regulatory T cells (Fig. 4B, E). Another major population consisted of CD11b+ macrophages/microglial cells and a minor population of Ly6G+ granulocytes (Fig. 4A, D). Further quantitative RT-PCR analysis confirmed the MELC data of the identified markers in the brain and spinal cord tissues of diseased animals (Fig. 5). These results are consistent with the finding that MS plaques primarily contain T cells and activated macrophage/microglial cells (Pittock and Lucchinetti 2007).
Because MELC is a useful technique to study the inflammatory infiltrate in EAE, it could be used in the future to study EAE lesions of genetically modified mice and to evaluate drug responsiveness of potential targets for human MS therapy. We showed that the MELC technology is a valuable tool to analyze leukocyte cell composition of inflammatory infiltrates in murine model systems. The only limitation of the technique is the availability and quality of the antibodies used for staining. In principle, the method can be used to answer scientific questions where it is necessary to characterize the spatial distribution of cells and proteins—the toponome of a tissue.
Supplementary Material
Acknowledgments
We appreciate the critical reading and fruitful discussions by Alexander Steinkasserer. We also thank Elisabeth Thurau for her excellent technical assistance and Stefan Schnetz for digital image processing.
Footnotes
Declaration of Conflicting Interests: The authors declared no potential conflicts of interest with respect to the research, authorship, and/or publication of this article.
Funding: The authors disclosed receipt of the following financial support for the research, authorship, and/or publication of this article: The study was partially supported by the IZKF TP A46, GRK 1071, and SFB 643.
Supplementary material for this article is available on the Journal of Histochemistry & Cytochemistry Web site at http://jhc.sagepub.com/supplemental.
References
- Bajénoff M, Breart B, Huang AYC, Qi H, Cazareth J, Braud VM, Germain RN, Glaichenhaus N. 2006. Natural killer cell behavior in lymph nodes revealed by static and real-time imaging. J Exp Med. 203(3):619–631 [DOI] [PMC free article] [PubMed] [Google Scholar]
- Berndt U, Bartsch S, Philipsen L, Danese S, Wiedenmann B, Dignass AU, Hämmerle M, Sturm A. 2007. Proteomic analysis of the inflamed intestinal mucosa reveals distinctive immune response profiles in Crohn disease and ulcerative colitis. J Immunol. 179:295–304 [DOI] [PubMed] [Google Scholar]
- Berndt U, Philipsen L, Bartsch S, Wiedenmann B, Baumgart DC, Hämmerle M, Sturm A. 2008. Systemic high-content proteomic analysis reveals substantial immunologic changes in colorectal cancer. Cancer Res. 68(3):880–888 [DOI] [PubMed] [Google Scholar]
- Bonnekoh B, Böckelmann R, Pommer AJ, Malykh Y, Philipsen L, Gollnick H. 2007. The CD11a binding site of efalizumab in psoriatic skin tissue as analysed by multi-epitope-ligand cartography robot technology. Skin Pharmacol Physiol. 20:96–111 [DOI] [PubMed] [Google Scholar]
- Bonnekoh B, Malykh Y, Böckelmann R, Bartsch S, Pommer AJ, Gollnick H. 2006. Profiling lymphocyte subpopulations in peripheral blood under efalizumab treatment of psoriasis by multi epitope ligand cartography (MELC) robot microscopy. Eur J Dermatol. 16(6):623–635 [PubMed] [Google Scholar]
- Bonnekoh B, Pommer AJ, Böckelmann R, Hofmeister H, Philipsen L, Gollnick H. 2007. Topo-proteomic in situ analysis of psoriatic plaque under efalizumab treatment. Skin Pharmacol Physiol. 20:237–252 [DOI] [PubMed] [Google Scholar]
- Bonnekoh B, Pommer AJ, Böckelmann R, Philipsen L, Hofmeister H, Gollnick H. 2008. In-situ-topoproteome analysis of cutaneous lymphomas: perspectives off assistance for dermatohistologic diagnostics by multi-epitope-ligand cartography (MELC). J Dtsch Dermatol Ges. 6:1038–1052 [DOI] [PubMed] [Google Scholar]
- Costa O, Divoux D, Ischenko A, Tron F, Fontaine M. 2003. Optimization of an animal model of experimental autoimmune encephalomyelitis achieved with a multiple MOG(35-55)peptide in C57BL6/J strain of mice. J Autoimmun. 20(1):51–61 [DOI] [PubMed] [Google Scholar]
- Domínguez PM, Ardavín C. 2010. Differentiation and function of mouse monocyte-derived dendritic cells in steady state and inflammation. Immunol Rev. 234(1):90–104 [DOI] [PubMed] [Google Scholar]
- Eyerich K, Böckelmann R, Pommer AJ, Foerster S, Hofmeister H, Huss-Marp J, Cavani A, Behrendt H, Ring J, Gollnick H, et al. 2010. Comparative in situ topoproteome analysis reveals differences in patch test–induced eczema: cytotoxicity dominated nickel versus pleiotrop pollen reaction. Exp Dermatol. 19:511–517 [DOI] [PubMed] [Google Scholar]
- Farr AG, Cho Y, De Bruyn PP. 1980. The structure of the sinus wall of the lymph node relative to its endocytic properties and transmural cell passage. Am J Anat. 157(3):265–284 [DOI] [PubMed] [Google Scholar]
- Fries PN, Griebel PJ. 2011. Mucosal dendritic cell diversity in the gastrointestinal tract. Cell Tissue Res. 343(1):33–41 [DOI] [PubMed] [Google Scholar]
- Kronin V, Fitzmaurice CJ, Caminschi I, Shortman K, Jackson DC, Brown LE. 2001. Differential effect of CD8+ and CD8– dendritic cells in the stimulation of T cells. Int Immunol. 13(4):465–473 [DOI] [PubMed] [Google Scholar]
- Liu K, Nussenzweig MC. 2010. Origin and development of dendritic cells. Immunol Rev. 234(1):45–54 [DOI] [PubMed] [Google Scholar]
- Lucchinetti C, Brück W, Parisi J, Scheithauer B, Rodriguez M, Lassmann H. 2000. Heterogeneity of multiple sclerosis lesions: implications for the pathogenesis of demyelination. Ann Neurol. 47(6):707–717 [DOI] [PubMed] [Google Scholar]
- Perfetto SP, Chattopadhyay PK, Roederer M. 2004. Seventeen-color flow cytometry: unravelling the immune system. Nat Rev Immunol. 4(8):648–655 [DOI] [PubMed] [Google Scholar]
- Pittock SJ, Lucchinetti CF. 2007. The pathology of MS: new insights and potential clinical applications. Neurologist. 13(29):45–56 [DOI] [PubMed] [Google Scholar]
- Ruetze M, Gallinat S, Wenck H, Deppert W, Knott A. 2010. In situ localization of epidermal stem cells using a novel multi epitope ligand cartography approach. Integr Biol. 2:241–249 [DOI] [PubMed] [Google Scholar]
- Schubert W, Bonnekoh B, Pommer AJ, Philipsen L, Böckelmann R, Malykh Y, Gollnick H, Friedenberger M, Bode M, Dress AWM. 2006. Analyzing proteome topology and function by automated multi-dimensional fluorescence microscopy. Nat Biotechnol. 24:1270–1278 [DOI] [PubMed] [Google Scholar]
- Wekerle H. 1991. Immunopathogenesis of multiple sclerosis. Acta Neurol (Napoli). 13(2):197–204 [PubMed] [Google Scholar]
- Willard-Mack CL. 2006. Normal structure, function, and histology of lymph nodes. Toxicol Pathol. 34(5):409–424 [DOI] [PubMed] [Google Scholar]
- Zhang ZX, Young K, Zhang L. 2001. CD3+CD4-CD8- alpha beta-TCR+ T cell as immune regulatory cell. J Mol Med. 79:419–427 [DOI] [PubMed] [Google Scholar]
Associated Data
This section collects any data citations, data availability statements, or supplementary materials included in this article.


