Abstract
We made a qualitative and quantitative comparison between a state-of-the-art implementation of micro-Computed Tomography (microCT) and the scanning Thin-Sheet Laser Imaging Microscopy (sTSLIM) method, applied to mouse cochleae. Both imaging methods are non-destructive and perform optical sectioning, respectively, with X-rays and laser light. MicroCT can be used on fresh or fixed tissue samples and is primarily designed to image bone rather than soft tissues. It requires complex back-projection algorithms to produce a two-dimensional image, and it is an expensive instrument. sTSLIM requires that a specimen be chemically fixed, decalcified, and cleared; but it produces high-resolution images of soft and bony tissues with minimum image postprocessing and is less expensive than microCT. In this article, we discuss the merits and disadvantages of each method individually and when combined.
Keywords: scanning thin-sheet laser imaging microscopy, light-sheet fluorescence microscopy, orthogonal-plane fluorescence optical sectioning microscopy, micro-computed tomography, mouse cochlea
Classical microscopy approaches have delivered much insight into the structure and function of biological and biomedical samples through two-dimensional (2D) imaging. However, to fully grasp the topography and morphology of a system’s architecture, three-dimensional (3D) imaging is currently preferred. Furthermore, the internal biological structure is of interest as well, leading to tomographic (Greek: tomos = part or slice, graphein = to write, so “imaging by sections or sectioning”) techniques. In this article, we study and compare two techniques that fulfill the current requirements of 3D tomographic imaging.
When considering X-rays as (invisible) light particles, the two methods discussed here are both non-destructive, optical-sectioning techniques. Micro-Computed Tomography (microCT) is an established technique (Masschaele et al. 2007; Welkenhuyzen et al. 2010; Salih et al. 2012), using the sample material’s absorption of X-rays to create shadow images. These shadow images are then recalculated to cross-sectional images through back-projection algorithms (Dierick et al. 2004). Another method to obtain virtual cross-sections is scanning Thin-Sheet Laser Imaging Microscopy (sTSLIM; Santi et al. 2009). It is one of the newest implementations of a larger field of imaging methods called Light-Sheet Fluorescence Microscopy (LSFM; Santi 2011; Buytaert et al. 2012), which originally started with Orthogonal-Plane Fluorescence Optical Sectioning (OPFOS) microscopy (Voie et al 1993; Voie 2002). With these methods, a sheet of light is formed by either focusing laser light through a cylindrical lens or by scanning a focused line of laser light in a plane perpendicular to the axis of the objective. When specimens are made transparent and fluorescent, optical sections can then be recorded orthogonally to the plane of the light-sheet with minimal photobleaching of the fluorophore.
Using custom-made, high-resolution microCT and LSFM implementations, we respectively imaged the left and right side of cochleae from a mouse. In this article, the virtual sections from each dataset are analyzed, compared, and discussed in 2D and 3D, and we built a multicomponent volume model with dedicated segmentation and triangulation software.
Materials and Methods
Mouse Cochlea
All animal care and use for this research was performed in accordance with American and Belgian animal care legislation, and the directives set by the ethical committees on animal experimentation of both institutions (University of Minnesota IACUC–Minnesota and University of Antwerp–Belgium). A 5-week-old adult CBA/JCr mouse was used and housed in a plastic bottom cage with food and water ad libitum in a dedicated animal facility. The animal was euthanized with ketamine/xylazine, followed by a cardiac perfusion with saline and then with 4% paraformaldehyde. The mouse was then decapitated and the temporal bones removed. Each temporal bone was opened to reach and isolate the fluid-filled bony labyrinth that is the inner ear, consisting of the spiral-shaped hearing organ (cochlea) and the vestibular system (semicircular canals, utricle, and saccule). Care was taken to preserve the middle ear stapes (stirrup hearing bone) footplate in the oval window of the cochlea, thus preserving the inner ear cavities and fluids. Hence the full stapes and incus (anvil hearing bone) were left in place.
sTSLIM requires further non-destructive—though invasive—specimen preparation, so normally one would first do a microCT scan on a freshly dissected specimen, followed by the necessary sTSLIM specimen preparation and recording. However, as the specimen preparation is susceptible to failure, we thought it best to first perform the sTSLIM imaging (in Minnesota); and when a successful measurement was completed on the left ear, to ship the corresponding right ear to Antwerp, Belgium, for microCT scanning.
MicroCT
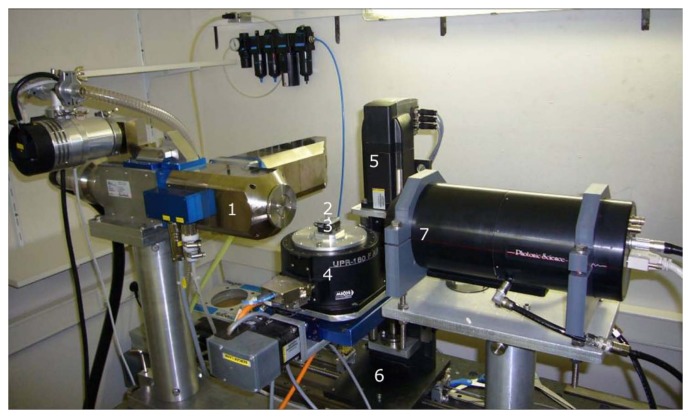
A custom-built, transmission X-ray microCT scanner of medium energy (up to 160 keV) was used (Fig. 1), which can achieve a feature recognition of 2 µm on very small samples (as specified by the X-ray tube manufacturer; Masschaele et al. 2007). The mouse sample was measured in phosphate buffered saline (PBS) in Eppendorf vials, which are transparent for X-rays. The scan was performed at a tube voltage of 100 kV (photon energy levels ranging from 0 to 100 keV) and a current of 30 µA. A custom-made vial holder was mounted on a computer-controlled, air-bearing rotation table (Micos USA, UPR160F-AIR, Irvine, CA). The setup achieves high resolution because of the stability obtained with this air-bearing rotation stage and because of the powerful X-ray source with small spot size. 1800 (XY) shadow images of 1848 × 2028 pixels were recorded covering 360° around the Y-axis (or thus one image every 0.2°), within about a 2-hr measuring time controlled by LabVIEW (National Instruments, Austin, TX). Next, back-projection calculations with the Octopus software package delivered 1732 (XZ) reconstructed cross-sectional images of 1848 × 1848 pixels (Dierick et al. 2004).
Figure 1.
MicroCT setup at UGCT Ghent, Belgium. (1) Transmission X-ray tube (source). (2) Position of the sample. (3) Piezo-translation stages in X and Z. (4) Air-bearing rotation stage. (5) Translation stage in Y. (6) Translation stage in Z (magnification). (7) X-ray detector.
sTSLIM
All light-sheet, optical-sectioning methods require the laser light to pass through the sample unscattered and unrefracted. Therefore, samples need to possess either a natural transparency (as with some larvae or fish embryos) or an induced transparency by specimen preparation. Because the cochlea is opaque and surrounded by bone, we made it translucent as follows: cochleae were removed and fixed as described in previous paragraphs and decalcified in a 10% deionized water solution of disodium ethylenediaminetetraacetic acid (EDTA), which slowly removes calcium atoms from the sample through chelation. Decalcification is complete for the mouse cochlea in three days. For larger specimens, low-power microwave exposure (without heating) is needed to drastically accelerate the decalcification process from several days to a month (Tinling et al. 2004). The cochlea was then rinsed with PBS and dehydrated by immersion in a graded ethanol series (50%, 75%, 100% and 100% each for 24 hr) to remove all water from the sample. Because sTSLIM is a fluorescent method, tissues can be imaged either by auto-fluorescence from lipofuscins, elastin, and/or collagen (Dodt et al. 2007); or by staining by immersion in Rhodamine B isothiocyanate in 100% ethanol (Voie 2003), which was the method we used. To avoid light scatter in the tissue and achieve deep-penetration imaging of macroscopic and opaque samples, clearing is needed. The clearing solution mimics the refraction index of protein and matches the refraction index of the sample to the solution. It consists of a 5:3 mixture solution of methyl salicylate and benzyl benzoate, called Spalteholz fluid (Spalteholz 1911; Voie et al. 1993; Buytaert and Dirckx 2007). The specimen was directly (not gradually) immersed from 100% ethanol into 100% Spalteholz clearing solution (Dodt et al. 2007; Santi 2011).
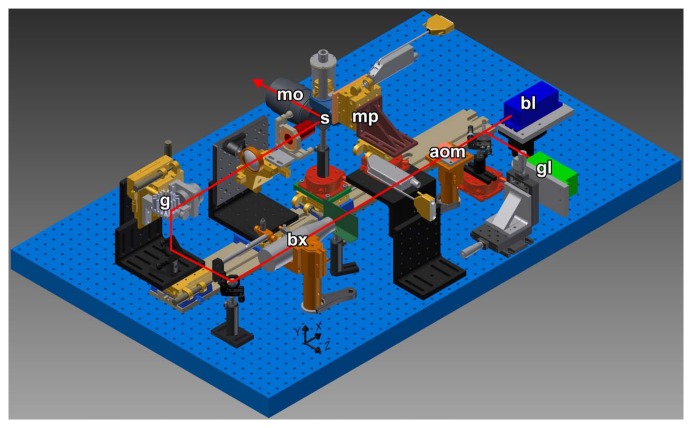
The cochlea was attached to a specimen rod with epoxy glue and suspended in a Spalteholz fluid-filled chamber in sTSLIM (Fig. 2). The light-sheet is produced by either a blue or green laser by Y-scanning using a galvanometer mirror and is similar to the scanning light-sheet device described by Keller et al. (2008). This method produces 2D images that have greatly reduced absorption artifacts that are common in static light-sheet designs and confocal microscopy. In order to produce a well-focused 2D image across the full width of an XY optical section of the specimen, we used an X-scanning procedure first described by Buytaert and Dirckx (2007). In addition, the laser light can be modulated for structured illumination or Keller HiLo background rejection (Mertz and Kim 2011) in sTSLIM, but these enhancements were not used to image these cochleae. Acquisition and image processing software was written in LabVIEW (National Instruments, Austin, TX).
Figure 2.
sTSLIM CAD diagram with light path shown. A blue (bl) or green (gl) laser travels through an acoustic optic modulator (aom) and is expanded using a beam expander (bx). Scanning of the beam is provided by the galvo mirror (g) and the specimen (s) moves through the scanned light-sheet in the X- and Z-directions via micropositioners (mp) to produce well-focused specimens across their width and a Z-stack of images, respectively, which are recorded through an objective of an Olympus microscope (mo) and a QImaging Retiga digital camera (not shown).
Postprocessing
After recording the data by either method, we identified and segmented the relevant structures in all images. The goal of segmentation is to locate and outline (sub)structure boundaries, which in turn allows the software to build 3D surface meshes by triangulation. A mesh is a network of triangular faces constituting a surface. Using the commercial image segmentation and 3D surface mesh generating software package Amira 5.3 (Visage Imaging, Richmond, VIC, Australia), we performed semiautomated segmentation of the microCT dataset based on thresholding of gray scale values. Next, the Amira software package used a marching cubes algorithm for triangulation. Because sTSLIM images contain similar grey values across different structures, segmentation was primarily done manually using a graphics tablet and Amira again. Hence, the operator is required to have good anatomical knowledge, and structure outlines are smoother. As a final result, we end up with triangulated surface meshes for the microCT and TSLIM datasets.
Results
MicroCT, Two-dimensional (2D)
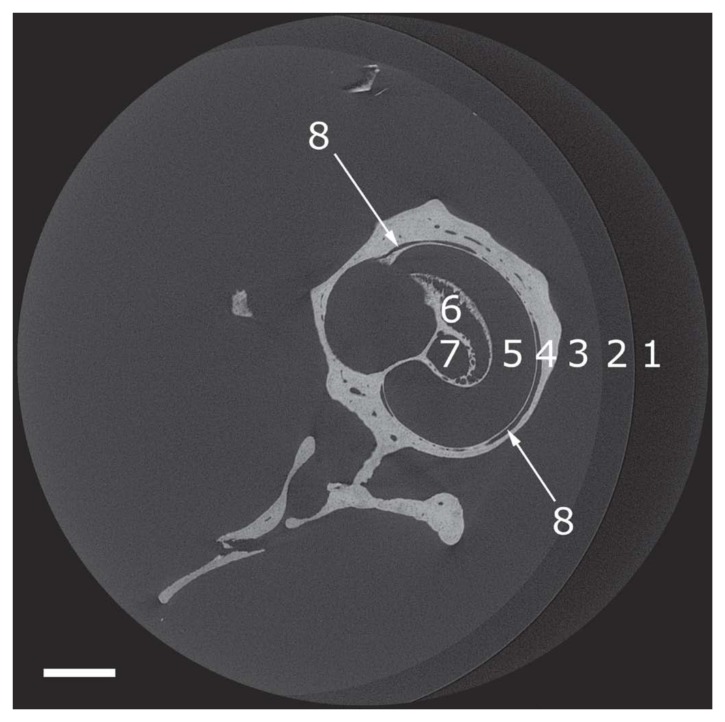
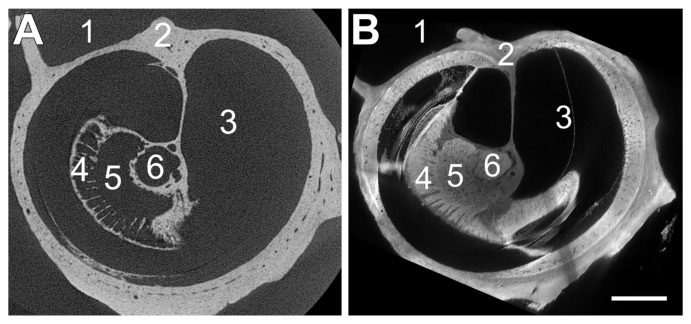
An example of a 2D cross-sectional image of microCT is shown (Fig. 3). A microCT dataset was recorded containing the entire right mouse inner ear (cochlea + vestibular organ) in the imaging volume. The cochlea was imaged a second time at a higher magnification for a region of interest (Fig. 4A). The microCT device sectioned the cochlea in a plane perpendicular to the axis of the modiolus (i.e., transverse or horizontal sections).
Figure 3.
Reconstructed microCT transverse cross-sections of 1848 × 1848 pixels through the mouse right ear. The microCT sections are orthogonal to the modiolus. (1) Air. (2) Vial. (3) Phosphate buffered saline. (4) Cochlea bone. (5) Cochlea scala. (6) Rosenthal’s canal. (7) Modiolus. (8) Blood vessel. Bar = 500 µm.
Figure 4.
Comparison of microCT (A) and sTSLIM (B) on the mouse right ear. Both sections are orthogonal to the modiolus. (Left) A reconstructed microCT transverse cross-section through a mouse cochlea. Unprecedented detailed (bony) features can be distinguished inside the cochlea. (Right) sTSLIM cross-section virtually resectioned from midmodiolar to approximately match with the microCT sectioning plane. Note the presence of the bone that is in both sections and the addition of imaging the soft tissue in this plane. (1) Middle ear space. (2) Otic capsule. (3) Cochlea scala. (4) Habenula perforate. (5) Rosenthal’s canal. (6) Modiolus. Bar = 300 µm.
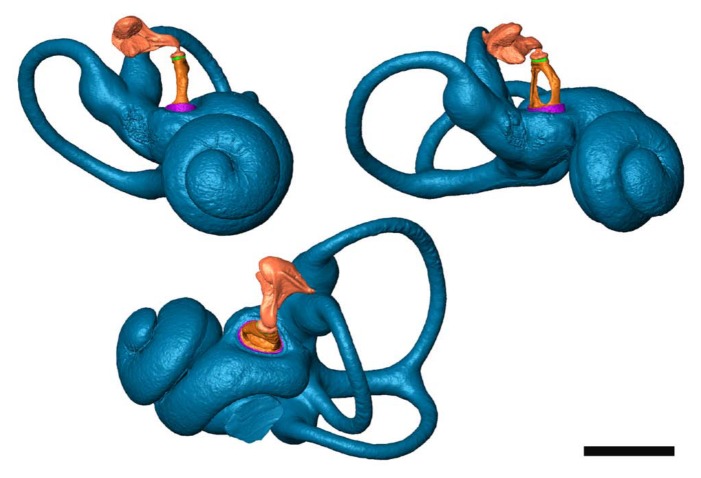
At first glance, the field of view seems to be too wide in Figure 3, and a higher magnification would be more advantageous. We, however, used this magnification to keep the cochlea, stapes and incus, and vestibular apparatus inside the imaging volume in all cross-sectional images at all depths, allowing us to create a complete 3D model of the inner ear (Fig. 9). Although the pixel and voxel size in Fig. 3 is already quite small, namely 2.64 µm, a microCT scan with higher magnification of the cochlea alone was made as well, shown in Figure 4A, with a pixel size of 1.50 µm.
Figure 9.
Three views of the same 3D inner and middle ear model that was made from the microCT dataset presented in Figs 3 and 4a (mouse, right ear). The fluid-filled cavities of the inner ear are shown (blue). The stapes (orange) and incus (pink) are visualized as well, with the soft tissue annular ligament (purple) and incudostapedial ligament (green). Inside the modiolus, Rosenthal’s canal and osseous spiral lamina are segmented and modeled as well. Notice the detailed surface texture, obtained by thresholding (instead of manual outlining). Bar = 1000 µm.
sTSLIM, Two-dimensional (2D)
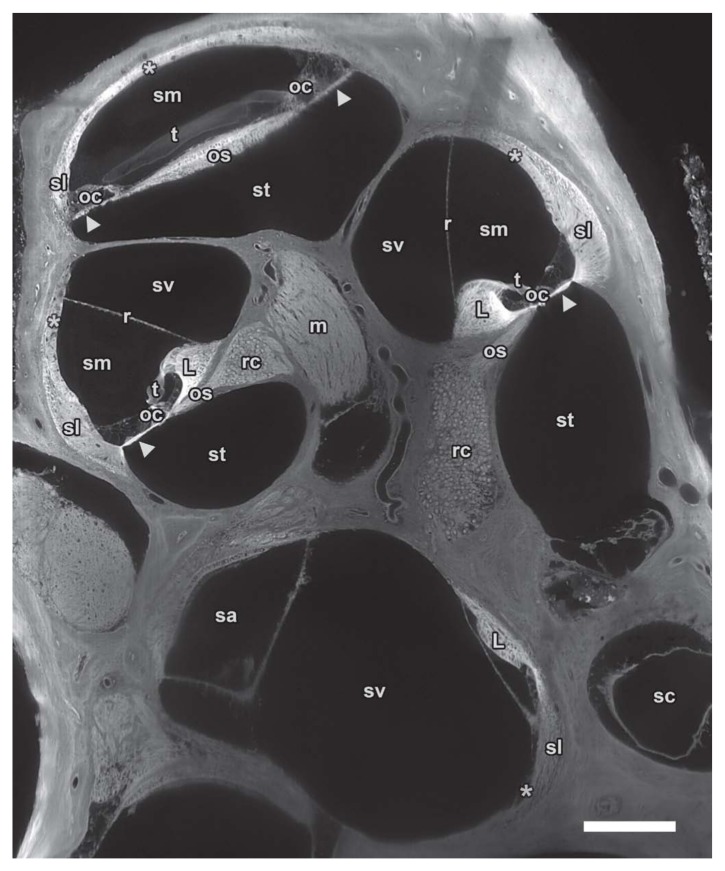
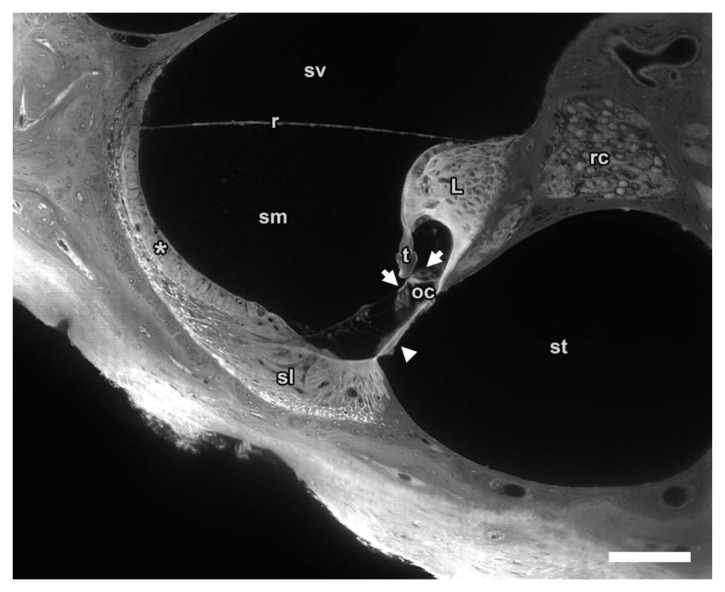
An example of a 2D cross-sectional image of sTSLIM is shown in Figure 4B. An sTSLIM dataset was recorded for each mouse cochlea (without the vestibular apparatus) in the midmodiolar plane, which is parallel to the axis of the cochlea. However, Amira can virtually resection the cochlea in a horizontal plane to match the microCT sections as shown in Figure 4B. Figure 5 shows an original low magnification midmodiolar cross-section through the whole mouse cochlea as imaged by sTSLIM, with pixel size 1.5 µm. Soft tissue structures are labeled. A higher magnification of one turn of the scalae was imaged a second time (Fig. 6) to show the subnuclear-resolution capacity of sTSLIM for the soft tissue structures within the cochlea, with a pixel size of 0.59 µm. The hair cells and other cells of the scala media are clearly resolved.
Figure 5.
Midmodiolar sTSLIM cross-section of 1600 × 1200 pixels from an image stack through the entire mouse left cochlea showing fluid chambers such as scala vestibuli (sv), media (sm) and tympani (st) as well as the membranous structures that separate the scalae: basilar (arrowhead) and Reissner’s membrane (r). Other soft tissue structures are clearly visible such as spiral ligament (sl), stria vascularis (asterisk), organ of Corti (oc), tectorial membrane (t) and spiral limbus (L). Nerve tissues are also well defined in Rosenthal’s canal (rc) and the modiolus (m). Vestibular spaces such as saccule (sa) and semicircular canal (sc) can also be distinguished from neighboring structures. Bar = 200 µm.
Figure 6.
High magnification sTSLIM of the mouse left cochlea cross-section showing sharp borders and detail in various structures such as scala vestibuli (sv), media (sm) and tympani (st); basilar (arrowhead), tectorial (t) and Reissner’s membrane (r); as well as stria vascularis (asterisk), spiral ligament (sl), organ of Corti (oc) with hair cells (arrows), spiral limbus (L) and Rosenthal’s canal (rc). Bar = 100 µm.
Segmentation
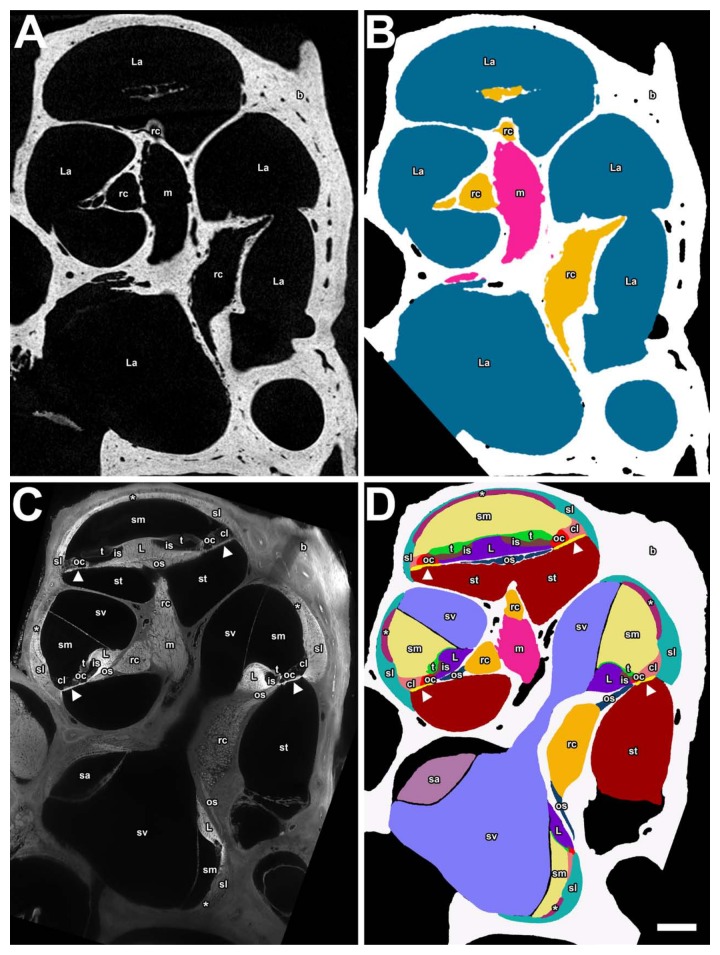
Segmentation and triangulation with Amira produced 3D surface meshes, containing 3D morphological information. Figure 7A shows a transformed midmodiolar cross-section from microCT with its segmentation labeled in Figure 7B. Because soft tissues are not present, it was not possible to individually segment the scala vestibuli, media, and tympani. However, it was possible to use (auto)segmentation in Amira to fill in the empty spaces presumably occupied by fluid or soft tissue. In this way, segmentation was done for the fluid and soft tissue–filled cochlea scalae and vestibular labyrinth: the modiolus nerve, and Rosenthal’s canal together with the osseous spiral lamina are mostly enclosed in bone, so it was possible to segment these structures from microCT. Even the ligament clefts of the incudostapedial joint and annular ligament could be modeled, so eight structures have been segmented.
Figure 7.
Panels A and B are from the microCT data showing a transformed midmodiolar section in A and a segmented label field in B for the mouse right ear. Panels C and D are a midmodiolar sTSLIM sections in C and a segmented label field in D of the mouse left inner ear (flipped). The following structures are color-coded and labeled: scala media (sm), scala tympani (st), scala vestibuli (sv), Reissner’s membrane (r), stria vascularis (asterisk), spiral ligament (sl), Claudius cells (cl), organ of Corti (oc), tectorial membrane (t), spiral limbus (L), basilar membrane (arrowhead), modiolus (m), and saccule (sa) as well as osseous spiral lamina (os) and Rosenthal’s canal (rc), which are combined in panel B. Bar = 200 µm.
In the case of sTSLIM, Figure 7C shows a midmodiolar cross-section that allowed us to segment out 16 structures in Figure 7D, due to (visual) recognition of their distinct anatomical boundaries.
3D Volume Rendering
Figure 8 is a 3-panel figure that shows part of a volume rendering of the scala media from microCT, sTSLIM, and a combination of microCT and sTSLIM. In the case of microCT, the bony channel is present but lacks soft tissue. The boundaries between the scalae can only be estimated from the location of the basilar membrane between the bony protuberance of the lateral wall and the lip of the osseous spiral lamina (Fig. 8A). Therefore, the three scalae in the cochlea are merged into one volume and model component. Extremely fine bony detail on the scala wall, however, is resolved. sTSLIM sections reveal all of the soft tissues and the bony labyrinth (Fig. 8B). A combination of microCT and (upscaled) sTSLIM images shows a good match for the bone. The soft tissue is in grey from sTSLIM, and the bony labyrinth as revealed by microCT is in red in Figure 8C.
Figure 8.
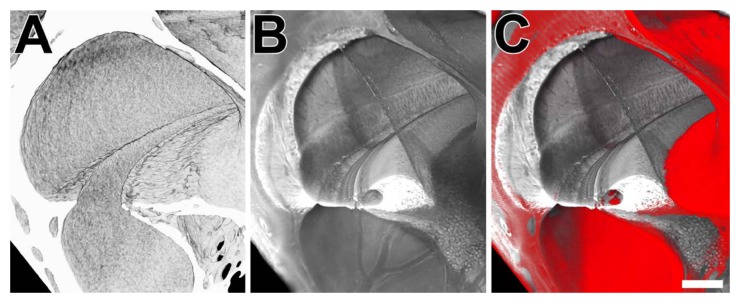
Panel A is a microCT volume rendering of the scalae (mouse, right side). Panel B is an sTSLIM volume rendering of the scalae (mouse, left side; flipped) showing the soft tissue. Panel C is a combination of both volume renderings showing the microCT rendering in pseudo-color red and the sTSLIM rendering in grey. Bar = 100 µm.
After segmentation, a 3D volume rendering of the inner ear can be constructed (Figs. 9, 10, 11). Figure 9 shows views of the 3D model made from microCT data, including the vestibular organ. The bone itself of the inner ear is not shown, but the fluid and soft tissue–filled volume constituting the inner cavities of the bony and membranous labyrinth is in blue. Two ossicles of the middle ear are visualized as well. Eight structures in total have been segmented and color-coded (similar in Figs. 7B, 9, 10).
Figure 10.
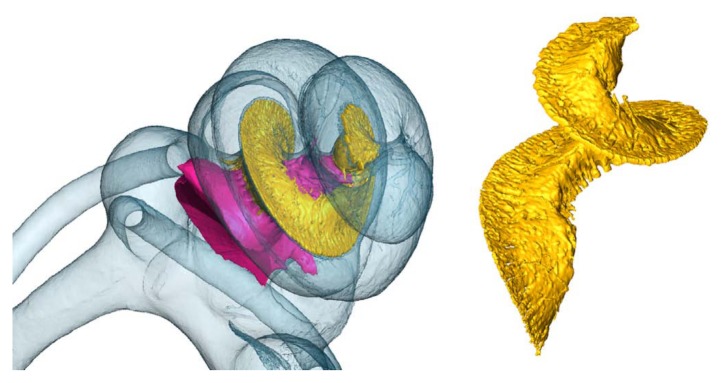
Inside the cochlea (mouse, right), the modiolus (pink), and Rosenthal’s canal and osseous spiral lamina (yellow) are segmented and modeled from microCT data as well.
Figure 11.
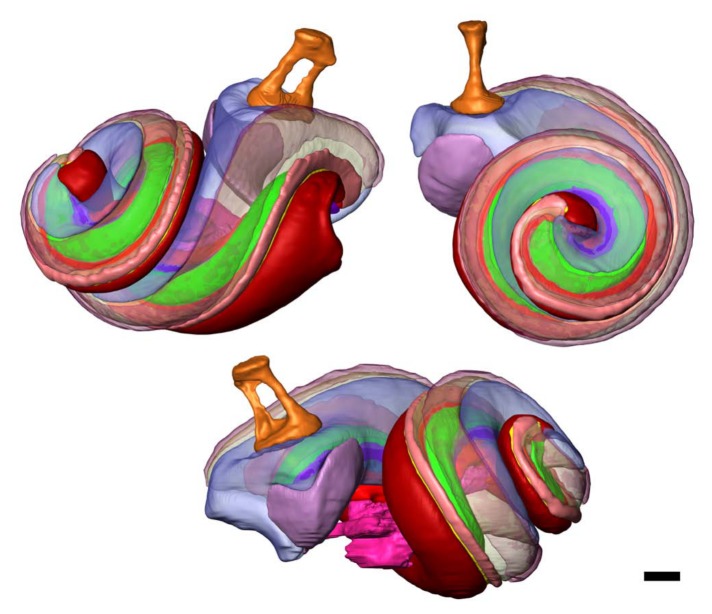
Three views of the same 3D inner ear model that was made from the sTSLIM dataset presented in Figs. 5, 7C, 7D (mouse, left). Cochlear structures are shown in the same colors as those labeled in Fig. 7D. The stapes (orange) and saccule (purple) are visualized as well. Bar = 200 µm.
Some structures have been made translucent in Figures 10 and 11 so that internal structures can be seen. Figure 11 shows a similar 3D reconstruction of the cochlea after sTSLIM sectioning and segmentation of the cochlear structures. Sixteen structures have been segmented and color-coded (the same coding as in the microCT data) in Figure 11 (and Figure 7D).
Volumes of the structures were determined by Amira from the color-coded segmented labeled fields (Table 1). As explained in the discussion, sTSLIM requires an upscaling of (4.23%)3 to be comparable to microCT as a reference (cf. Table 2). However, note that even the microCT data have presumably shrunk by fixation.
Table 1.
Estimated Volume of Each Structure from Raw sTSLIM Data for Mouse Left Inner Ear
| Method | Structure | Volume (µl) | |
|---|---|---|---|
| sTSLIM | 1 | Scala vestibuli | 0.456 |
| sTSLIM | 2 | Scala tympani | 0.370 |
| sTSLIM | 3 | Scala media | 0.315 |
| sTSLIM | 4 | Spiral ligament | 0.193 |
| sTSLIM | 5 | Modiolus | 0.052 |
| sTSLIM | 6 | Spiral limbus | 0.051 |
| sTSLIM | 7 | Saccule | 0.048 |
| sTSLIM | 8 | Stria vascularis | 0.041 |
| sTSLIM | 9 | Rosenthal’s canal | 0.043 |
| sTSLIM | 10 | Claudius cells | 0.030 |
| sTSLIM | 11 | Stapes | 0.014 |
| sTSLIM | 12 | Tectorial membrane | 0.014 |
| sTSLIM | 13 | Organ of Corti | 0.013 |
| sTSLIM | 14 | Osseous spiral lamina | 0.013 |
| sTSLIM | 15 | Inner sulcus | 0.008 |
| sTSLIM | 16 | Basilar membrane | 0.007 |
| sTSLIM | 17 | Fluid and soft tissue–filled cochleaa | 1.697 |
| sTSLIM | 18 | Rosenthal’s canal + osseous spiral lamina | 0.049 |
The inner volume of the cochlear cavities: so the scalae and the soft tissue structures inside the cochlear bone, but without the nerves, and without the vestibular system cavities.
Table 2.
Estimated Volume of Each Structure from sTSLIM (with upscaling correction to microCT) for Mouse Left Inner Ear and microct Cross-sections (without correction for shrinkage caused by fixation) for Mouse Right Ear
| Method | Structure | Volume (µl) | |
|---|---|---|---|
| sTSLIM | 1 | Scala vestibuli | 0.517 |
| sTSLIM | 2 | Scala tympani | 0.419 |
| sTSLIM | 3 | Scala media | 0.358 |
| sTSLIM | 4 | Spiral ligament | 0.219 |
| sTSLIM | 5 | Modiolus | 0.059 |
| sTSLIM | 6 | Spiral limbus | 0.057 |
| sTSLIM | 7 | Saccule | 0.048 |
| sTSLIM | 8 | Stria vascularis | 0.046 |
| sTSLIM | 9 | Rosenthal’s canal | 0.043 |
| sTSLIM | 10 | Claudius cells | 0.034 |
| sTSLIM | 11 | Stapes | 0.014 |
| sTSLIM | 12 | Tectorial membrane | 0.015 |
| sTSLIM | 13 | Organ of Corti | 0.015 |
| sTSLIM | 14 | Osseous spiral lamina | 0.013 |
| sTSLIM | 15 | Inner sulcus | 0.009 |
| sTSLIM | 16 | Basilar membrane | 0.008 |
| sTSLIM | 17 | Fluid and soft tissue–filled cochleaa | 1.697 |
| sTSLIM | 18 | Rosenthal’s canal + osseous spiral lamina | 0.056 |
| microCT | 1 | Fluid and soft tissue–filled cochleaa | 1.702 |
| microCT | 2 | Rosenthal’s canal + osseous spiral lamina | 0.072 |
| microCT | 3 | Stapes | 0.011 |
| microCT | 4 | Incus | 0.046 |
The inner volume of the cochlear cavities: so the scalae and the soft tissue structures inside the cochlear bone, but without the nerves, and without the vestibular system cavities.
Discussion
Resolution
The custom-built microCT setup used in this article is able to measure objects with sizes ranging from 300 µm to 30 cm (an order of magnitude 102). The maximal dimension of a mouse inner ear is about 4 millimeters. A pixel (and voxel) size of 2.64 µm, and 4 µm resolution was achieved on the entire inner ear, which is indeed an advanced achievement for microCT. When focusing only on the mouse cochlea, a pixel size of 1.50 µm, and resolution of 3 µm was in effect. The result, however, contains only data on bony tissue, with the exception of soft tissue clefts, in which the soft tissue can be assumed. MicroCT data has isometric (pixel and) voxel sizes.
sTSLIM beam scan width (Y dimension) is 15 mm and it has a thickness of 5 µm (Z dimension). This generates a voxel size of 1.5 × 1.5 × 5 µm, with a resolution of 1.5 µm. A mouse cochlea can thus easily be imaged by sTSLIM, and subcellular resolution can be obtained when performing region-of-interest imaging. This method allows for segmentation of numerous soft tissue structures in the cochlea. Nucleoli can be observed and in some cases stereocilia bundles on hair cells as well (not shown). Voxel sizes in sTSLIM are, however, not isometric.
Both in sTSLIM and microCT, the resolution depends on the field of view, object size, and magnification: Smaller samples, smaller field of view (region-of-interest), and higher magnification offer a better resolution.
Soft Tissue
It is clear that X-ray computed tomography is in essence unsuited to imaging soft tissue, as this tissue type is almost transparent for X-rays. Bony tissue, like cartilage and bone, do absorb (many more) X-rays, leaving a shadow on the recordings that can be used for back-projection calculations. Thus, the resulting cross-sections in Figures 3 and 4 contain no soft tissues. However, Figures 9 and 10 of the 3D microCT models do show soft tissue structures that were segmented and triangulated, namely the stapedial annular ligament, the incudo-stapedial ligament, the modiolus, and Rosenthal’s canal together with osseous spiral lamina. We obtained these soft tissue structures by segmenting the gaps or joint clefts in the bone.
A promising new method to achieve soft tissue imaging with microCT is by phosphotungstic acid (PTA) staining for better absorption contrast (Metscher 2009a, 2009b). This method was considered but not chosen for our samples, as it would cause three inherent problems. After staining, soft tissue (e.g., the membranes inside the cochlea or modiolus) will absorb almost as many X-rays as bone, thus obscuring the boundary/separation between bone and soft tissue. (Even manual) segmentation thus becomes almost impossible. Functional staining is not an option here. Segmentation will thus become rather difficult. Furthermore, the cochlea consists of fluid-filled canals, namely with perilymph and endolymph. When a several-day staining procedure is performed in stained PBS, followed by rinsing with unstained PBS, the outside PBS fluid will contain no PTA, whereas the enclosed endolymph and perilymph fluid will still contain PTA as it cannot be rinsed out of the tissue. The very thin membranes inside the cochlea—Reissner’s and the basilar membrane—will then offer low contrast compared to the PTA fluid in the surrounding scalae. Furthermore, from previous experience, it was clear that this PTA staining works well on dense samples, such as human ears, though with less success when it is dissected into smaller sections. For all these reasons, (the rather tiny) mouse cochleae were not stained with PTA.
sTSLIM delivered extremely detailed histological cross-sections on bone and soft tissue both (Figs. 4B, 5, 6, and 7). It is possible to distinguish no fewer than 20 different structures in the cochlea, 16 of which are shown in this article. sTSLIM’s resolution is subnuclear. The only technique that could do better in detail and resolution would be the classical histological sectioning technique—however, only with respect to 2D cross-sections. When creating a full 3D data stack of 2D histology sections, apart from (homogeneous) shrinkage, the method strongly suffers from distortion and registration artifacts created by the destructive cutting. This causes the resulting 3D models to be inferior to sTSLIM (OPFOS) models (Descamps et al. 2012), where registration is automatically obtained/maintained and sectioning occurs optically/virtually. Because in our measurements all tissue was stained with one dye—so no functional staining—separating different soft tissue is difficult. The tissues have similar gray values, thus manual outlining is necessary, leading to smooth models (cf. Fig. 11) in contrast to the microCT models with original surface texture from automatic threshold segmentation (cf. Figs. 9 and 10).
Shrinkage
It is important to realize that the required fixation, decalcification, clearing, and especially dehydration unavoidably lead to shrinkage in the resulting sTSLIM and other LSFM data (Voie, 2002; Valk et al. 2005; Hofman et al. 2009; Buytaert et al. 2011). The described specimen preparation procedure—except for the clearing—closely resembles the specimen preparation of the established (destructive) histological sectioning technique. In histology, this (in approximation homogeneous) shrinking occurs just as much, and up to 3% for dense bone (Lane and Ráliš 1983; Henson et al. 1994). Dehydration of soft tissue causes even more (>11%) shrinkage (Rown et al. 2002). For OPFOS—another LSFM implementation—Buytaert et al. reported 8.4% for thin decalcified bone and soft tissue combined (Buytaert et al. 2011).
Samples measured in a microCT setup normally require no specimen preparation. The resulting models thus deliver high-resolution and true-to-life information on the 3D dimension, anatomy, and morphology of bone. Furthermore, it offers an accurate frame of reference for the sTSLIM model and data. By warping/aligning—a process of digitally manipulating data such that portrayed shapes are distorted by rigid coordinate transformations and/or (uniform or affine) scaling—the sTSLIM model to the microCT model, the sTSLIM data is improved: It now not only contains detailed data on the anatomical, morphological, and histological configuration of the soft tissue but also offers correct dimensional information. Figure 9 shows the result of an automatic warping/aligning of both datasets in 3D. Apart from rotation and translation, we allowed for affine up- or downscaling, which gives shrinkage information on all dimensions independently. As upscaling was required by 3.35% in X, 4.25% in Y, and 4.58% in Z to match the models, we conclude that the specimens were indeed shrunk during specimen preparation in obtaining TSLIM data about 95.77% in each dimension. Note that this can mean a (95.8%)3 = 88% reduction in 3D volume.
These percentages—on average 4.23%—seemed small at first when compared, for instance, to 8.4% that was reported by Buytaert et al., 2011. However, Buytaert et al. 2011 compared shrinkage with microCT data obtained on fresh samples, whereas our comparison was made with microCT data from paraformaldehyde-fixed samples. This was necessary because of the intercontinental shipping and international nature of this collaboration. Paraformaldehyde is known to account for between 2.9% and 4.5% shrinkage, (Hopwood, 1967; Fox et al. 1985; Jonmarker et al. 2006), leading again to a (maximal) difference up to 8.5% for sTSLIM data compared with fresh samples.
As we now have the 3D surface models of both microCT and sTSLIM, it is quite easy to measure and compare morphological dimensions and volumes. For instance, the volume of all inner ear cavities according to microCT is 1.702 mm3 (without the nerve tissue or semicircular canals and without shrinkage correction). The volume of all cochlear spiral cavities according to sTSLIM is 1.697 mm3 (without the nerve tissue, with shrinkage correction of 4.23%). The long axis of the oval window spans 470 µm wide and the short axis is 414 µm wide according to microCT. From the upscaled/calibrated sTSLIM models, the long axis gives 509 µm and the short axis is 372 µm wide (with shrinkage correction of 4.23%). The thickness/width of the stapedial annular ligament (cleft) is 16 µm on average, according to microCT. The thickness of the basilar membrane varies from 5 to 20 µm as reported by sTSLIM data (with shrinkage correction of 4.23%). However, it is important to remember that the microCT values here are obtained from samples that have presumably shrunk through fixation.
The values listed in Tables 1 and 2 are obtained from the 3D geometrical surface and volume meshes/models that were obtained from the high-resolution sTSLIM and microCT techniques. Thus, distance, shape, and volume properties are now known for several inner ear structures of mice—the latter with 1 nl precision. It is important to note the good correspondence between the two methods of the volume of the (fluid and soft tissue–filled) cochlear channels, in Table 2: sTSLIM offers 1.697 µl, whereas microCT delivers 1.702 µl. The cochlear channels incorporate and are defined here as the scalae volume and also the volume occupied by soft tissue like the spiral limbus, spiral ligament, membranes, organ of Corti, etc. Note that the microCT is compared with the upscaled sTSLIM data to account for its extra shrinkage caused by dehydration and decalcification. Another volume to compare between both methods is the one from the combined structure made up by Rosenthal’s canal and osseous spiral lamina: sTSLIM is 0.056 µl, wherease microCT is 0.072 µl. This difference is attributed to the fact that sTSLIM measures the actual soft tissue, which allows for specific segmentation of these structures, whereas microCT measures only its cleft/gap in the bone. MicroCT thus might overestimate the volume by incorporating blood vessels, fluid, and other soft tissue present in these gaps.
Conclusion
In summary, sTSLIM requires an extensive specimen preparation, but achieves high resolution and contrast. Furthermore, it is capable of imaging both soft tissue and bone in semi–real time. Moreover, assembling an sTSLIM setup is cheaper by a factor of about 4 than purchasing a microCT. MicroCT, on the other hand, can be performed on fresh or fixed samples; however, it images mainly bone and needs extensive calculations before 2D cross-sections can be observed. It can also handle larger samples than sTSLIM, and it offers isometric resolution in all three dimensions.
To answer which technique is preferred depends entirely on the desired information one wants to obtain—either solely on bone or on both bony and soft tissue. In case of the latter, it is clear that it is advantageous to combine both methods: microCT (on preferably fresh samples) can act as an accurate calibration reference for the upscaling of the sTSLIM data, which suffer from (mostly homogeneous) shrinkage between 6.2% and 8.5%. Thus, (state-of-the-art) microCT will lead to correct(ed) dimensional sTSLIM (and other LSFM or OPFOS) data. It is, however, clear that sTSLIM offers detailed data simillar to that found with histological sectioning.
Apart from a detailed and balanced comparison, the presented numerical data and shrinkage information gives a quantitative, but preliminary, indication of an important difference between the two methods regarding tissue shrinkage. However, this needs to be investigated further on fresh, non-fixated tissue.
Acknowledgments
We thank Pieter Vanderniepen for his technical assistance.
Footnotes
Declaration of Conflicting Interests: The authors declared no potential conflicts of interest with respect to the research, authorship, and/or publication of this article.
Funding: The authors disclosed receipt of the following financial support for the research, authorship, and/or publication of this article: Funding was provided to Jan Buytaert by the Research Foundation–Flanders and the VOCATIO foundation. Funding was provided to Peter Santi by the NIDCD (RO1DC007588-04), and ARRA supplement (RO1DC007588-03S1), the Capita Foundation, and the Lions Hearing Foundation.
References
- Buytaert JAN, Descamps E, Adriaens D, Dirckx JJJ. 2012. The OPFOS microscopy family: High-resolution optical sectioning of biomedical specimens. Anat Res Int. 2012:(Article ID 206238)1–9 doi: 10.1155/2012/206238 [DOI] [PMC free article] [PubMed] [Google Scholar]
- Buytaert JAN, Dirckx JJJ. 2007. Design and quantitative resolution measurements of an optical virtual sectioning three-dimensional imaging technique for biomedical specimens, featuring two-micrometer slicing resolution. J Biomed Opt. 12(1):014039 doi: 10.1117/1.2671712 [DOI] [PubMed] [Google Scholar]
- Buytaert JAN, Salih WHM, Dierick M, Jacobs P, Dirckx JJJ. 2011. Realistic 3D computer model of the gerbil middle ear, featuring accurate morphology of bone and soft tissue structures. J Assoc Res Otolaryngol. 12:681–696 doi: 10.1007/s10162-011-0281-4 [DOI] [PMC free article] [PubMed] [Google Scholar]
- Descamps E., Buytaert J., De Kegel B., Dirckx J., Adriaens D. (2012). A qualitative comparison of 3D visualization in Xenopus laevis using a traditional method and a non-destructive method. Belgian J Zool. 142:99–111 [Google Scholar]
- Dierick M, Masschaele B, Hoorebeke LV. 2004. Octopus, a fast and user-friendly tomographic reconstruction package developed in LabView®. Meas Sci Tech. 15:1366–1370 Retrieved from http://iopscience.iop.org/0957-0233/15/7/020 [Google Scholar]
- Dodt H-U, Leischner U, Schierloh A, Jahrling N, Mauch CP, Deininger K, Deussing JM, Eder M, Zieglgänsberger W, Becker K. (2007). Ultramicroscopy: three-dimensional visualization of neuronal networks in the whole mouse brain. Nat Methods. 4:331–336 Retrieved from http://www.nature.com/nmeth/journal/v4/n4/abs/nmeth1036.html [DOI] [PubMed] [Google Scholar]
- Fox CH, Johnson FB, Whiting J, Roller PP. 1985. Formaldehyde fixation. J Histochem Cytochem. 33:845–853 doi: 10.1177/33.8.3894502 [DOI] [PubMed] [Google Scholar]
- Henson MM, Henson OW, Gewalt SL, Wilson JL, Johnson GA. 1994. Imaging the cochlea by magnetic resonance microscopy. Hear Res. 75:75–80 doi: 10.1016/0378-5955(94)90058-2 [DOI] [PubMed] [Google Scholar]
- Hofman R, Segenhout JM, Wit HP. 2009. Three-dimensional reconstruction of the guinea pig inner ear, comparison of OPFOS and light microscopy, applications of 3D reconstruction. J Microsc. 233:251–257 doi: 10.1111/j.1365-2818.2009.03115.x [DOI] [PubMed] [Google Scholar]
- Hopwood D. 1967. Some aspects of fixation with glutaraldehyde. J Anat. 101(Pt.1):83–92 [PMC free article] [PubMed] [Google Scholar]
- Jonmarker S, Valdman A, Lindberg A, Hellström M, Egevad L. 2006. Tissue shrinkage after fixation with formalin injection of prostatectomy specimens. Virchows Arch. 449:297–301 doi: 10.1007/s00428-006-0259-5 [DOI] [PubMed] [Google Scholar]
- Keller PJ, Schmidt AD, Wittbrodt J, Stelzer EHK. 2008. Reconstruction of zebrafish early embryonic development by scanned light sheet microscopy. Science. 322(5904):1065–1069 doi: 10.1126/science.1162493 [DOI] [PubMed] [Google Scholar]
- Lane J, Ráliš Z. 1983. Changes in dimensions of large cancellous bone specimens during histological preparation as measured on slabs from human femoral heads. Calcif Tissue Internat. 35:1–4 Retrieved from http://www.springerlink.com/index/7120147402051661.pdf [DOI] [PubMed] [Google Scholar]
- Masschaele BC, Cnudde V, Dierick M, Jacobs P, Van Hoorebeke L, Vlassenbroeck J, Vanhoorebeke L. 2007. UGCT: new X-ray radiography and tomography facility. Nucl Instruments and Methods in Phys Res Section A: Accelerators, Spectrometers, Detectors and Associated Equipment. 580:266–269 doi: 10.1016/j.nima.2007.05.099 [DOI] [Google Scholar]
- Mertz J, Kim J. 2011. Scanning light-sheet microscopy in the whole mouse brain with HiLo background rejection. J Biomed Opt. 15(1):016027 doi: 10.1117/1.3324890 [DOI] [PMC free article] [PubMed] [Google Scholar]
- Metscher BD. 2009a. MicroCT for developmental biology: a versatile tool for high-contrast 3D imaging at histological resolutions. Dev Dynamics. 238:632–640 doi: 10.1002/dvdy.21857 [DOI] [PubMed] [Google Scholar]
- Metscher BD. 2009b. MicroCT for comparative morphology: Simple staining methods allow high-contrast 3D imaging of diverse non-mineralized animal tissues. BMC Physiol. 9(11):1–14 doi: 10.1186/1472-6793-9-11 [DOI] [PMC free article] [PubMed] [Google Scholar]
- Rown MAB, Eed RBR, Enry RWH. 2002. Effects of dehydration mediums and temperature on total dehydration time and tissue shrinkage. J Internat Soc Plastination. 17:28–33 [Google Scholar]
- Salih WHM, Buytaert JAN, Aerts JRM, Vanderniepen P, Dierick M, Dirckx JJJ. 2012. Open access high-resolution 3D morphology models of cat, gerbil, rabbit, rat and human ossicular chains. Hear Res. 284:1–5 doi: 10.1016/j.heares.2011.12.004 [DOI] [PubMed] [Google Scholar]
- Santi PA. 2011. Light sheet fluorescence microscopy: a review. J Histochem Cytochem. 59:129–138 doi: 10.1369/0022155410394857 [DOI] [PMC free article] [PubMed] [Google Scholar]
- Santi PA, Johnson SB, Hillenbrand M, GrandPre PZ, Glass TJ, Leger JR. 2009. Thin-sheet laser imaging microscopy for optical sectioning of thick tissues. BioTechniques. 46:287–294 doi: 10.2144/000113087 [DOI] [PMC free article] [PubMed] [Google Scholar]
- Spalteholz W. 1911. Über das Durchsichtigmachen von menschlichen und tierischen Präparaten [On making transparent human and animal tissue samples] (p. 48). Leipzig, Germany: S. Hirzel [Google Scholar]
- Tinling SP, Giberson RT, Kullar RS. 2004. Microwave exposure increases bone demineralization rate independent of temperature. J Microsc. 215(Pt 3):230–235 doi: 10.1111/j.0022-2720.2004.01382.x [DOI] [PubMed] [Google Scholar]
- Valk WL, Wit HP, Segenhout JM, Dijk F, van der Want JJL, Albers FWJ. 2005. Morphology of the endolymphatic sac in the guinea pig after an acute endolymphatic hydrops. Hear Res. 202:180–187 doi: 10.1016/j.heares.2004.10.010 [DOI] [PubMed] [Google Scholar]
- Voie AH. 2002. Imaging the intact guinea pig tympanic bulla by orthogonal-plane fluorescence optical sectioning microscopy. Hear Res. 171:119–128 doi: 10.1016/S0378-5955(02)00493-8 [DOI] [PubMed] [Google Scholar]
- Voie AH. 2003. Corrigendum to “Imaging the intact guinea pig tympanic bulla by orthogonal plane fluorescence optical sectioning microscopy.” Hear Res. 181:144 doi: 10.1016/S0378-5955(03)00167-9 [DOI] [PubMed] [Google Scholar]
- Voie A H, Burns DH, Spelman FA. 1993. Orthogonal-plane fluorescence optical sectioning: three-dimensional imaging of macroscopic biological specimens. J Microsc. 170:229–236 doi: 10.1111/j.1365-2818.1993.tb03346.x [DOI] [PubMed] [Google Scholar]
- Welkenhuyzen F, Kiekens K, Pierlet M, Dewulf W. 2010. Industrial computer tomography for dimensional metrology: overview of influence factors and improvement strategies. In Buytaert J., Dirckx J. (Eds.), Optical measurement techniques for systems and structures (pp. 401–410). Herzogenrath, Germany: Shaker Verlag [Google Scholar]


