Abstract
Hydrogen sulfide (H2S) is an endogenous gasotransmitter with physiologic functions similar to nitric oxide and carbon monoxide. Exogenous treatment with H2S can induce a reversible hypometabolic state, which can protect organs from ischemia/reperfusion injury, but whether cystathionine γ-lyase (CSE), which produces endogenous H2S, has similar protective effects is unknown. Here, human renal tissue revealed abundant expression of CSE, localized to glomeruli and the tubulointerstitium. Compared with wild-type mice, CSE knockout mice had markedly reduced renal production of H2S, and CSE deficiency associated with increased damage and mortality after renal ischemia/reperfusion injury. Treatment with exogenous H2S rescued CSE knockout mice from the injury and mortality associated with renal ischemia. In addition, overexpression of CSE in vitro reduced the amount of reactive oxygen species produced during stress. Last, the level of renal CSE mRNA at the time of organ procurement positively associated with GFR 14 days after transplantation. In summary, these results suggest that CSE protects against renal ischemia/reperfusion injury, likely by modulating oxidative stress through the production of H2S.
In recent years, the fundamental physiologic role of hydrogen sulfide (H2S) has gradually been uncovered. H2S is now acknowledged as the third endogenously produced gaseous signaling molecule, in addition to nitric oxide and carbon monoxide.1 H2S is generated from the amino acid l-cysteine by three distinct enzymes: cystathionine γ-lyase (CSE), cystathionine β-synthase (CBS), and 3-mercaptopyruvate sulfurtransferase (MPST).2 In the cardiovascular system, CSE is the most abundantly expressed protein, and is responsible for the majority of endogenous H2S production.3 The physiologic properties of endogenously produced H2S are remarkably similar among the different gasotransmitters. H2S functions as an endothelial cell–derived relaxing factor similar to nitric oxide.4 Accordingly, CSE-deficient mice (CSE−/−) develop hypertension,3 analogous to mice lacking endothelial nitric oxide synthase5 and CBS+/− mice.6 In addition, endogenously produced H2S is involved in cellular proliferation,7 angiogenesis,8 inflammation9,10 and regulation of protein activity through S-sulfhydration.11–13
Exogenous treatment with H2S can induce a reversible hypometabolic, hibernation-like state.14 The proposed mechanism behind H2S-induced hypometabolism is through the reduction of mitochondrial activity by reversible binding to cytochrome c oxidase.15 During hypoxia, H2S treatment ameliorates the reduction in the function and integrity of mitochondria.16–18 The lower demand for oxygen during hypometabolism can protect animals from hypoxia or shock, and organs from ischemia/reperfusion injury (IRI).16,17,19,20 Exogenous H2S can play a detoxifying role during oxidative stress by directly scavenging reactive oxygen/nitrogen species (ROS/RNS) as well as increasing the formation of the antioxidant glutathione.21,22
In this study, we found that CSE deficiency in mice led to reduced renal H2S production and was associated with increased mortality and severity of damage after renal IRI. Administering exogenous H2S rescued these mice from mortality and injury associated with renal ischemia. Our in vivo experiments together with in vitro cell studies in which CSE is overexpressed highlight the fundamental role that CSE has in regulating the amount of ROS associated with hypoxic stress. In addition, we notably found that CSE mRNA and protein levels were shown to be associated with kidney outcome after transplantation. Together, our data reveal CSE as a modulator of oxidative stress induced after renal ischemia.
Results
Localization of CSE in Control Human Renal Tissue
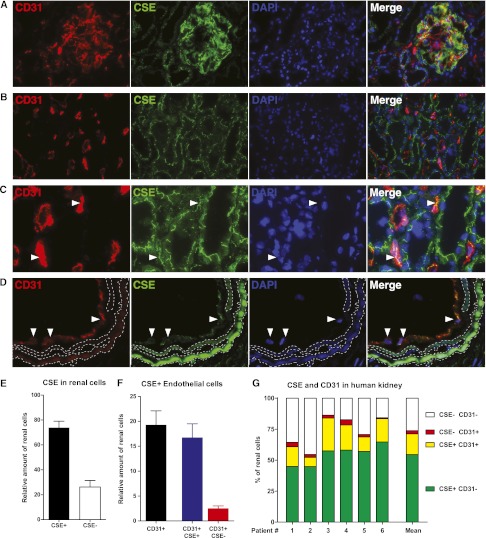
In human renal tissue, CSE protein was localized to glomeruli and tubulointerstitium. Glomeruli were homogenously positive for CSE. Nonendothelial (CD31-negative) glomerular cells showed positive staining in addition to endothelial (CD31-positive) cells, indicating expression in mesangial cells and/or podocytes (Figure 1A). CSE was seen in proximal and distal tubular epithelium (Figure 1B), peritubular capillaries (Figure 1C), and vascular endothelium (Figure 1D). The protein was observed in an unidentified intracellular staining pattern, showing a distinct line-like staining in the cytosolic compartments of tubules and nonglomerular endothelial cells (Figure 1B). TissueFAXS analysis showed that 75% of renal cells were positive for CSE (Figure 1E). Moreover, when we investigated endothelial cells, we found that 87% of endothelium was positive for CSE (Figure 1F). Transplant biopsies showed similar localization and staining pattern as the control renal tissue (data not shown).
Figure 1.
CSE is localized to glomeruli and tubolointerstitium in the human kidney. Representative examples of the localization of CSE (green) and the colocalization with CD31-positive cells (red). CSE is localized in (A) the glomerulus (endothelial and mesangial cells), (B) tubules, (C) peritubular capillaries (colocalization of CSE with CD31 is seen as yellow in the merged images, and is marked by white arrowheads) and (D) vascular endothelial cells (white arrowheads). In (D), aspecific autofluorescence of the elastic laminae is demarcated in dashed lines. Image (C) is a magnification from image (B). CSE is expressed in proximal and distal renal tubules (A–C) in an unidentified subcellular staining pattern. (E) TissueFAXS analysis of the total amount of CSE-expressing cells in the kidney of six control kidneys, indicating that 75% of renal cells express CSE. (F) Of all renal endothelial cells, the large majority express CSE. (G) The variation between control patients in the abundance of CSE and CD31 expressing cells. Original magnification, ×630.
CSE mRNA and Protein Levels Are Modulated after Renal Ischemia in Rats
The expression of CSE mRNA was modulated after ischemia in control rat kidneys. An increase was seen after 90 minutes, after which expression decreased to significantly lower levels (Figure 2A). mRNA levels were decreased at 1 and 4 days after ischemia, after which mRNA levels normalized to basal values after 9 days and afterward (Figure 2A). CSE protein levels were reduced by ischemia in the long term, showing significantly reduced levels at 4 days, 14 days, and 21 days. The expression of CBS was modulated in a temporally similar pattern (Figure 2C).
Figure 2.
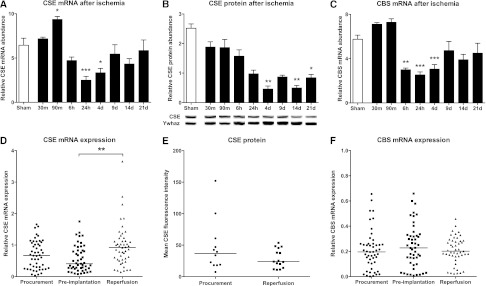
CSE and CBS are modulated after renal ischemia/reperfusion. Renal expression of (A) CSE and (C) CBS at various time points in the first 21 days after renal ischemia in rats (n=5–6 animals per group). CSE mRNA is increased in the acute stage, and both are reduced in the medium to long term, and normalized after 9 days. (B) CSE protein abundance as measured by Western blot, showing significantly reduced CSE protein at 4, 14, and 21 days (n=3–5 animals per group). Representative protein bands, all from the same blot, are under each bar. Expression of (D) CSE mRNA and (F) CBS mRNA in human donor biopsies at different time points during the transplant process. CSE expression at reperfusion is significantly increased compared with preimplantation. (E) No significant difference is found in CSE protein levels between procurement and reperfusion time points in human renal transplantation. *P<0.05; **P<0.01; ***P<0.001.
CSE, but not CBS, mRNA Expression Levels Were Altered during the Transplant Process
CSE mRNA levels were significantly increased after reperfusion (P<0.01) (Figure 2D). Median expression levels were 0.67 for procurement (range, 0.03–1.66), 0.41 for preimplantation (range, 0.08–1.75), and 0.93 for reperfusion (0.15–3.65). CBS mRNA levels were not modulated during the transplant process (Figure 2F), with a median of 0.20 for procurement (range, 0.001–1.99), 0.23 for preimplantation (range, 0.007–1.09), and 0.20 for reperfusion (range, 0.02–0.86).
Modulation of CSE Protein Levels during the Transplant Process
CSE immunofluorescence was performed on a limited number of renal transplant biopsies (n=27). No differences in protein levels were detected between preimplantation and reperfusion time points (Figure 2E).
CSE-Deficient Mice Have Reduced Renal H2S Production
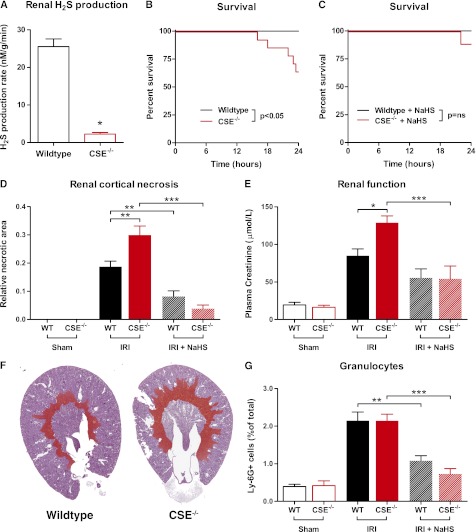
Kidneys from untreated wild-type (WT) and CSE knockout (CSE−/−) animals were examined to confirm that CSE deficiency caused reduced production of H2S in renal tissue. CSE−/− mice had a 91% reduction in renal H2S production compared with WT mice (P<0.05; Figure 3A).
Figure 3.
CSE deficiency causes increased mortality and renal damage after ischemia/reperfusion. (A) Renal H2S production rate is significantly lower in CSE−/− mice compared with WT mice (n=4 per group). (B) Animal survival after renal IRI is impaired in the CSE−/− animals (P<0.05, n=14 per group). (C) Treatment with NaHS rescues CSE−/− mice from IRI-induced mortality (P=ns; WT, n=7; CSE−/−, n=9). (D) The amount of renal cortical necrosis is significantly higher in CSE−/− mice (n=9) compared with WT (n=14), whereas pretreatment with NaHS reduces necrosis in both WT (n=7) as well as CSE−/− mice (n=8) (WT sham, n=9; CSE−/− sham, n=8). (E) Plasma creatinine levels indicate reduced renal function after ischemia in CSE−/− (n=9) compared with WT mice (n=14). NaHS treatment protected CSE−/− mice (n=8) from the IRI-induced decline in renal function (WT sham, n=9; CSE−/− sham, n=8). (F) Representative examples of periodic acid Schiff–stained coronal renal sections from WT and CSE−/− animals with the necrotic area artificially colored red. (G) Influx of Ly-6G–positive granulocytes is not affected by CSE deficiency (CSE−/−, n=9; WT, n=14). Granulocyte influx is reduced in both WT (n=7) and CSE−/− animals (n=8) after NaHS pretreatment (WT sham, n=9; CSE−/− sham, n=8). *P<0.05; **P<0.01; ***P<0.001.
Increased Mortality after Bilateral Renal Ischemia in CSE-Deficient Mice
Mortality after IRI was significantly higher in the CSE−/− animals, in which 35% (5 of 14) of animals died within the first 24 hours, whereas WT animals showed 0% (0 of 14) mortality during this period (P<0.05; Figure 3B). CSE−/− animals could be rescued by pretreatment with NaHS, with 11% (1 of 9) mortality compared with 0% (0 of 9) in WT animals (P=0.38; Figure 3C).
CSE-Deficient Mice Display More Severe Kidney Damage and Decreased Renal Function after IRI Compared with WT Mice
No necrosis was detected in kidneys of sham-operated mice, whereas all kidneys subjected to ischemia/reperfusion showed tubular necrosis in the corticomedullary transition area. CSE−/− animals showed 60% higher levels of necrosis compared with WT animals (P<0.01; Figure 3D, with representative examples in Figure 3F and representative photomicrographs in Supplemental Figure 1). The amount of necrosis was reduced by treatment with NaHS regardless of genotype. Renal function as measured by plasma creatinine levels showed a similar pattern, with a 51% higher level of creatinine in CSE−/− animals compared with WT animals after IRI. Pretreatment with NaHS significantly improved renal function in CSE−/− animals (P<0.001; Figure 3E). Creatinine levels were similar in sham-operated animals, indicating that renal function in untreated CSE−/− is not impaired (Figure 3E).
Renal Inflammation after Renal Ischemia/Reperfusion
Granulocyte influx as measured by Ly-6G immunohistochemistry showed an increase after ischemia in both WT and CSE−/− animals, which was abrogated by NaHS treatment regardless of genotype. There was no difference in the amount of granulocytes between WT and CSE−/− animals (Figure 3G).
CSE Mice Display Increased Levels of DNA Damage after Ischemia/Reperfusion
To determine the extent of oxidative damage after IRI, we carried out immunofluorescence staining for γH2AX, a marker for DNA double-strand breaks (DSBs) on kidney sections from CSE−/− and WT mice. γH2AX plays an important role in the DNA damage response and is necessary for DSB repair, and a proven marker of oxidative stress.23 We found phosphorylated γH2AX-positive cells in the cortical tubular cells of mice after IRI the amount of positive cells was significantly higher in CSE−/− mice compared with WT mice (Figure 4A). Pretreatment with NaHS reduced the amount of pγH2AX-positive cells in both WT and CSE-deficient mice but did not reduce the amount of positive cells to sham injury levels (Figure 4A).
Figure 4.
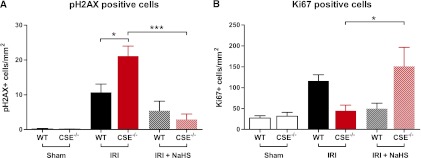
CSE deficiency is associated with increased DNA damage after ischemia/reperfusion. (A) Abundance of the phosphorylated DNA repair protein H2AX is significantly higher in CSE−/− animals after IRI (n=9) compared with WT animals (n=14), indicating an increased amount of DNA DSBs, possibly related to oxidative DNA damage. (B) After IRI, the expression of the nuclear proliferation marker Ki67 is not increased in CSE−/− animals (n=9) compared with WT (n=14), but is significantly increased after NaHS pretreatment and IRI combined (n=8) (WT sham, n=9; CSE−/− sham, n=8).
Proliferation after Renal Ischemia/Reperfusion
Ki67 staining indicated that CSE−/− animals did not have increased proliferation after IRI (Figure 4B). The amount of Ki67-positive nuclei was significantly increased after NaHS treatment in combination with IRI in CSE−/− animals, but not in the WT animals (Figure 4B).
Renin is not Differentially Expressed in WT and CSE−/− mice
Immunohistochemistry for renin showed its expression in the juxtaglomerular cells. When the amount of glomeruli with renin-positive juxtaglomerular cells was counted, no significant differences between the groups were found (Figure 5A). The number of renin-positive juxtaglomerular cells per glomerulus did not differ between groups (Figure 5B). The lack of renal H2S production in CSE−/− mice does not affect renin levels, nor does the treatment of WT or CSE−/− animals with NaHS. IRI also does not affect renin levels 24 hours after ischemia.
Figure 5.
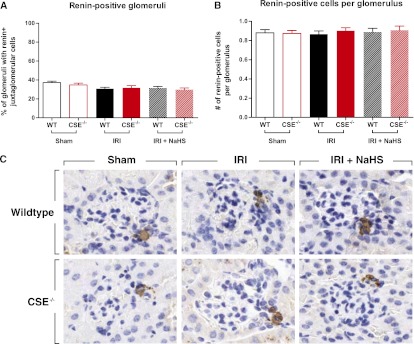
No difference in renin expression between genotypes or between treatment groups. (A) The percentage of glomeruli that have renin-positive juxtaglomerular cells and (B) the amount of renin-positive juxtaglomerular cells per glomerulus in the different groups do not differ. (C) Representative examples of glomeruli with renin-positive juxtaglomerular cells. Original magnification, ×200.
Cell Viability, Enhanced Green Fluorescent Protein Fluorescence, and CSE Protein Abundance after Transfection
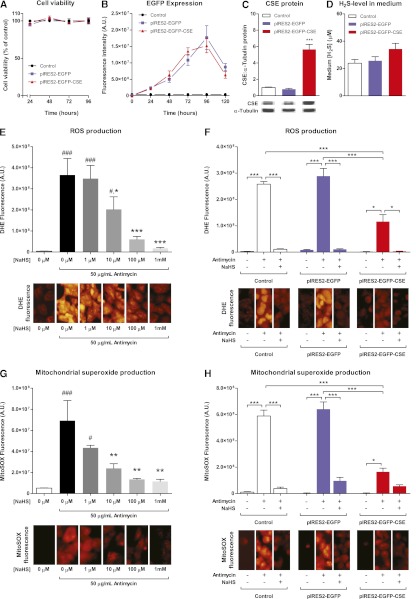
Transfection with the pIRES2-EGFP or pIRES2-EGFP-CSE plasmids did not affect viability of HEK293 cells between 1 and 4 days after transfection (Figure 6A). Both plasmids increased the amount of enhanced green fluorescent protein (EGFP) fluorescence between 1 and 5 days after transfection, reaching a peak between 3 and 4 days (Figure 6B). The amount of EGFP fluorescence was not significantly different between the two plasmids. Western blot at 72 hours after transfection showed no effect of mock-transfection with pIRES2-EGFP on CSE protein, whereas the pIRES2-EGFP-CSE plasmid induced a 6-fold increase in the band density for CSE (Figure 6C). The amount of H2S in the supernatant medium of the pIRES2-EGFP-CSE transfected cells did not significantly differ from the H2S levels in the control and pIRES2-EGFP transfected groups (Figure 6D).
Figure 6.
CSE overexpression modulates oxidative stress in vitro. (A) Cell viability is not affected by transfection with pIRES2-EGFP or pIRES2-EGFP-CSE vectors. (B) EGFP fluorescence intensity after transfection, showing peak values between 72 and 96 hours after transfection with both control and CSE vector. (C) CSE protein as measured by Western blot shows an increase of 6× after 72 hours after transfection with pIRES2-EGFP-CSE vector (***P<0.001), whereas there is no increase in CSE expression in the pIRES2-EGFP transfected cells compared with controls (representative bands from the same gel are shown). (D) No differences in supernatant H2S are measured. (E) Antimycin-induced cytoplasmatic ROS production as measured by DHE fluorescence is significantly and concentration-dependently attenuated by treatment with NaHS (###P<0.001 versus −NaHS, −Antimycin; *P<0.05; ***P<0.001 versus −NaHS, +Antimycin). (F) DHE fluorescence is not affected by transfection with the pIRES2-EGFP vector, but is significantly reduced by transfection with pIRES2-EGFP-CSE. Treatment with NaHS further reduces DHE fluorescence intensity in all groups (*P<0.05; ***P<0.001). (G) Mitochondrial superoxide production, as measured with the fluorescent MitoSOX probe, is significantly and concentration-dependently reduced by NaHS treatment (#P<0.05; ###P<0.001 versus −NaHS, −Antimycin; **P<0.01 versus −NaHS, +Antimycin). (H) pIRES2-EGFP transfection does not affect MitoSOX fluorescence after antimycin treatment, whereas pIRES2-EGFP-CSE transfection significantly reduces the amount of mitochondrial superoxide produced (*P<0.05; ***P<0.001). Addition of NaHS does not produce significant additional effects in the pIRES2-EGFP-CSE transfected cells. Data are representative of at least three independent experiments.
Effects of Exogenous NaHS and CSE Overexpression on Mitochondrial and Overall Superoxide
Antimycin A–induced oxidative stress as measured by dihydroethidine (DHE) fluorescence in HEK293 cells was concentration-dependently reduced by treatment with NaHS. Antimycin induced a 48× increase in fluorescence, which was significantly attenuated by NaHS (Figure 6E). Mitochondrial superoxide production as assessed by MitoSOX fluorescence showed a similar pattern, with a 13.5-fold increase in fluorescence, which was significantly lower when treated with 10 μM, 100 μM, or 1 mM NaHS (Figure 6G).
Treatment with antimycin A showed an increase in DHE (Figure 6F) and MitoSOX (Figure 6H) fluorescence in all groups. Fluorescence intensity was similar in control and pIRES2-EGFP transfected groups, whereas cells overexpressing CSE showed a significantly reduced amount of fluorescence. The reduction was 60% when measured using DHE (Figure 6F, red bar), and 74% using MitoSOX (Figure 6H, red bar). Treatment with 1 mM of NaHS reduced the amount of fluorescence of both probes in all groups except the CSE overexpressing cells loaded with MitoSOX (Figure 6H, red bars).
Association of CSE and CBS mRNA Expression Pretransplantation and Renal Function after Transplantation
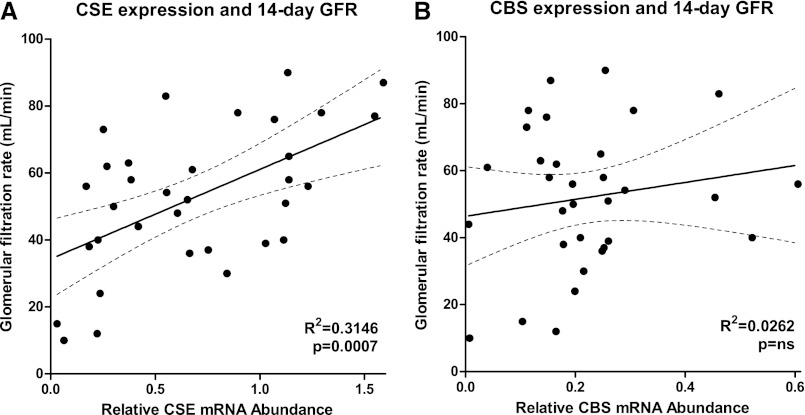
CSE mRNA levels at organ procurement were positively associated with renal function 14 days after transplantation, as measured by GFR. Linear regression analysis showed that the association significantly deviated from zero (P<0.001), and the goodness of fit (R2) was 0.32 (Figure 7A). Relative CBS mRNA levels did not associate with renal function after transplantation, showing no significant deviation from zero (P=0.16) and low goodness of fit with an R2 of 0.03 (Figure 7B).
Figure 7.
CSE mRNA expression is associated with renal function after transplantation in humans. (A) Renal CSE mRNA level at organ procurement is associated with the GFR at 14 days after transplantation, with higher expression associating with better renal function (R2=0.31; P<0.001; n=33). Renal CBS levels at procurement are not associated with outcome after renal transplantation (R2=0.03; P=0.16; n=32). Lines denote best fit, with the dashed lines representing the 95% confidence interval for best fit.
Discussion
Over the past decades, the perceived image of H2S has transformed from that of a dangerously toxic molecule to that of an endogenously produced gas affecting many physiologic processes. The similarities between H2S and the other gasotransmitters are numerous.1,2 In this study, we show that the endogenous production of H2S reduces the damage associated with renal IRI. We and others previously demonstrated the highly protective effects of exogenously applied H2S treatment in similar models of ischemia.16,17,19,24–27 From this study, it now becomes clear that after renal hypoxic stress, CSE functions as an endogenous mediator of the antioxidant response, most likely through the production of H2S.
This study shows that CSE is abundantly present in the normal human kidney, with widespread expression in the tubules. We found that the majority of renal tubules stain positive for CSE, which aligns with a previous study indicating that CSE activity was found in all segments of the renal tubule, with the highest activity in the proximal straight and distal tubules.28 The large majority of renal endothelial cells express CSE. In CSE-deficient mice, renal H2S production was reduced by >90%, indicating that CSE is the most essential H2S producing enzyme in the kidney.
There was a clear association between the absence of CSE expression in the CSE−/− mice and an increase in renal damage after IRI. Mortality, renal failure, and tubular necrosis were significantly increased when renal H2S production was low. Treatment with exogenous NaHS rescued these animals from death and renal failure. The absence of CSE expression did not influence the inflammatory response. This indicates that endogenous production of H2S does have the anti-inflammatory effects that the concentrations afforded by exogenous H2S treatment has in this model.16 Others have shown the inhibitory effects of endogenously produced H2S by CSE on leukocyte adhesion.9 We have no indication of the actual plasma concentrations and, perhaps more relevant, the intracellular concentrations caused by CSE/CBS/MPST activity relative to those brought by exogenous H2S. This means that, in this model, the concentrations needed to produce anti-inflammatory effects might be too high to be reached by endogenous H2S production. The known inhibitory effects of H2S on inflammatory processes are likely absent in the CSE−/− mice, so increased influx of leukocytes was expected in this model, especially with the increased renal damage in the CSE−/− mice. The results indicate that CSE deficiency can also influence the inflammatory response to injury through an unknown mechanism.
Excessive generation of ROS after injury damages proteins, DNA, mitochondria, and lipids and can stimulate the immune system, leading to organ damage.29 Hydroxyl radicals can also react with nearby tissues, resulting in cellular DNA damage.30 Phosphorylated γH2AX is a well known marker of DNA damage and, in particular, of DSBs.31 Phosphorylated γH2AX is the first step in recruiting and localizing DNA repair proteins. We found more DSBs as detected by γH2AX staining in the kidneys of CSE mice after IRI compared with WT. Pretreatment of NaHS was associated with reduced amounts of DNA damage together with all of the other parameters of renal injury. Our results show that severe DNA damage in CSE−/− mice was associated with a reduced but not significant number of Ki67-positive cells (hence, cell proliferation) compared with WT mice.
Proliferation is affected by CSE, as Ki67 immunofluorescence showed. CSE activity or the availability of H2S seems to be a necessity for the induction of proliferation in this model, because IRI by itself does not induce Ki67 expression in CSE−/− animals, but the combination of IRI and NaHS treatment induces high expression of this protein. Interestingly, treatment of WT animals with NaHS during IRI seems to inhibit proliferation, which correlates with the amount of renal cell damage in this experiment, indicating that the protective effects seen in WT animals are not due to an increase in regeneration. These results contrast earlier work, in which CSE deficiency caused overproliferation in vascular smooth muscle cells.7
Because CSE−/− animals develop higher BP compared with WT after 6 weeks (a rise of about 10 mmHg at 7 weeks),3 the differences between groups could be related to differences in renal perfusion before or after the ischemic event. To investigate this, we measured renin expression in the juxtaglomerular apparatus (Figure 5). We found no differences between WT and CSE−/− mice, or between IRI and NaHS treated groups. This indicates that there were no large differences in renal perfusion between the groups, and that neither the increase in renal damage after IRI in the CSE−/− animals, nor the protective effects of NaHS can be explained by altered perfusion. Lu et al. recently showed that H2S can inhibit renin expression in a 2K1C model, but it did not affect expression in sham or unclipped kidneys.32 We noted no effect of NaHS on renin expression, suggesting that H2S can inhibit an increase in renin levels, but does not affect normal renin levels. However, renin protein levels have to be regarded as a crude marker for renal perfusion, for which changes can only be detected with large perfusion differences.
In vitro experiments showed that exogenous H2S treatment concentration-dependently reduced the amount of intracellular ROS production when stimulated with antimycin. A significant effect was reached at low concentrations. Overexpression of CSE showed a reduction in oxidative stress that was similar to approximately 10 μM of NaHS. This concentration is close to the most quoted physiologic range of 30–300 μM in human serum, but the actual physiologic concentration in mammals is still up for discussion.33 The addition of 1 mM NaHS showed a further reduction in DHE fluorescence, which might indicate that overexpression of CSE did not induce supraphysiologic concentrations in this particular model. The fact that we did not find a significant increase in supernatant H2S concentration after CSE overexpression is expected, because H2S rapidly evaporates from solution at physiologic pH34 or from serum.33
Whether H2S directly scavenges ROS, increases the intracellular glutathione levels, or reduces the amount of ROS produced through modulation of mitochondrial ROS production was not assessed by this study. H2S can exert all of these effects,2 so the protective and antioxidant effects demonstrated here could be the result of multiple mechanisms acting simultaneously. One previous study assessed the effects of CSE overexpression in a murine model of myocardial infarction. Myocardium-specific overexpression of CSE nearly doubled H2S production and reduced myocardial infarct size by 47%.17 Other studies have shown the effects of inhibitors of CSE and CBS in ischemic models, but the specificity of these inhibitors is subject to discussion.35 Most studies using these inhibitors imply protective effects afforded by endogenous H2S.25,36–38 Interestingly, recent data suggest that under stress, CSE can translocate to mitochondria, and H2S produced by mitochondrially located CSE can be used as a substrate for the production of ATP.39 This might be an additional protective mechanism in the setting of ischemia/hypoxia.
The association between the mRNA expression of CSE and the outcome after human renal transplantation is an indication that CSE could have protective effects in human IRI similar to those we have found in murine models. The observation that CBS is not differentially expressed during the transplant process, nor is it associated with outcome after transplantation, indicates a central role for CSE in human renal tissue. We found an increase in mRNA expression of CSE shortly after reperfusion in humans, which was similar to the results from rats. The decrease in CSE mRNA and protein expression found at the later time points after reperfusion in the murine model could not be confirmed in the human study due to the absence of biopsies late after reperfusion. The question remains whether this early decrease is associated with a functional mechanism in which CSE is downregulated or inhibited during renal repair and regeneration, or the inflammatory response to injury.
Taken together, our data reveal a key role for CSE in the regulation of oxidative stress induced after renal ischemia, most likely through the production of H2S. The modulation of CSE expression and activity may be a therapeutic target in settings of hypoxia.
Concise Methods
Collection of Human Material
Human renal transplant biopsies were obtained from brain-dead or living donors (n=50) at three different time points: just before donation (before start of preservation), at the end of cold ischemia, and approximately 45 minutes after reperfusion in the recipient (Table 1). Control kidneys were taken from the unaffected part of kidneys from patients undergoing nephrectomy for renal cell carcinoma (n=6). Detailed methods are available in the Supplemental Material.
Table 1.
Characteristics of the human kidney donors analyzed in the different analyses performed in this work
| Characteristic | Ratio, Mean (Range), or n |
|---|---|
| Sex (male/female) | 17:33 |
| Age (yr) | 49 (16–70) |
| Donor type (living:brain-dead) | 20:30 |
| Cold ischemia time, min | 742 (112–2091) |
| Warm ischemia time, min | 39 (13–91) |
| Delayed graft function | 11 |
| Rejection (1 yr) | 9 |
Animals
CSE-deficient mice (CSE−/−) were generated using conventional techniques as previously described.3 WT C57BL/6J littermates were used as control animals. Male Wistar rats (250–300 g) were used for time-course experiments.
IRI Protocol
Renal IRI in mice was performed as previously described.16 In short, both renal pedicles were clamped for 30 minutes using nontraumatic vascular clamps through a midline abdominal incision under general anesthesia (ketamine/xylazine). Core body temperature was maintained at 37°C in all groups using heat pads and lamps. NaHS injection (1 mg/kg) was given intraperitoneally 15 minutes before clamping. Mice were terminated after 1 day of reperfusion and samples were collected.
Cell Culture Experiments
To generate CSE overexpressing cells, human embryonic kidney 293 (HEK293) cells were transfected with the pIRES2-EGFP (mock) or pIRES2-EGFP-CSE vector in 24- or 96-well plates. For induction of ROS, antimycin A (50 μg/ml) with or without NaHS (1–1000 μM) was given for 30 minutes. Subsequently, cells were incubated with 15 μM dihydroethidine or 5 μM MitoSOX for 15 minutes.
Renin Measurement
Renin immunohistochemistry was performed as previously described.40 Subsequently, the amount of glomeruli with renin-positive juxtaglomerular cells was counted. In a second analysis, the amount of renin-positive cells per glomerulus was counted. For both measurements, the complete cortex was analyzed in a blinded fashion.
TissueFAXS Analyses
CSE-Alexa 488/CD31-TRITC/DAPI triple-stained sections were scanned using a fluorescent microscope fitted with an automated acquisition system (TissueFAXS; TissueGnostics GmbH, Vienna, Austria). Percentages of CSE+, CD31+, and CSE+CD31+ cells were measured using TissueQuest software (TissueGnostics), using an algorithm based on the recognition of nuclei and their associated cytoplasm. Ki67 and γH2AX stained sections were quantified in this manner as well.
Statistical Analyses
Data were analyzed using Mann–Whitney U tests, one-way ANOVA, or Kruskal–Wallis tests where appropriate. Bonferroni or Dunn’s postcorrection was applied where multiple comparisons were made. Normality was tested using the Kolmogorov–Smirnov test. A value of P<0.05 was considered statistically significant. Data are expressed as the mean ± SEM unless otherwise indicated.
Disclosures
None.
Acknowledgments
The authors express their gratitude to Sippie Huitema and Marian Bulthuis for their excellent technical and logistical support, as well as Shetuan Zhang from the Department of Physiology, Queen's University, Kingston, Ontario, Canada, for donating the pIRES2-EGFP plasmid.
This study was financially supported by a Kolff Grant from the Dutch Kidney Foundation (to E.M.B.), a grant from the Groningen University Institute for Drug Exploration (to E.M.B.), a ZonMW Medium Investment Grant (to J.-L.H.), and an operating grant from the Canadian Institutes of Health Research (to R.W.).
Footnotes
Published online ahead of print. Publication date available at www.jasn.org.
This article contains supplemental material online at http://jasn.asnjournals.org/lookup/suppl/doi:10.1681/ASN.2012030268/-/DCSupplemental.
References
- 1.Wang R: Two’s company, three’s a crowd: Can H2S be the third endogenous gaseous transmitter? FASEB J 16: 1792–1798, 2002 [DOI] [PubMed] [Google Scholar]
- 2.Szabó C: Hydrogen sulphide and its therapeutic potential. Nat Rev Drug Discov 6: 917–935, 2007 [DOI] [PubMed] [Google Scholar]
- 3.Yang G, Wu L, Jiang B, Yang W, Qi J, Cao K, Meng Q, Mustafa AK, Mu W, Zhang S, Snyder SH, Wang R: H2S as a physiologic vasorelaxant: Hypertension in mice with deletion of cystathionine gamma-lyase. Science 322: 587–590, 2008 [DOI] [PMC free article] [PubMed] [Google Scholar]
- 4.Mustafa AK, Sikka G, Gazi SK, Steppan J, Jung SM, Bhunia AK, Barodka VM, Gazi FK, Barrow RK, Wang R, Amzel LM, Berkowitz DE, Snyder SH: Hydrogen sulfide as endothelium-derived hyperpolarizing factor sulfhydrates potassium channels. Circ Res 109: 1259–1268, 2011 [DOI] [PMC free article] [PubMed] [Google Scholar]
- 5.Huang PL, Huang Z, Mashimo H, Bloch KD, Moskowitz MA, Bevan JA, Fishman MC: Hypertension in mice lacking the gene for endothelial nitric oxide synthase. Nature 377: 239–242, 1995 [DOI] [PubMed] [Google Scholar]
- 6.Sen U, Munjal C, Qipshidze N, Abe O, Gargoum R, Tyagi SC: Hydrogen sulfide regulates homocysteine-mediated glomerulosclerosis. Am J Nephrol 31: 442–455, 2010 [DOI] [PMC free article] [PubMed] [Google Scholar]
- 7.Yang G, Wu L, Bryan S, Khaper N, Mani S, Wang R: Cystathionine gamma-lyase deficiency and overproliferation of smooth muscle cells. Cardiovasc Res 86: 487–495, 2010 [DOI] [PubMed] [Google Scholar]
- 8.Papapetropoulos A, Pyriochou A, Altaany Z, Yang G, Marazioti A, Zhou Z, Jeschke MG, Branski LK, Herndon DN, Wang R, Szabó C: Hydrogen sulfide is an endogenous stimulator of angiogenesis. Proc Natl Acad Sci U S A 106: 21972–21977, 2009 [DOI] [PMC free article] [PubMed] [Google Scholar]
- 9.Zanardo RCO, Brancaleone V, Distrutti E, Fiorucci S, Cirino G, Wallace JL: Hydrogen sulfide is an endogenous modulator of leukocyte-mediated inflammation. FASEB J 20: 2118–2120, 2006 [DOI] [PubMed] [Google Scholar]
- 10.Miller TW, Wang EA, Gould S, Stein EV, Kaur S, Lim L, Amarnath S, Fowler DH, Roberts DD: Hydrogen sulfide is an endogenous potentiator of T cell activation. J Biol Chem 287: 4211–4221, 2012 [DOI] [PMC free article] [PubMed] [Google Scholar]
- 11.Mustafa AK, Gadalla MM, Sen N, Kim S, Mu W, Gazi SK, Barrow RK, Yang G, Wang R, Snyder SH: H2S signals through protein S-sulfhydration. Sci Signal 2: ra72, 2009 [DOI] [PMC free article] [PubMed] [Google Scholar]
- 12.Krishnan N, Fu C, Pappin DJ, Tonks NK: H2S-Induced sulfhydration of the phosphatase PTP1B and its role in the endoplasmic reticulum stress response. Sci Signal 4: ra86, 2011 [DOI] [PMC free article] [PubMed] [Google Scholar]
- 13.Sen N, Paul BD, Gadalla MM, Mustafa AK, Sen T, Xu R, Kim S, Snyder SH: Hydrogen sulfide-linked sulfhydration of NF-κB mediates its antiapoptotic actions. Mol Cell 45: 13–24, 2012 [DOI] [PMC free article] [PubMed] [Google Scholar]
- 14.Blackstone E, Morrison M, Roth MB: H2S induces a suspended animation-like state in mice. Science 308: 518, 2005 [DOI] [PubMed] [Google Scholar]
- 15.Khan AA, Schuler MM, Prior MG, Yong S, Coppock RW, Florence LZ, Lillie LE: Effects of hydrogen sulfide exposure on lung mitochondrial respiratory chain enzymes in rats. Toxicol Appl Pharmacol 103: 482–490, 1990 [DOI] [PubMed] [Google Scholar]
- 16.Bos EM, Leuvenink HGD, Snijder PM, Kloosterhuis NJ, Hillebrands J-L, Leemans JC, Florquin S, van Goor H: Hydrogen sulfide-induced hypometabolism prevents renal ischemia/reperfusion injury. J Am Soc Nephrol 20: 1901–1905, 2009 [DOI] [PMC free article] [PubMed] [Google Scholar]
- 17.Elrod JW, Calvert JW, Morrison J, Doeller JE, Kraus DW, Tao L, Jiao X, Scalia R, Kiss L, Szabo C, Kimura H, Chow CW, Lefer DJ: Hydrogen sulfide attenuates myocardial ischemia-reperfusion injury by preservation of mitochondrial function. Proc Natl Acad Sci U S A 104: 15560–15565, 2007 [DOI] [PMC free article] [PubMed] [Google Scholar]
- 18.Minamishima S, Bougaki M, Sips PY, Yu JD, Minamishima YA, Elrod JW, Lefer DJ, Bloch KD, Ichinose F: Hydrogen sulfide improves survival after cardiac arrest and cardiopulmonary resuscitation via a nitric oxide synthase 3-dependent mechanism in mice. Circulation 120: 888–896, 2009 [DOI] [PMC free article] [PubMed] [Google Scholar]
- 19.Jha S, Calvert JW, Duranski MR, Ramachandran A, Lefer DJ: Hydrogen sulfide attenuates hepatic ischemia-reperfusion injury: role of antioxidant and antiapoptotic signaling. Am J Physiol Heart Circ Physiol 295: H801–H806, 2008 [DOI] [PMC free article] [PubMed] [Google Scholar]
- 20.Bos EM, Snijder PM, Jekel H, Weij M, Leemans JC, van Dijk MCF, Hillebrands J-L, Lisman T, van Goor H, Leuvenink HGD: Beneficial effects of gaseous hydrogen sulfide in hepatic ischemia/reperfusion injury. Transpl Int 25: 897–908, 2012 [DOI] [PubMed] [Google Scholar]
- 21.Kimura Y, Kimura H: Hydrogen sulfide protects neurons from oxidative stress. FASEB J 18: 1165–1167, 2004 [DOI] [PubMed] [Google Scholar]
- 22.Kimura Y, Goto Y-I, Kimura H: Hydrogen sulfide increases glutathione production and suppresses oxidative stress in mitochondria. Antioxid Redox Signal 12: 1–13, 2010 [DOI] [PubMed] [Google Scholar]
- 23.Li Z, Yang J, Huang H: Oxidative stress induces H2AX phosphorylation in human spermatozoa. FEBS Lett 580: 6161–6168, 2006 [DOI] [PubMed] [Google Scholar]
- 24.Tripatara P, Patel NSA, Brancaleone V, Renshaw D, Rocha J, Sepodes B, Mota-Filipe H, Perretti M, Thiemermann C: Characterisation of cystathionine gamma-lyase/hydrogen sulphide pathway in ischaemia/reperfusion injury of the mouse kidney: An in vivo study. Eur J Pharmacol 606: 205–209, 2009 [DOI] [PubMed] [Google Scholar]
- 25.Tripatara P, Patel NSA, Collino M, Gallicchio M, Kieswich J, Castiglia S, Benetti E, Stewart KN, Brown PAJ, Yaqoob MM, Fantozzi R, Thiemermann C: Generation of endogenous hydrogen sulfide by cystathionine gamma-lyase limits renal ischemia/reperfusion injury and dysfunction. Lab Invest 88: 1038–1048, 2008 [DOI] [PubMed] [Google Scholar]
- 26.Blackstone E, Roth MB: Suspended animation-like state protects mice from lethal hypoxia. Shock 27: 370–372, 2007 [DOI] [PubMed] [Google Scholar]
- 27.Morrison ML, Blackwood JE, Lockett SL, Iwata A, Winn RK, Roth MB: Surviving blood loss using hydrogen sulfide. J Trauma 65: 183–188, 2008 [DOI] [PubMed] [Google Scholar]
- 28.House JD, Brosnan ME, Brosnan JT: Characterization of homocysteine metabolism in the rat kidney. Biochem J 328: 287–292, 1997 [DOI] [PMC free article] [PubMed] [Google Scholar]
- 29.Wiseman H, Halliwell B: Damage to DNA by reactive oxygen and nitrogen species: Role in inflammatory disease and progression to cancer. Biochem J 313: 17–29, 1996 [DOI] [PMC free article] [PubMed] [Google Scholar]
- 30.Cadet J, Delatour T, Douki T, Gasparutto D, Pouget JP, Ravanat JL, Sauvaigo S: Hydroxyl radicals and DNA base damage. Mutat Res 424: 9–21, 1999 [DOI] [PubMed] [Google Scholar]
- 31.Rogakou EP, Pilch DR, Orr AH, Ivanova VS, Bonner WM: DNA double-stranded breaks induce histone H2AX phosphorylation on serine 139. J Biol Chem 273: 5858–5868, 1998 [DOI] [PubMed] [Google Scholar]
- 32.Lu M, Liu Y-H, Goh HS, Wang JJX, Yong Q-C, Wang R, Bian J-S: Hydrogen sulfide inhibits plasma renin activity. J Am Soc Nephrol 21: 993–1002, 2010 [DOI] [PMC free article] [PubMed] [Google Scholar]
- 33.Whitfield NL, Kreimier EL, Verdial FC, Skovgaard N, Olson KR: Reappraisal of H2S/sulfide concentration in vertebrate blood and its potential significance in ischemic preconditioning and vascular signaling. Am J Physiol Regul Integr Comp Physiol 294: R1930–R1937, 2008 [DOI] [PubMed] [Google Scholar]
- 34.Oh G-S, Pae H-O, Lee B-S, Kim B-N, Kim J-M, Kim H-R, Jeon SB, Jeon WK, Chae H-J, Chung H-T: Hydrogen sulfide inhibits nitric oxide production and nuclear factor-kappaB via heme oxygenase-1 expression in RAW264.7 macrophages stimulated with lipopolysaccharide. Free Radic Biol Med 41: 106–119, 2006 [DOI] [PubMed] [Google Scholar]
- 35.Calvert JW, Coetzee WA, Lefer DJ: Novel insights into hydrogen sulfide—mediated cytoprotection. Antioxid Redox Signal 12: 1203–1217, 2010 [DOI] [PMC free article] [PubMed] [Google Scholar]
- 36.Fu Z, Liu X, Geng B, Fang L-P, Tang C-S: Hydrogen sulfide protects rat lung from ischemia-reperfusion injury. Life Sci 82: 1196–1202, 2008 [DOI] [PubMed] [Google Scholar]
- 37.Tyagi N, Moshal KS, Sen U, Vacek TP, Kumar M, Hughes WM, Jr, Kundu S, Tyagi SC: H2S protects against methionine-induced oxidative stress in brain endothelial cells. Antioxid Redox Signal 11: 25–33, 2009 [DOI] [PMC free article] [PubMed] [Google Scholar]
- 38.Wang Q, Liu H-R, Mu Q, Rose P, Zhu Y-Z: S-propargyl-cysteine protects both adult rat hearts and neonatal cardiomyocytes from ischemia/hypoxia injury: The contribution of the hydrogen sulfide-mediated pathway. J Cardiovasc Pharmacol 54: 139–146, 2009 [DOI] [PubMed] [Google Scholar]
- 39.Fu M, Zhang W, Wu L, Yang G, Li H, Wang R: Hydrogen sulfide (H2S) metabolism in mitochondria and its regulatory role in energy production. Proc Natl Acad Sci U S A 109: 2943–2948, 2012 [DOI] [PMC free article] [PubMed] [Google Scholar]
- 40.Fraune C, Lange S, Krebs C, Hölzel A, Baucke J, Divac N, Schwedhelm E, Streichert T, Velden J, Garrelds IM, Danser AH, Frenay AR, van Goor H, Jankowski V, Stahl R, Nguyen G, Wenzel UO: AT1 antagonism and renin inhibition in mice: Pivotal role of targeting angiotensin II in chronic kidney disease. Am J Physiol Renal Physiol 303: F1037–F1048, 2012 [DOI] [PubMed] [Google Scholar]


