Abstract
Background
Most clinical chemistry laboratories measure free thyroxine (FT4) by an analogue (direct) method. Nevertheless, the validity of analogue FT4 immunoassays has been questioned and patient’s results using this approach frequently do not fit in with the clinical presentation. Because of these problems we routinely send out all direct free T4’s that are < 2.5th percentile and many that are > 97.5th percentile for measurement by equilibrium dialysis, the gold standard method. In approximately half of these cases, the FT4 by equilibrium dialysis was normal. We developed a rapid, reliable free T4 method employing isotope dilution tandem mass spectrometry and compared our results with both the analogue (direct) free T4 and equilibrium dialysis procedures.
Methods
An API-4000 tandem mass spectrometer (Sciex, Toronto, Canada) equipped with TurboIonSpray and Agilent HPLC system was used employing isotope dilution with deuterium labeled internal standard (IS=L-thyroxine-d2). Serum was filtered through the Centrifree YM-30 ultrafiltration device by centrifugation, IS added to the ultrafiltrate, and 400 μL injected onto a C-18 column. After washing, the switch valve is activated and a methanol gradient allows for elution of both T4 and the IS into the LC/MS/MS system. Quantitation was by MRM analysis in the negative mode. Equilibrium dialysis was performed by the Nichols method and analogue free T4 results were obtained on the Dade Dimension RxL.
Results
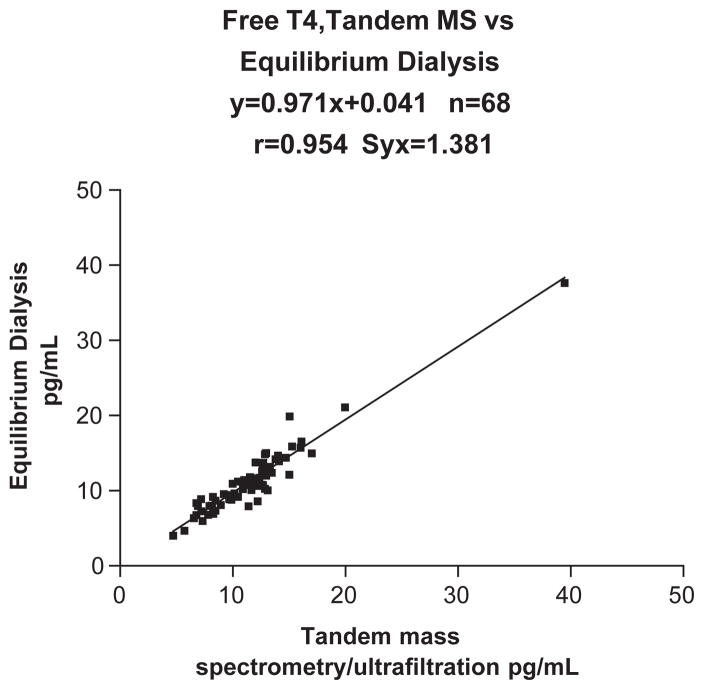
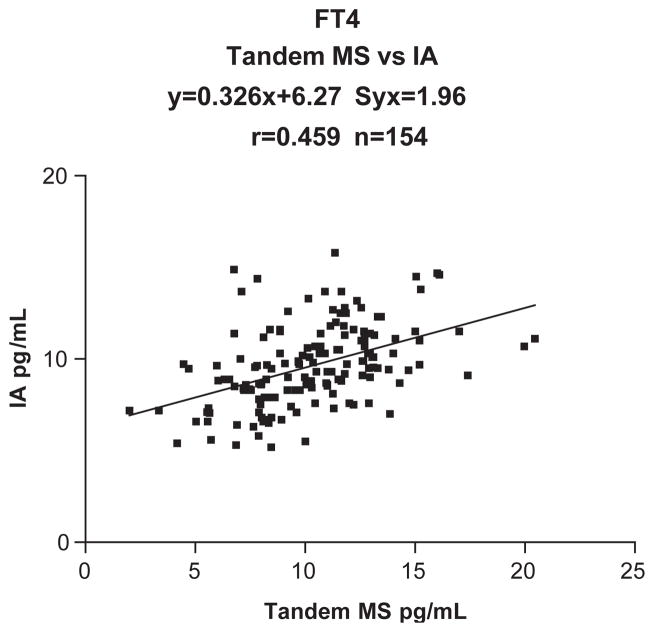
The within-day and between-day CV’s were < 7.1% at all concentrations tested. The results correlated well with equilibrium dialysis (Eq Dial=0.971 MS+0.041, n =68, Syx=1.381, r =0.954). A poor correlation was found with the analogue (direct) free T4 method (IA=0.326 MS+6.27, n =154, Syx=1.96, r =0.459).
Conclusions
Samples can be processed in batches of 30. The free T4 tandem MS method has a rapid turn-around-time vs the equilibrium dialysis procedure, with a chromatographic run time of 8 min per sample.
Keywords: Free thyroxine, Thyroxine, Thyroid hormones, Isotope dilution tandem mass spectrometry, Immunoassay
1. Introduction
Reviews of laboratory tests currently used in the diagnosis of thyroid disease have recently been published [1,2]. The two preferred laboratory tests to assess thyroid function today are free T4 and TSH. The role of mass spectrometry in the measurement of total T4 and T3 has been recently explored [3–10]. We have previously developed an isotope dilution tandem mass spectrometric method (LC/MS/MS) for the simultaneous measurement of T4 and T3 [3]. This method was subsequently used to evaluate immunoassays for total T4 and T3 [4–6]. It was clear that while immunoassays for T4 gave somewhat higher results than LC/MS/MS, they correlated fairly well with results by LC/MS/MS with the single major exception of pregnant women (r =0.802–0.900). The poorer correlation in pregnancy can be ascribed to the hormonal changes in the course of pregnancy followed by changes in binding proteins and in part to the presence of heterophilic nonspecific antibodies in this population [11–14]. The pregnant woman is carrying a “foreign body” and therefore it is not surprising that nonspecific heterophilic antibodies are produced in this population. In contrast immunoassays for T3 correlated very poorly with LC/MS/MS for all population groups (r =0.407–0.486). The situation with FT4 is more complex. Most laboratories perform FT4 testing routinely employing the analogue (direct) immunoassay approach on one of the major clinical chemistry platforms. This approach, while interesting, is certainly not universally accepted and has been the subject of criticism [15]. In our own institutions (Children’s National Medical Center and Georgetown University Hospital) there are frequent occasions when the endocrine staff question the validity of the FT4 result generated in this manner. For this reason we employ “reflex” testing for all direct FT4’s < 2.5th percentile to support or refute the diagnosis of hypothyroidism. These are sent out for FT4 measurement employing the current gold standard of equilibrium dialysis. We also routinely send samples for FT4 measurement by equilibrium dialysis when the direct FT4 is > 97.5th percentile and the TSH is normal. It has been our experience that approximately 50% of these FT4 send-outs have results within the normal range when measured by equilibrium dialysis and are therefore false positives by the direct FT4 method. Since we already have the experience of using LC/MS/MS for the measurement of total T4, our new objective was to develop a rapid, reliable FT4 method employing isotope dilution tandem mass spectrometry. We compare results obtained by this method with both the analogue (direct) FT4 and the time-consuming and expensive equilibrium dialysis procedures.
2. Methods
2.1. Chemicals and reagents
Thyroxine (T4) was from Sigma (St. Louis, MO). A stable deuterium-labeled internal standard, L-thyroxin-d2 was synthesized according to procedures previously described [10,15]. HPLC grade methanol was from VWR Scientific. All other chemicals were of analytical grade and were from Sigma.
2.2. Solutions and standards
Stock solutions of T4 and internal standard (IS) were prepared separately to obtain a concentration of 10 mg/ml for each using 40% ammonium hydroxide (v/v) in methanol as a solvent. The analyte stock solutions were diluted with methanol to obtain the spiking solutions. The solutions were stored at −20 °C and could be used for several months. Standards for the T4 calibration curve in the range of 2.5–50 pg/ml were prepared by adding the analytes to water. A solution of 0.05 ng/ml d2-T4 in methanol was used as internal standard.
2.3. Sample preparation
Serum/plasma samples were obtained from > 42 healthy pregnant and 29 healthy non-pregnant women in a study approved by the Institutional Review Board (IRB) and were thawed at room temperature. Six hundred microliters of sample were filtered through Centrifree YM-30 ultrafiltration devices (30,000 MW cut-off, Millipore, Bedford, MA) by centrifugation employing the Eppendorf temperature controlled centrifuge (model # 5702 R, Eppendorf, AG, Hamburg) and using a fixed angle rotor at 2900 rpm and a temperature of 25° for 1 h. Internal standard (180 μl, 0.05 ng/ml) was added to 360 μl ultrafiltrate and 400 μl was injected onto the C-18 column of the LC/MS/MS system. This ultrafiltration process replaces the dialysis step of the classic equilibrium dialysis method.
2.4. LC/MS/MS setup
An API 4000 tandem mass-spectrometer (SCIEX, Toronto, Canada) equipped with TurboIonSpray and Agilent 1100 HPLC system was used to perform the analysis. Negative ion multiple reaction-monitoring (MRM) mode was used. The transitions to monitor were selected and are m/z 775.9→126.9 for T4, m/z 777.9→126.9 for d2-T4. Nitrogen served as auxiliary, curtain and collision gas. Gas flow rates, source temperature, ion Spray voltages and collision energies were optimized for every compound by infusion of 1 μg/ml standards solutions in methanol at 20 μl/min and by flow-injection analysis (FIA) at LC flow rate. The main working parameters of the mass spectrometer are summarized in Table 1. Data processing was performed on Analyst 1.4.1 software package.
Table 1.
Tandem mass-spectrometer working parameters
| Parameter | Value |
|---|---|
| Curtain gas (CUR) | 14 |
| Gas 1 (nebulizer gas) | 45 |
| Gas 2 (heater gas) | 20 |
| CAD gas | 12 |
| TurboIon spray (IS) voltage | −4500 V |
| Entrance potential (EP) | −10 V |
| Collision cell exit potential (CXP) | −4 V |
| Source t | 650 °C |
| Dwell time | 250 ms |
2.5. LC/MS/MS procedure
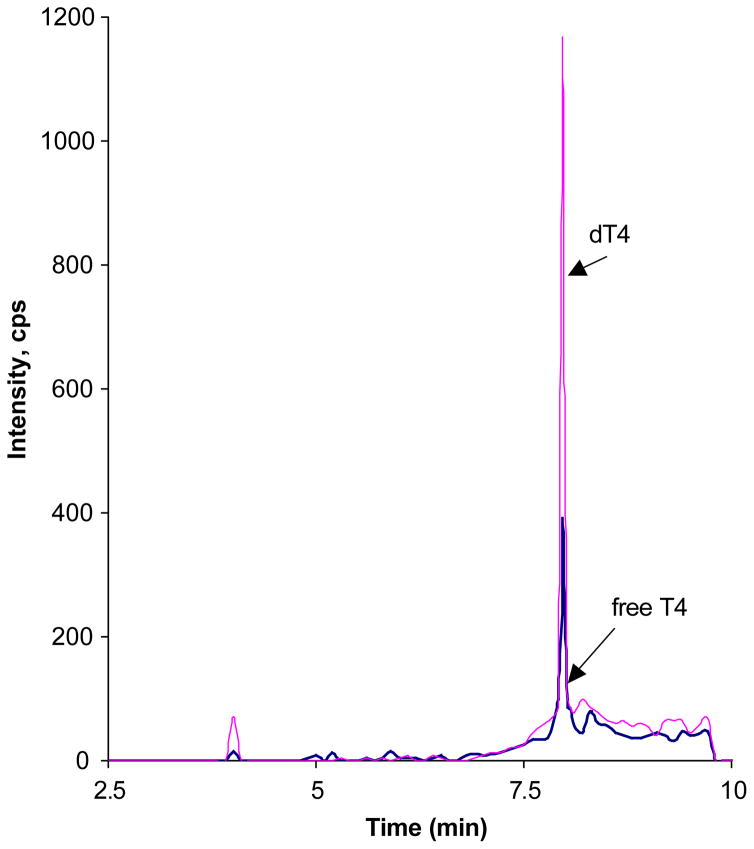
The procedure is based on an online extraction/cleaning of the injected samples with subsequent introduction into the mass-spectrometer by using a built-in Valco switching valve. Four hundred microliters of the sample were injected onto the Supelco LC-18-DB (3.3 cm × 3.0 mm, 3.0 μm ID) chromatographic column equipped with a Supelco Discovery C-18 (3.0 mm) guard column, where it underwent cleaning with 20% (v/v) methanol in 5 mmol/l ammonium acetate pH-4.0 at flow rate 0.8 ml/min. After 4 min of cleaning the switching valve was activated, the column was flushed with a water/methanol gradient at flow rate of 0.6 ml/min and the samples were introduced into the mass-spectrometer. The gradient parameters are shown in Table 2. The free T4 chromatogram is shown in Fig. 1.
Table 2.
Gradient parameters
| Time (min) | Methanol (%) |
|---|---|
| 0.0 | 10 |
| 2.5 | 20 |
| 3.5 | 20 |
| 3.6 | 95 |
| 4.5 | 99 |
| 5.9 | 100 |
Fig. 1.
This shows a typical chromatogram for free T4 (11.2 pg/ml) and deuterated internal standard.
2.6. Equilibrium dialysis
The Nichols free T4 kit (Nichols Institute Diagnostics, Catalogue # 30-0652, San Clemente, CA) was used according to the directions provided by the manufacturer. A comparison between the equilibrium dialysis and the tandem mass spectrometric method were performed on patient samples (n =68).
2.7. Analogue/direct free T4
The Dade RxL Dimension was used for the direct free T4 method.(Dade-Behring Diagnostics, Glasgow, DE). Results on patient samples were compared with values obtained using tandem mass spectrometry (n =154).
2.8. Between-day and within-day precision
The between-day and within-day precision was assessed at 3 different concentrations (Table 4).
Table 4.
Within-day and between-day precision
| Control | Within-day (n =10)
|
Between-day (n =20)
|
||
|---|---|---|---|---|
| Mean (pg/ml) | CV (%) | Mean (pg/ml) | CV (%) | |
| Low | 6.6 | 4.1 | 6.6 | 7.1 |
| Medium | 12.7 | 6.4 | 12.8 | 7.1 |
| High | 26.2 | 6.6 | 24.4 | 6.7 |
3. Results and discussion
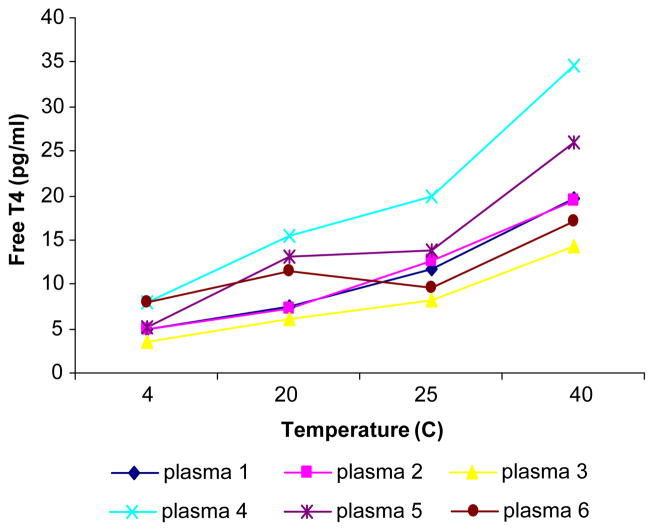
Tables 1 and 2 provide the analytical parameters employed for the tandem mass spectrometric method. Fig. 1 shows a typical chromatogram for free T4 measured by tandem mass spectrometry using the method described. The time per analysis is approximately 8.5 min although a steeper gradient could shorten this to about 6 min. The Eppendorf centrifuge allows for the centrifugation of 30 tubes simultaneously so that the total run time for 30 patient samples at the 25 °C temperature used is 1 h plus 3 h 15 min. This ultrafiltration plus LC/MS/MS assay is considerably quicker than the time consuming equilibrium dialysis method. The latter requires 16–18 h dialysis at 37 °C followed by an immunoassay and therefore turn-around-time is several days. Also, very few laboratories in North America provide the equilibrium dialysis approach. The concentration of FT4 is temperature dependent [16]. Our studies have shown that if the centrifugation of the Amicon Centrifree tubes occurs at 25 °C (Fig. 2 and Table 3) the results obtained by the tandem mass spectrometric method closely correlate with those obtained by equilibrium dialysis, which employs a temperature of 37 °C. This 12 °C temperature difference is probably the result of different membranes being employed in the equilibrium dialysis and ultrafiltration methods. The correlation between our new isotope dilution tandem mass spectrometric method and the conventional gold standard equilibrium dialysis method was excellent. Equilibrium dialysis = 0.971 Mass Spectrometry + 0.041, n = 68, Syx=1.381, r =0.954 (Fig. 3). In contrast a poor correlation was found with the analogue (direct) FT4 method (Immunoassay = 0.326 Mass Spectrometry+ 6.27, n =154, Syx=1.96, r =0.459, Fig. 4). The between-day and within-day precision shows all concentrations tested gave CVs < 7.1% (Table 4). This performance is superior to that obtained using the difficult equilibrium dialysis method. The lower limit of detection (a reading >+3S.D. over the baseline noise) was 2.5 pg/ml.
Fig. 2.
This shows the effect of temperature on free T4 by tandem mass spectrometry.
Table 3.
Effect of temperature on free T4 and on FT4/TT4 ratios
| Free T4 (pg/ml)
| ||||||
|---|---|---|---|---|---|---|
| Plasma | LC/MS/MS after ultrafiltration
|
Equilibrium dialysis | LC/MS/MS after Eq. dial | |||
| 4 °C | 20 °C | 25 °C | 40 °C | |||
| 40598 | 4.88 | 7.54 | 11.80 | 19.63 | 11.57 | 12.45 |
| O6409 | 4.85 | 7.36 | 12.67 | 19.43 | 10.77 | 12.05 |
| O9287 | 3.62 | 6.17 | 8.26 | 14.23 | 6.94 | 8.32 |
| 53230 | 8.06 | 15.53 | 19.97 | 34.57 | 21.11 | 20.80 |
| 46537 | 5.26 | 13.03 | 13.80 | 25.90 | 14.17 | 13.70 |
| 40620 | 7.87 | 11.50 | 9.69 | 17.00 | 9.42 | 10.40 |
| Free T4/Total T4*
| ||||||
|---|---|---|---|---|---|---|
| Plasma | LC/MS/MS after ultrafiltration
|
Equilibrium dialysis | LC/MS/MS after Eq. | |||
| 4 °C | 20 °C | 25 °C | 40 °C | |||
| 40598 | 0.067 | 0.104 | 0.163 | 0.271 | 0.160 | 0.172 |
| 06409 | 0.086 | 0.131 | 0.225 | 0.345 | 0.191 | 0.214 |
| 09287 | 0.074 | 0.126 | 0.169 | 0.291 | 0.142 | 0.170 |
| 53230 | 0.166 | 0.319 | 0.410 | 0.710 | 0.433 | 0.427 |
| 46537 | 0.140 | 0.347 | 0.368 | 0.690 | 0.378 | 0.365 |
| 40620 | 0.158 | 0.232 | 0.195 | 0.342 | 0.190 | 0.209 |
MS Dial-samples running on MS after dialysis.
Free T4 (pg/ml), Total T4 (ng/ml).
Fig. 3.
This shows the comparison of the tandem mass spectrometric method with the equilibrium dialysis method for the measurement of free T4.
Fig. 4.
This shows the comparison of the tandem mass spectrometric method with the direct immunoassay method on the Dade RxL Dimension for the measurement of free T4.
These studies confirm our belief that the analogue procedures give poor results for free T4 which is further supported by our in-house finding when we do reflex testing for all FT4s < 2.5th percentile and all FT4s > 97.5th percentile which also have normal TSH values. Our experience is that 50% of these free T4s run on either the Dade RxL Dimension, the Bayer Immuno 1 or the DPC Immulite give normal results when run by equilibrium dialysis. Finally in our study, 80% of FT4s > 96.7th percentile by tandem MS are associated with TSHs < 1.0 uIU/ml (the latter measured by the Dade RxL Dimension) while in the same cohort of patients we found that only 40% of FT4s > 96.7th percentile measured by direct IA had TSHs < 1.0 uIU/ml.
It should be noted that prior to using tandem mass spectrometry on the plasma ultrafiltrate we did attempt to measure FT4 on the ultrafiltrate by IA using several approaches which included an RIA kit (Nichols), the Dade RxL and DPC Immulite platforms. In all cases results were exceedingly low indicating that this was not a viable alternative.
In conclusion, we developed a new isotope dilution tandem mass spectrometric method for the measurement of FT4 employing ultrafiltration. The procedure has excellent precision, compares well with the gold standard equilibrium dialysis method, and is rapid and easy to perform. Based on these attractive characteristics we believe this method of FT4 measurement will have wide applicability in the clinical setting.
Acknowledgments
This study was partially supported by NIH GCRC grant number 5-MO1-RR-13297-S1.
References
- 1.Wu AHB. Quality specifications in thyroid disease. Clin Chim Acta. 2004;346:73– 7. doi: 10.1016/j.cccn.2004.03.020. [DOI] [PubMed] [Google Scholar]
- 2.Demers EM, Spencer CA. Laboratory support for the diagnosis and monitoring of thyroid disease. Natl Acad Clin Biochem. 2003;263:1529. doi: 10.1046/j.1365-2265.2003.01681.x. [DOI] [PubMed] [Google Scholar]
- 3.Soukhova N, Soldin OP, Soldin SJ. Isotope dilution tandem mass spectrometry for T3/T4. Clin Chim Acta. 2004;343:185–90. doi: 10.1016/j.cccn.2004.01.007. [DOI] [PMC free article] [PubMed] [Google Scholar]
- 4.Soldin OP, Hilakivi-Clarke L, Weiderpass E, Soldin SJ. Trimester-specific reference intervals for thyroxine and triio-dothyronine in pregnancy in iodine-sufficient women using isotope dilution tandem mass spectrometry and immunoassays. Clin Chim Acta. 2004;349:181– 9. doi: 10.1016/j.cccn.2004.06.021. [DOI] [PMC free article] [PubMed] [Google Scholar]
- 5.Soldin OP, Tractenberg RE, Soldin SJ. Differences between measurements of T4 and T3 in pregnant and nonpregnant women using isotope dilution tandem mass spectrometry and immunoassays: are there clinical implications? Clin Chim Acta. 2004;347:61–9. doi: 10.1016/j.cccn.2004.03.033. [Sep.] [DOI] [PMC free article] [PubMed] [Google Scholar]
- 6.Soldin OP, Tractenberg RE, Jonklaas J, Janicic N, Soldin SJ. Changes in maternal thyroid hormone, TSH and thyroglobulin concentrations during gestation: trends and associations across trimesters in iodine sufficiency. Thyroid. 2004;12:1084– 90. doi: 10.1089/thy.2004.14.1084. [DOI] [PMC free article] [PubMed] [Google Scholar]
- 7.Hantson A-L, De Meyer M, Guerit N. Simultaneous determination of endogenous and 13C-labelled thyroid hormones in plasma by stable isotope dilution mass spectrometry. J Chromatogr B. 2004;807:185– 92. doi: 10.1016/j.jchromb.2004.03.055. [DOI] [PubMed] [Google Scholar]
- 8.Holm SS, Hansen SH, Faber J, Staun-Olsen P. Reference methods for the measurement of free thyroid hormones in blood. Evaluation of potential reference methods for free thyroxine. Clin Biochem. 2004;37:85– 93. doi: 10.1016/j.clinbiochem.2003.09.009. [DOI] [PubMed] [Google Scholar]
- 9.Tai SS-C, Bunk DM, White E, Welch MJ. Development and evaluation of a reference measurement procedure for the determination of total 3,3′,5-triiodothyronine in human serum using isotope-dilution liquid chromatography-tandem mass spectrometry. Anal Chem. 2004;76:5092–6. doi: 10.1021/ac049516h. [DOI] [PubMed] [Google Scholar]
- 10.Tai SS, Sniegoski LT, Welch MJ. Candidate reference method for total thyroxine in serum: use of isotope-dilution liquid chromatography-mass spectrometry with electrospray ionization. Clin Chem. 2002;48:637–42. [PubMed] [Google Scholar]
- 11.Klee GG. Human anti-mouse antibodies. Arch Pathol Lab Med. 2000;124:921– 3. doi: 10.5858/2000-124-0921-HAMA. [DOI] [PubMed] [Google Scholar]
- 12.Boscato LM, Stuart MC. Incidence and specificity of interference in two-site immunoassays. Clin Chem. 1986;32:1491– 5. [PubMed] [Google Scholar]
- 13.Kricka LJ. Interferences in immunoassays—still a threat. Clin Chem. 2000;46:1037– 8. [PubMed] [Google Scholar]
- 14.Bjerner J, Bormer OP, Nustad K. The war on heterophilic antibody interference. Clin Chem. 2005;51:9–11. doi: 10.1373/clinchem.2004.042994. [DOI] [PubMed] [Google Scholar]
- 15.Ekins R. Validity of analogue free thyroxin immunoassays. Clin Chem. 1987;33:2137–52. [PubMed] [Google Scholar]
- 16.van der Sluijs Veer G, Vermes I, Bonte HA, Hoorn RKJ. Temperature effects on free-thyroxine measurements: analytical and clinical consequences. Clin Chem. 1992;38:1327– 31. [PubMed] [Google Scholar]


