Abstract
Objectives
The aim of this study was to determine the relative contribution of the muscle and ventilatory pumps to stroke volume in patients without a subpulmonic ventricle.
Background
In patients with Fontan circulation, it is unclear how venous return is augmented to increase stroke volume and cardiac output during exercise.
Methods
Cardiac output (acetylene rebreathing), heart rate (electrocardiography), oxygen uptake (Douglas bag technique), and ventilation were measured in 9 patients age 15.8 ± 6 years at 6.1 ± 1.8 years after Fontan operation and 8 matched controls. Data were obtained at rest, after 3 min of steady-state exercise (Ex) on a cycle ergometer at 50% of individual working capacity, during unloaded cycling at 0 W (muscle pump alone), during unloaded cycling with isocapnic hyperpnea (muscle and ventilatory pump), during Ex plus an inspiratory load of 12.8 ± 1.5 cm water, and during Ex plus an expiratory load of 12.8 ± 1.6 cm water.
Results
In Fontan patients, the largest increases in stroke volume and stroke volume index were during zero-resistance cycling. An additional increase with submaximal exercise occurred in controls only. During Ex plus expiratory load, stroke volume indexes were reduced to baseline, non-exercise levels in Fontan patients, without significant changes in controls.
Conclusions
With Fontan circulation increases in cardiac output and stroke volume during Ex were due to the muscle pump, with a small additional contribution by the ventilatory pump. An increase in intrathoracic pressure played a deleterious role in Fontan circulation by decreasing systemic venous return and stroke volume.
Keywords: cardiac output, exercise phsiology, Fontan, muscle pump, ventilator pump
During exercise, cardiac output (Qc) increases to match metabolic demand. This increase in Qc is normally accomplished by both an increase in heart rate and a balanced increase in right and left ventricular stroke volume (SV). However, the single ventricle poses challenges to this response.
The Fontan operation, performed in those with single-ventricle physiology, creates conduits so that there is total systemic venous return to the lungs via passive filling (1). The operation results in improvement in exercise tolerance (2–4), even under adverse conditions such as acute high altitude (5). However, exercise tolerance in patients with no subpulmonary ventricle is still limited compared with a normal cohort. The mechanisms that allow for an increase in Qc, particularly the increase in SV, during exercise in Fontan patients are unclear; increased left ventricular contractility, diastolic suction, and increased heart rate have been proposed (6–8). Limitations to the increase in Qc during exercise include increased pulmonary vascular resistance (8). However, treatment with selective pulmonary vasodilators has shown small and inconsistent improvements in oxygen uptake (Vo2) and the ratio of ventilation (VE) to carbon dioxide production (Vco2) (9).
The increase in SV during exercise in the normal biventricular heart is achieved through a variety of mechanisms, including the muscle and ventilatory pumps. The muscle pump is defined as the return of venous blood to the heart via skeletal muscle contraction, generating up to 90 mm Hg of pressure (10). The ventilatory pump provides an additional increase in venous return during inspiration, with increased flow predominantly through the thoracic inferior vena cava (10). Our aim was to determine the contributions to Qc during exercise in Fontan patients from these 2 systems: 1) the muscle pump; and 2) the ventilatory pump.
To investigate this question, we imposed a series of exercise and ventilatory demands using inspiratory and expiratory loading devices that have been shown to reliably result in changes in intrathoracic pressure and thus central venous pressure (11).
We hypothesized that increases in Qc and SV in Fontan patients would result from increased venous return from muscle contraction (muscle pump) and ventricular filling because of the negative intrathoracic pressure generated by inspiration (ventilatory pump).
Methods
Subjects
Nine patients with Fontan circulation who were routinely followed in the cardiology clinic at Children’s Medical Center of Dallas and clinically stable (New York Heart Association functional class I) were asked to participate in this study. Most had participated in previous research studies. Before the Fontan procedure, 8 patients had classic Glenn anastomoses to the right pulmonary artery. One had only bilateral Blalock-Taussig shunts. Fontan operations were performed in 8 patients by connecting the right atrial appendage and pulmonary artery, with the Glenn anastomosis remaining intact. The Fontan anatomy in 1 patient was a direct anastomosis of the right atrium to the pulmonary artery (Table 1). All patients had systemic left ventricles without lung pathology or fenestration.
Table 1.
Fontan Subject Detailed Characteristics
| Patient # | Age (yrs) | Sex | Years Since Surgery | Anatomy | Previous Procedures | Fontan |
|---|---|---|---|---|---|---|
| 1 | 17 | Male | 4.1 | Dextrocardia, DILV, L-TGA, ventricular inversion, PS | Classic Glenn, left BT shunt | RAA-PA connection |
| 2 | 11 | Male | 5 | Tricuspid valve atresia, ASD, VSDs | Classic Glenn | RAA-PA connection |
| 3 | 14 | Female | 3.9 | DILV | PA banding, classic Glenn | RAA-PA connection |
| 4 | 11 | Male | 8 | DILV, subpulmonic and subaortic stenosis, L-TGA | PA banding, Blalock-Hanlon, classic Glenn, subaortic stenosis resection, Damus-Kaye-Stansel | RAA-PA connection |
| 5 | 11 | Female | 5 | Tricuspid atresia, VSD | Bilateral BT shunts, classic Glenn | RAA-PA connection |
| 6 | 26 | Male | 8.9 | Tricuspid atresia | Classic Glenn | RAA-PA connection |
| 7 | 25 | Male | 5.4 | Tricuspid atresia with severe PS | Waterston, classic left BT, classic Glenn | RAA-PA connection |
| 8 | 17 | Male | 8.2 | Tricuspid atresia with ASD and VSDs | Bilateral BT shunts | Direct RA-PA connection |
| 9 | 10 | Male | 6.9 | DILV, PS, D-TGA | Right BT, classic Glenn | RAA-PA connection |
ASD = atrial septal defect; BT = Blalock-Taussig; DILV = double-inlet left ventricle; D-TGA = D-transposition of the great arteries; L-TGA = L-transposition of the great arteries; PA = pulmonary artery; PS = pulmonary stenosis; RAA = right atrial appendage; VSD = ventricular septal defect.
Eight healthy controls with normal cardiac function were matched individually by age, sex, and body surface area to the Fontan patients (Table 2).
Table 2.
Fontan and Control Subject Characteristics
| Variable | Controls | Fontan Patients |
|---|---|---|
| Mean age (yrs) | 16.3 | 15.9 |
| Male | 6 (75%) | 7 (78%) |
| Female | 2 (25%) | 2 (22%) |
| Mean height (cm) | 155 | 155 |
| Mean weight (kg) | 46.8 | 51.7 |
| Mean body surface area (m2) | 1.42 | 1.48 |
The study was approved by the institutional review board of the University of Texas Southwestern Medical Center and the Presbyterian Hospital of Dallas. Informed consent was obtained from subjects and their parents when indicated.
Study design
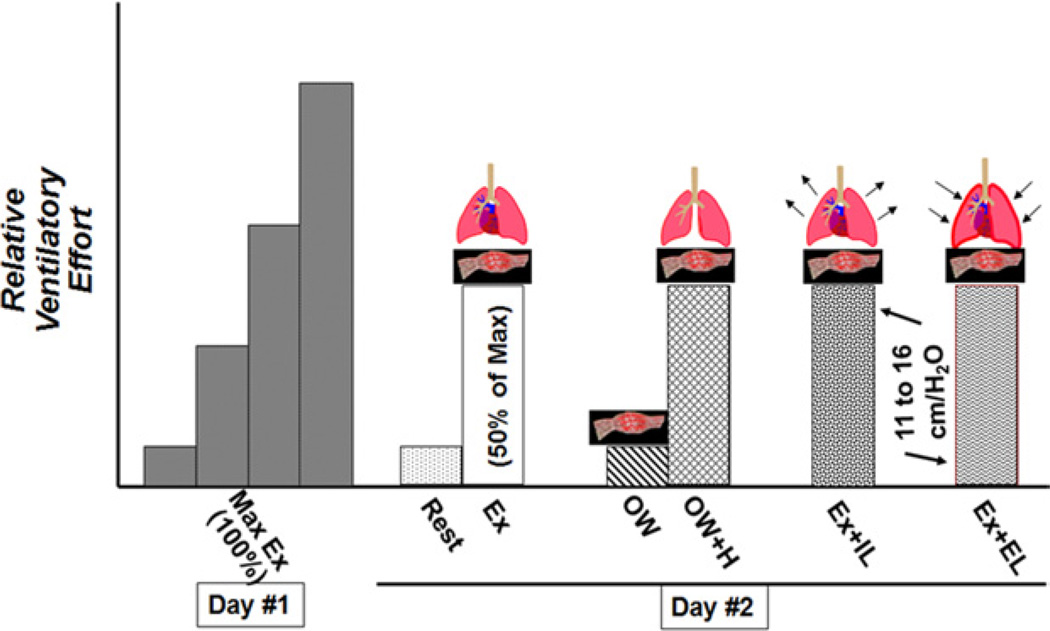
All subjects participated in a maximal exercise session and then participated in our study protocol (Fig. 1).
Figure 1. Experimental Protocol.
The experimental protocol was divided into 2 days. Day 1 consisted of a maximal exercise test. Day 2 consisted of a series of conditions separating the various components of Ex on the basis of ventilatory effort. EL = expiratory load; IL = inspiratory load; Max = maximum; 0W = zero-resistance cycling; 0W+H = zero-resistance cycling plus isocapnic hyperpnea.
Maximal exercise protocol
An incremental exercise test to exhaustion was used to identify the maximal work rate and maximal Vo2 for each subject, performed on a cycle ergometer (CPE 2000 with pediatric adaptations; Medical Graphics Corporation, St. Paul, Minnesota). Vo2 and VE were monitored continuously with a customized gas exchange system (turbine flowmeter, VMM-400 [Interface Associates, Aliso Viejo, California], and mass spectrometer).
Study exercise protocol
On a subsequent day, the same electronically braked cycle ergometer was used. After obtaining baseline data, each subject completed 5 exercise sessions. Data were obtained during upright submaximal exercise after 3 min of cycling with a 5- to 10-min rest period between each exercise condition.
The conditions were as follows: 1) steady-state exercise (Ex) on a cycle ergometer at 50% of maximal exercise capacity (Ex); 2) zero-resistance cycling (0W), to assess the muscle pump independent of significant ventilatory response; and 3) 0W plus isocapnic hyperpnea (0W+H), matching the respiratory rate and VE obtained during condition 1, to assess the ventilatory and muscle pumps independent of the metabolic demands of exercise. Then the effects of inspiratory load (IL) and expiratory load (EL) on submaximal exercise were assessed with the following conditions (order alternated): 4) Ex plus an IL (Ex+IL) of 12.8 ± 1.5 cm water, and 5) Ex plus an EL (Ex+EL) of 12.8 ± 1.6 cm water.
Measurements
Heart rate was monitored by electrocardiography (Schiller CS-100, Schiller AG, Baar, Switzerland) and blood pressure with an automated system (SunTech Medical, Research Triangle Park, North Carolina). Vo2 was measured using the standard Douglas bag technique. Expired gas fractions were measured using a mass spectrometer (Marquette Medical Systems, Milwaukee, Wisconsin) and gas volumes using a dry gas meter (Collins, Braintree, Massachusetts). After Vo2 had reached steady state on the basis of a continuous proprietary PC-based computer analysis system (usually after 2 to 3 min), a Douglas bag was collected over 1 min. Immediately afterward, the acetylene rebreathing technique was used to measure effective pulmonary blood flow (Qp) with acetylene as the soluble gas and helium as the insoluble gas (12–14). In this method, Qp is calculated from the disappearance rate of acetylene in expired air, measured with a mass spectrometer (Marquette Medical Systems), after adequate mixing in the lung has been confirmed by a stable helium concentration. This method has been validated to be a close estimate of Qc in our laboratory in normal subjects against standard invasive techniques over a range of values of Qc from 2.75 to 27.00 l/min (13,14). The inspired and expired breathing loads were created by adding a threshold load device (threshold muscle trainer; VacuMed, Ventura, California) to a custom-made breathing valve (modified 3-way balloon valve [Hans Rudolph, Inc., Shawnee, Kansas] and 1-way valve attached at the mouthpiece) in line with the system used for Qc and Vo2 measurements. The threshold load device was set at its lowest setting, which was 7 cm water. System resistance without the threshold trainer was 2 cm water at a flow rate of 2 l/s, 6 cm water at 4 l/s, and 13 cm water at 6 l/s. With the threshold load device on the inspiratory side, inspiratory resistance was 12 cm water at a flow rate of 2 l/s, 18 cm water at 4 l/s, and 31 cm water at 6 l/s. With the threshold load device on the expiratory side, expiratory resistance was 11 cm water at a flow rate of 2 l/s, 16 cm water at 4 l/s, and 25 cm water at 6 l/s. During 0W+H, VE was maintained isocapnic by flowing 3% carbon dioxide into the inspiratory circuit during voluntary hyperpnea, which was monitored by maintaining a constant partial pressure of end-tidal carbon dioxide.
Statistical analysis
Mixed modeling statistical analysis in a random-effects model and the Bonferroni post hoc test for multiple comparisons were performed to evaluate changes within and between conditions and groups. We fit a mixed model with a random component (intercept) for each patient and an unstructured component for each condition. This structure is justified via the model Akaike information criterion.
All values in tables and figures are reported as mean ± SE; p values < 0.05 were considered statistically significant. In the figures, asterisks denote when p values were <0.05 when making within-group comparisons (vs. rest), and daggers denote when p values were <0.05 between groups, within each condition. Cardiac index (CI) and SV index (SVI) were calculated from the Qc and heart rate and then divided by body surface area.
Results
Subjects
All subjects completed all of the exercise sessions in conditions 1 to 5 except for one Fontan patient who completed only 1 to 4. No exercise test was terminated by the examiner, and no adverse affects were noted during the study protocol. As expected, the Fontan patients had lower Vo2 (p = 0.03), CI (p < 0.0001), and SV (p = 0.04) with submaximal exercise.
Oxygen uptake
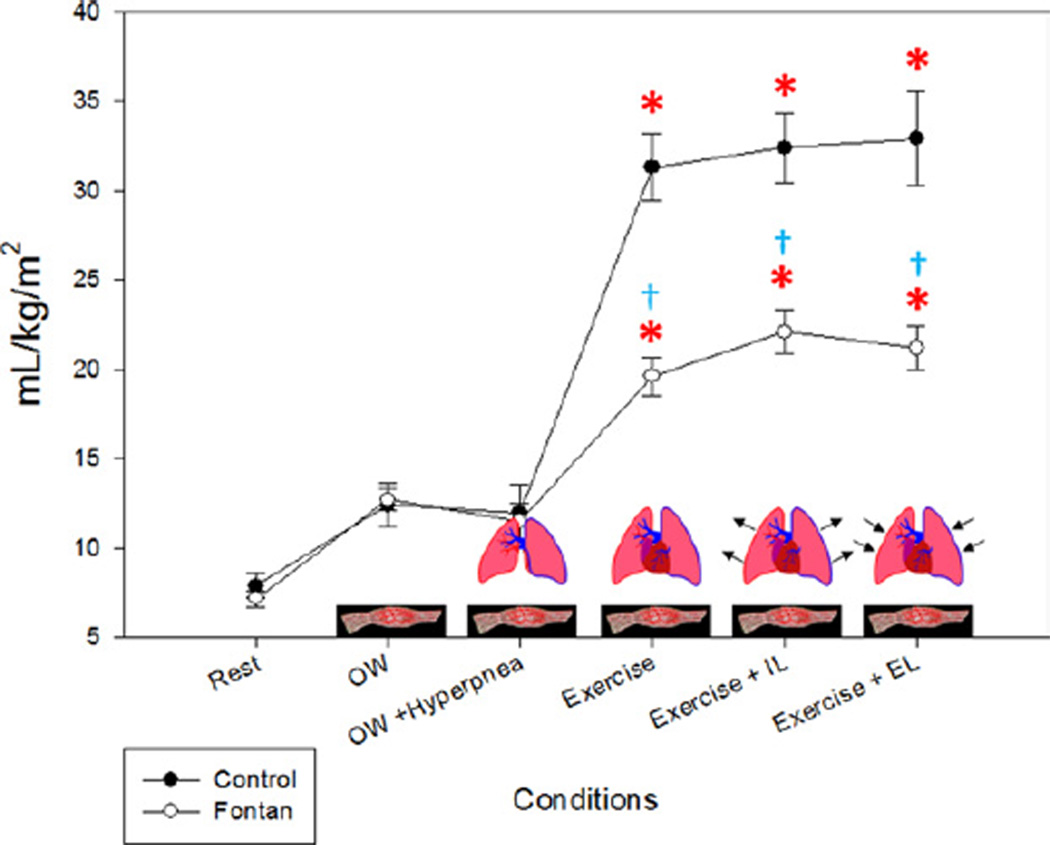
Absolute Vo2 was not different between the Fontan patients and controls during rest, 0W, or 0W+H. With submaximal exercise, the increase was >50% higher in controls than Fontan patients compared with baseline (p = 0.001 and p = 0.05) (Fig. 2). As expected, submaximal exercise Vo2 was higher in controls (p = 0.03), with no significant variability within the exercise conditions. Changes with EL were less pronounced compared with the changes seen with SV and were not statistically significant.
Figure 2. Oxygen Uptake.
The largest increase in oxygen uptake was seen with submaximal exercise. All exercise conditions were statistically different from baseline (rest). EL = expiratory load; IL = inspiratory load; 0W = zero-resistance cycling. *p < 0.05 compared with baseline (rest) within groups; †p < 0.05 between groups within condition.
Heart rate
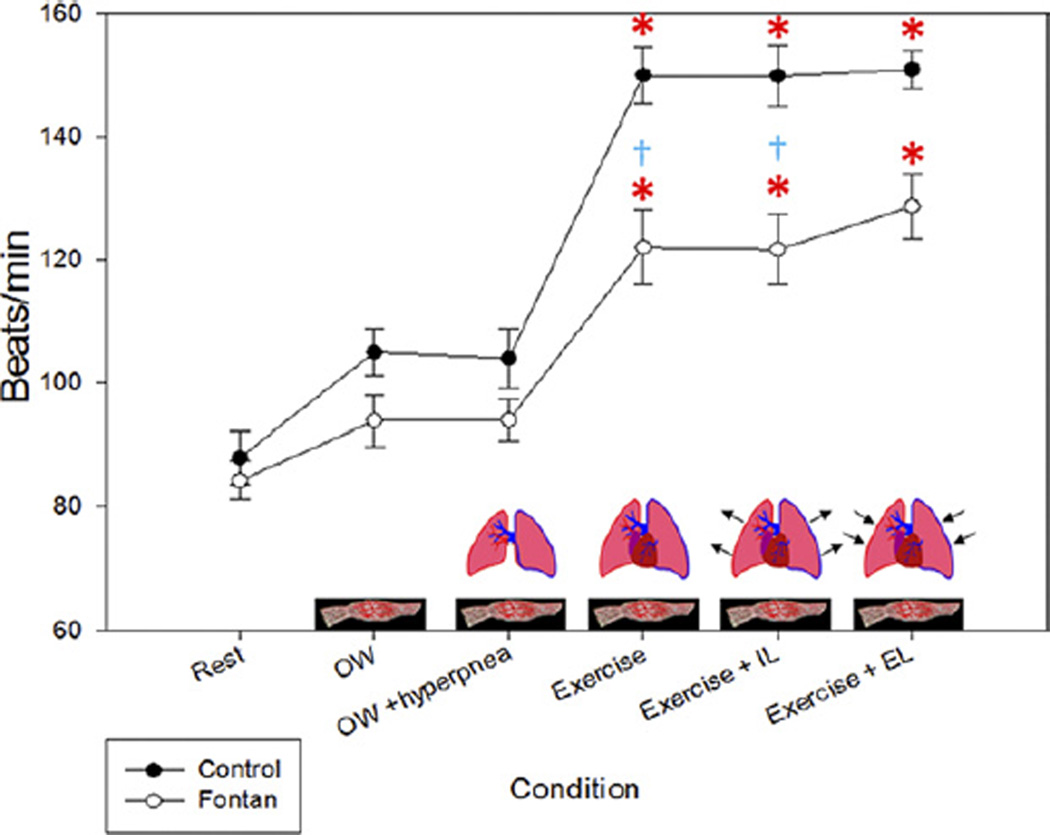
Changes in heart rate in the control subjects were similar to the changes in Vo2. However, in the Fontan patients, the increase with exercise was blunted. Heart rate increased by 70% in controls during submaximal exercise but only 45% in Fontan patients (p < 0.05) (Fig. 3). Additionally, there was an increase in heart rate in both controls and Fontan patients during Ex+EL, despite the diverging SVI.
Figure 3. Heart Rate.
The change in heart rate mimics the change seen in oxygen uptake. The heart rate change was minimal in the Fontan patients with zero-resistance cycling (0W) but increased in the controls in this condition. EL = expiratory load; IL = inspiratory load. *p < 0.05 compared with baseline (rest) within groups; †p < 0.05 between groups within condition.
Ventilatory function
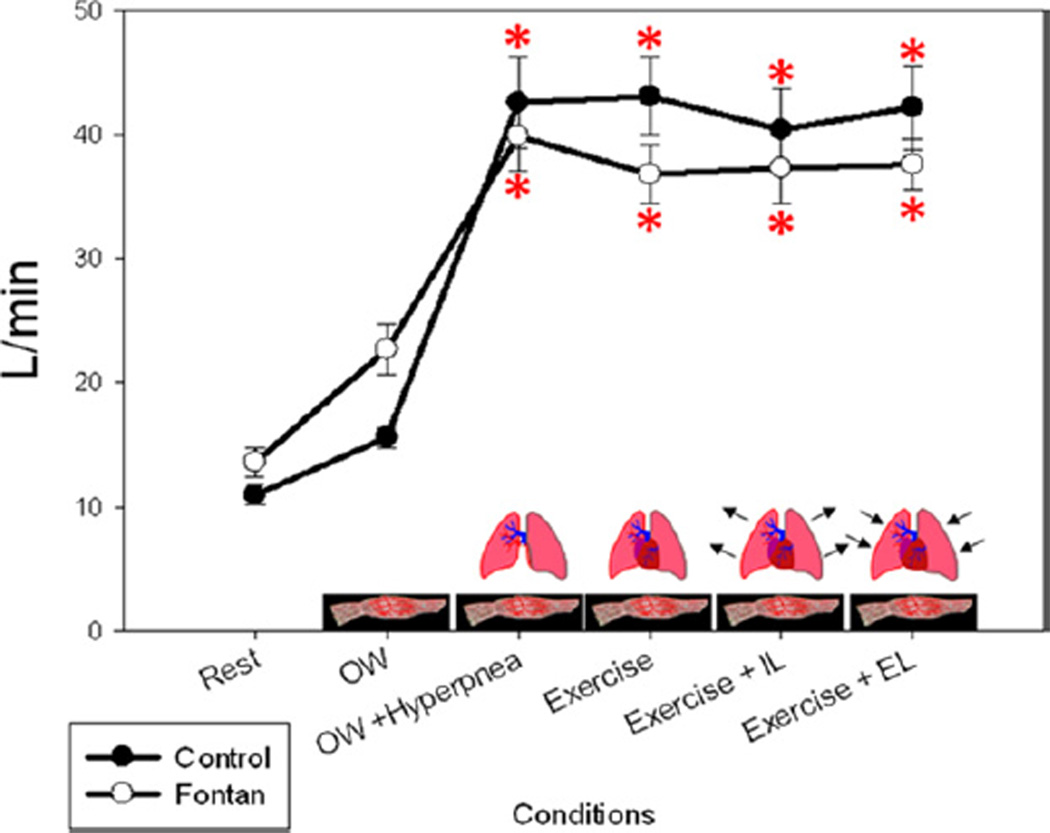
VE was significantly different when comparing the rest and 0W conditions in both groups (p < 0.05) but not significantly different between 0W+H, Ex 50%, Ex+IL, and Ex+EL for either group (p>0.50) (Fig. 4). Thus, VE was adequately matched during 0W+H and Ex 50%. VE was not affected by Ex+IL or Ex+EL in either group, although respiratory pressures were much greater during loading conditions. Although there were higher VE/Vo2 and VE/Vco2 ratios in the Fontan patients during all conditions without isocapnic hyperpnea, only the difference during Ex+EL was significant (p = 0.03). There was an increase in inspiratory time and respiratory rate when comparing both controls and Fontan patients to rest, but no significant difference within the exercise conditions was seen within or between groups.
Figure 4. Minute Ventilation.
Minute ventilation was adequately matched in the condition of zero-resistance cycling (0W) plus isocapnic hyperpnea to submaximal exercise and was relatively constant across the remaining conditions. EL = expiratory load; IL = inspiratory load. *p < 0.05 compared with baseline (rest) within groups.
Qc and CI
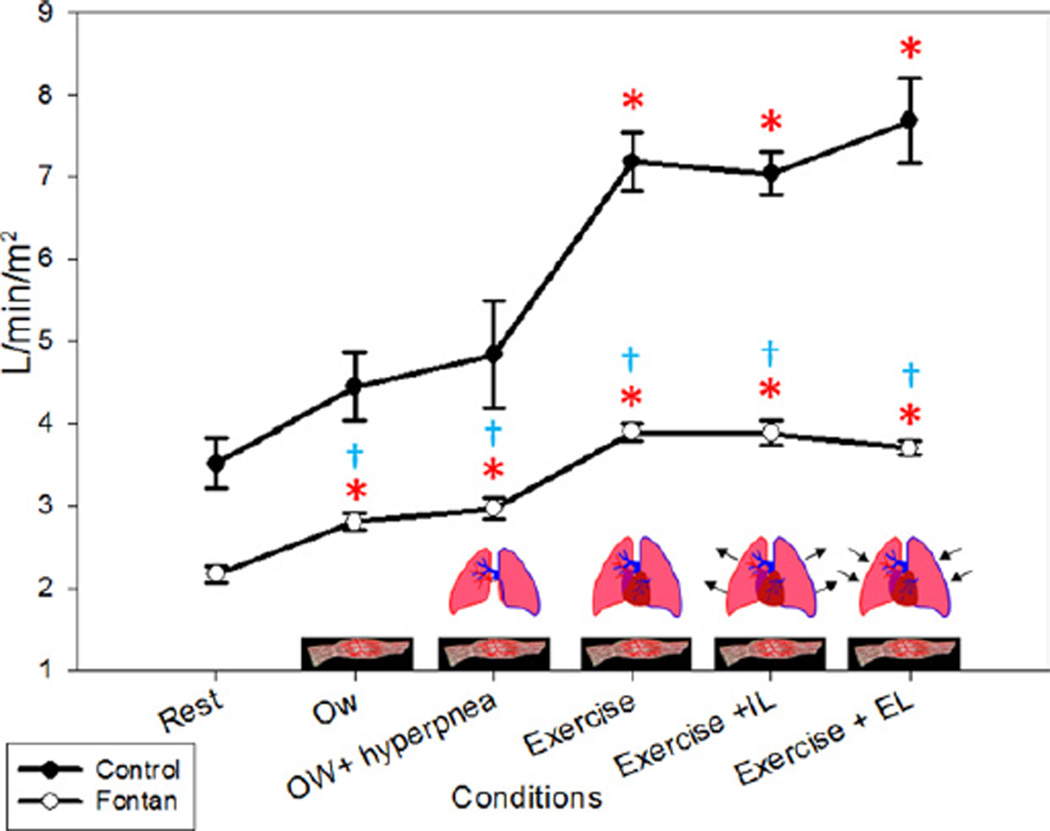
Qc and CI were significantly lower in the Fontan patients compared with the controls at rest (p < 0.05) and with submaximal exercise (p = 0.05 for Qc, p = 0.001 for CI) (Fig. 5). With the muscle pump alone (the change between rest and 0W), there was an increase in CI of 27% in the controls and 30% in Fontan patients, which was significant compared with rest (p < 0.05 for both groups). With the addition of the ventilatory pump (the change between 0W and 0W+H), we found no significant change in CI in either group (p = 1.00). We considered the difference in CI between 0W+H and submaximal exercise (Ex 50%) to indicate the increase in Qc due to a further incremental increase in muscle activity as well as an increase in metabolic demands. During Ex 50%, there was an increase in CI of 32% in controls above 0W+H (p = 0.004). In Fontan patients, the increase in CI was 23% above 0W+H but was not significant (p < 0.60). During the ventilatory loading conditions, there were slight decreases in Qc and CI in the Fontan patients and slight increases in the controls; neither was statistically significant.
Figure 5. Cardiac Index.
The largest increase in cardiac index was seen with submaximal exercise in both groups. All conditions were statistically different from baseline in the Fontan patients. EL = expiratory load; IL = inspiratory load; 0W = zero-resistance cycling. *p < 0.05 compared with baseline (rest) within groups; †p < 0.05 between groups within condition.
Stroke volume
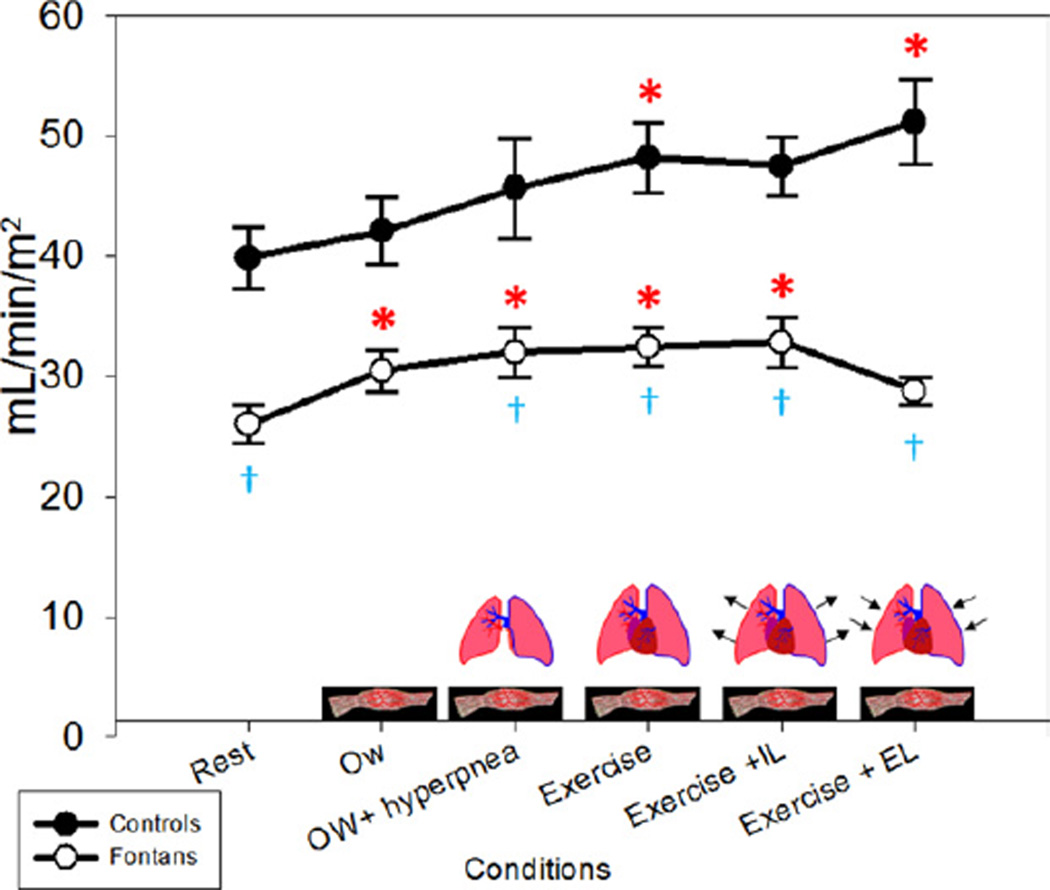
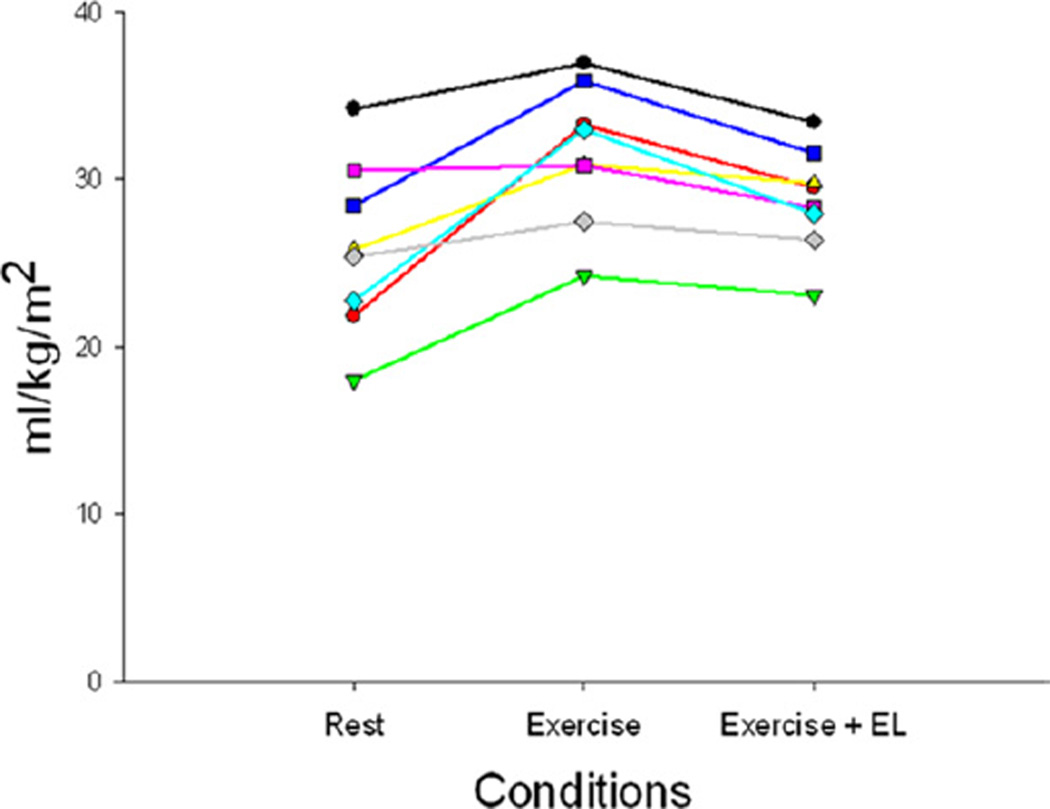
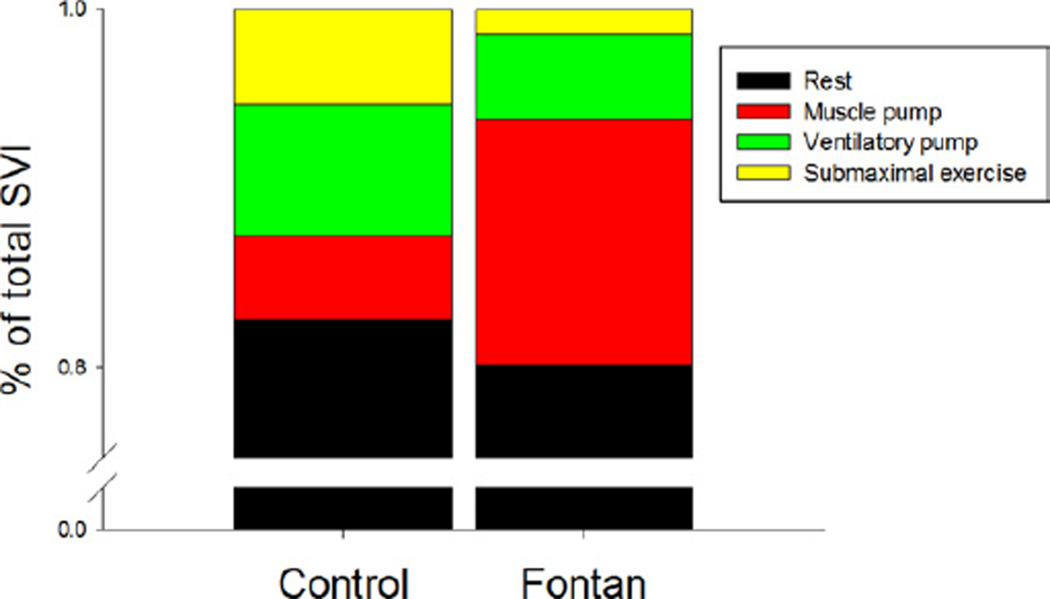
SV and SVI (Fig. 6) were significantly lower in Fontan patients compared with controls at rest (p < 0.0001). The increase in SVI with 0W from rest was minimal in control subjects (6%) compared with Fontan patients (17%) (p =0.06). The additional increase with the ventilatory pump was <10% in both groups. With submaximal exercise, there was an increase in SVI in controls of 6% but almost no change in the Fontan patients (+1%). During submaximal exercise, the change in SVI from rest was significant in both control and Fontan patients, increases of 23% and 24%, respectively (p < 0.001). There was no significant change with IL in either group. With Ex+EL, there was a slight increase in the controls but a decrease in the Fontan patients back to resting levels (p = 0.14). The effect with Ex and Ex+EL was similar in each Fontan patient studied and is shown in Figure 7. On the basis of these changes, we were able to determine the relative contributions to the total SVI in the control and Fontan patients by condition. The contributions are depicted in Figure 8.
Figure 6. SVI.
The largest increase from baseline (rest) in the Fontan patients was seen with the zero-resistance cycling (0W) (muscle pump) condition. The stroke volume index (SVI) in Fontan patients returned to near baseline values with the expiratory load (EL). IL = inspiratory load. *p < 0.05 compared with baseline (rest) within groups; �p < 0.05 between groups within condition.
Figure 7. Individual Stroke Volume Index by Condition.
The changes with exercise and with expiratory load (EL) were consistent in each individual Fontan patient.
Figure 8. SVI: Contribution in Patients on the Basis of Condition.
When taken as a percent of total increase stroke volume index (SVI), the muscle pump contributed the largest increase in the Fontan patients. The relative contributions in the control patients were similar with each condition.
Discussion
In the present study, we demonstrate that the skeletal muscle and ventilatory pumps account entirely for the increase in SV during submaximal exercise in patients with Fontan circulation. Additionally, we found that there is a decrease in SV with Ex+EL, highlighting the importance of the ventilatory pump in maintaining SV and Qc during exercise.
Fontan and Baudet (1) first described a surgical repair for certain forms of complex congenital heart disease in 1971 that created conduits to bypass the heart for systemic venous return. This surgery significantly improved mortality, with an increase in maximal Vo2 of approximately 20% to 25% (2–4). Unfortunately, these patients still remain below age-matched and sex-matched norms for maximal Vo2, with a blunted Qc response (15,16). It has been shown that the systemic ventricular function in Fontan patients is less efficient with less reserve in the setting of beta-adrenergic stimulation (6). In our study, we evaluated the mechanisms by which Qc and SV were augmented during activity in patients with only passive flow into the lungs.
The respiratory effects on the circulation at rest and with exercise have been well described in normal patients (10,17,18). In normal subjects, during inhalation and because of negative intrathoracic pressure (suction mechanism), an abrupt increase in venous return at the start of inhalation transiently enhances right ventricular filling (19). Thus, with negative intrathoracic pressure, Qc increased in normal, healthy subjects despite the increase in left ventricular afterload (20). In normal subjects, the muscle pump (during passive cycling) does not significantly alter Qc; no metabolic signal has been found between active and passive cycling (21).
In Fontan patients, vena cava flow also changes with respiration. It has been shown in echocardiographic and cardiac magnetic resonance studies that there is an increase in venous return, particularly inferior vena cava flow, with inspiration with supine rest (22–24). In addition, changes in thoracic pressure with mechanical VE can affect venous return (25,26).
In the present study, we took advantage of the unique pathophysiology associated with patients after the Fontan operation to obtain new insights into the role of the muscle and ventilatory pump during exercise. We found that the initial increase in preload due to muscle contraction and the subsequent venous return results in the largest increase in SV. This finding is supported by previous cardiac magnetic resonance studies performed on Fontan subjects during supine leg exercise (27,28). In these studies, the largest increase in flow was seen in the inferior vena cava as a result of lower extremity muscle pump function.
We did not find a significant change in SV with an increase in ventilatory rate. This may be due to a limit in the amount that the SV can increase in patients with single-ventricle physiology. Perhaps these patients operate near their maximal contractility and an increase in filling with negative intrathoracic pressure during inspiration does not result in further optimization of biomechanical coupling. This concept is further supported by the lack of improvement in SV and Qc with IL. However, given that the cardiac magnetic resonance studies did not show significant changes in flow with respiration, our findings may simply represent the minimal contribution to SV of the ventilatory pump in Fontan patients during exercise.
Respiratory loading conditions
To further assess the effects of the ventilatory system on cardiac function, we used 2 respiratory loading conditions. With the increase in intrathoracic pressure during an Ex+IL, we did not see any significant change in Qc or SV, in contrast to a previous study in post-operative mechanically ventilated patients (26). We did find a dramatic change in the Fontan patients during the Ex+EL condition, with a reduction in SVI to back to baseline, resting values despite ongoing exercise. With these data, we theorize that there is little hemodynamic reserve in Fontan patients to overcome a decrease in venous return.
From this study, we conclude that the right ventricle is not necessary to support an increase in pulmonary or systemic blood flow during submaximal exercise. The increase in SV observed during exercise results from primarily from the muscle pump, with a small contribution from the ventilatory pump.
Study limitations
The study was limited to a small number of patients, all with the left ventricle as the systemic ventricle, and most of whom had previous Glenn anastomoses. Unfortunately, none of the patients studied had the more contemporary Fontan anatomy (lateral tunnel or extracardiac Fontan circulation). As a result, there is a mechanical coupling of the Fontan and the cardiac function that is less evident in the nonfenestrated extracardiac Fontan.
A significant limitation of our study was our inability to invasively measure hemodynamic status. Although we had originally planned to do so, our study patients would not consent to invasive monitoring. As a result, we were unable to account for changes due to right-to-left shunting or intrathoracic pressures or to quantify Qc more precisely. However, given that all patients were normally saturated at baseline without evidence of cyanosis at peak exercise, we assume that the degree of shunting was minimal. The acetylene rebreathing technique (our only assessment of Qc) measures only the blood flow to the ventilated lung and relies on the assumption that the blood courses through the alveolar capillaries only once before returning to the heart. This technique has not been validated in the Fontan population. We cannot exclude small shunts that would decrease the accuracy of our Qc measurements. We propose that a right-to-left shunt would result in a falsely low Qc, as the effective Qp would be lower than the systemic Qc. Given that we are measuring changes for each individual patient, we maintain that change in Qc should still be a valid comparison. It is also a limitation in our study population that we do not have quantitation of the degree of aortopulmonary collateral vessels.
Clinical implications
First, this study allows a better understanding of the mechanism of Qc augmentation, describing the contributions from the muscle and ventilatory pumps. Additionally, the impact of the ventilatory pump is better understood to be a secondary route to increase Qc during exercise, but detrimental to the Qc when antagonized. This finding reinforces the clinical practice of using caution when opting for positive pressure VE in Fontan patients.
Conclusions
This study demonstrates that there is augmentation of CI and Vo2 with exercise in patients with Fontan circulation. This appears to be due to a combination of the muscle pump, ventilatory pump, and heart rate. Although the largest contribution of increase in SV occurs as a result of the muscle pump, antagonism of the ventilatory pump can be detrimental to overall cardiac function.
Acknowledgments
This work was supported by the cooperation between the Children’s Medical Center Foundation, the Institute of Exercise and Environmental Medicine, and Presbyterian Hospital of Dallas.
The authors would like to express their appreciation to the patients who participated in this study and to Mr. and Mrs. Swift. Without their support, it would have been difficult to complete the study. The authors also thank Susie B. McMinn and Joseph A. O’Kroy for their assistance with the study.
Abbreviations and Acronyms
- CI
cardiac index
- EL
expiratory load
- Ex
exercise
- Ex+EL
exercise plus expiratory load
- Ex+IL
exercise plus inspiratory load
- IL
inspiratory load
- Qc
cardiac output
- Qp
pulmonary blood flow
- SV
stroke volume
- SVI
stroke volume index
- Vco2
carbon dioxide production
- VE
ventilation
- Vo2
oxygen uptake
- 0W
zero-resistance cycling
- 0W+H
zero-resistance cycling plus isocapnic hyperpnea
Footnotes
The authors have reported that they have no relationships relevant to the contents of this paper to disclose.
REFERENCES
- 1.Fontan F, Baudet E. Surgical repair for tricuspid atresia. Thorax. 1971;26:240–248. doi: 10.1136/thx.26.3.240. [DOI] [PMC free article] [PubMed] [Google Scholar]
- 2.Driscoll D, Danielson G, Puga F, Schaff H, Heise C, Staats B. Exercise tolerance and cardiorespiratory response to exercise after the Fontan operation for tricuspid atresia or functional single ventricle. J Am Coll Cardiol. 1986;7:1087–1094. doi: 10.1016/s0735-1097(86)80227-3. [DOI] [PubMed] [Google Scholar]
- 3.Mair D, Puga F, Danielson G. Late functional status of survivors in the Fontan procedure performed during the 1970s. Circulation. 1992;86:106–109. [PubMed] [Google Scholar]
- 4.Zellers T, Driscoll D, Mottram C, Puga F, Schaff H, Danielson G. Exercise tolerance and cardiorespiratory response to exercise before and after the Fontan operation. Mayo Clin Proc. 1989;64:1489–1497. doi: 10.1016/s0025-6196(12)65704-8. [DOI] [PubMed] [Google Scholar]
- 5.Garcia JA, McMinn SB, Zuckerman JH, Fixler DE, Levine BD. The role of the right ventricle during hypobaric hypoxic exercise: insights from patients after the Fontan operation. Med Sci Sports Exerc. 1999;31:269–276. doi: 10.1097/00005768-199902000-00011. [DOI] [PubMed] [Google Scholar]
- 6.Senzaki H, Masutani S, Kobayashi J, et al. Ventricular afterload and ventricular work in Fontan circulation: comparison with normal two-ventricle circulation and single-ventricle circulation with Blalock-Taussig shunts. Circulation. 2002;105:2885–2892. doi: 10.1161/01.cir.0000018621.96210.72. [DOI] [PubMed] [Google Scholar]
- 7.Gerche AL, Gewillig M. What limits cardiac performance during exercise in normal subjects and in healthy Fontan patients? Int J Pediatr. 2010;2010:8. doi: 10.1155/2010/791291. [DOI] [PMC free article] [PubMed] [Google Scholar]
- 8.Gewillig M, Brown S, Eyskens B, et al. The Fontan circulation: who controls cardiac output? Interact Cardiovasc Thorac Surg. 2010;10:428–433. doi: 10.1510/icvts.2009.218594. [DOI] [PubMed] [Google Scholar]
- 9.Giardini A, Balducci A, Specchia S, Gargiulo G, Bonvicini M, Picchio F. Effect of sildenafil on haemodynamic response to exercise and exercise capacity in Fontan patients. Eur Heart J. 2008;29:1681–1697. doi: 10.1093/eurheartj/ehn215. [DOI] [PubMed] [Google Scholar]
- 10.Rowell LB. Human Circulation: Reguation During Physical Stress. New York: Oxford University Press; 1986. [Google Scholar]
- 11.Olgiati R, Atchou G, Cerretelli P. Hemodynamic effects of resistive breathing. J Appl Physiol. 1986;60:846–853. doi: 10.1152/jappl.1986.60.3.846. [DOI] [PubMed] [Google Scholar]
- 12.Triebwasser J, Johnson R, Burpo R, Campbell J, Reardon W, Blomqvist C. Noninvasive determination of cardiac output by a modified acetylene rebreathing procedure utilizing mass spectrometer measurements. Aviat Space Environ Med. 1977;48:203–209. [PubMed] [Google Scholar]
- 13.Agostoni P, Cattadori G, Apostolo A, et al. Noninvasive measurement of cardiac output during exercise by inert gas rebreathing technique: a new tool for heart failure evaluation. J Am Coll Cardiol. 2005;46:1779–1781. doi: 10.1016/j.jacc.2005.08.005. [DOI] [PubMed] [Google Scholar]
- 14.Jarvis S, Levine BD, Prisk G, et al. Simultaneous determination of the accuracy and precision of closed-circuit cardiac output rebreathing techniques. J Appl Physiol. 2007;103:867–874. doi: 10.1152/japplphysiol.01106.2006. [DOI] [PubMed] [Google Scholar]
- 15.Gewillig M, Lundstömm U, Bull C, Wyse R, Deanfield J. Exercise responses in patients with congenital heart disease after Fontan repair: patterns and determinants of performance. J Am Coll Cardiol. 1990;15:1424–1432. doi: 10.1016/s0735-1097(10)80034-8. [DOI] [PubMed] [Google Scholar]
- 16.Nir A, Driscoll D, Mottram C, et al. Cardiorespiratory response to exercise after the Fontan operation: a serial study. J Am Coll Cardiol. 1993;22:216–220. doi: 10.1016/0735-1097(93)90837-q. [DOI] [PubMed] [Google Scholar]
- 17.Baker W, Harris V, Kirkes W. Handbook of Physiology. 11th ed. New York: William Wood & Company; 1885. [Google Scholar]
- 18.Sparks HV, Rooke TW. Essentials of Cardiovascular Physiology. Minneapolis: University of Minnesota Press; 1987. [Google Scholar]
- 19.Fessler H, Brower R, Wise R, Permutt S. Effects of systolic and diastolic positive pleural pressure pulses with altered cardiac contractility. J Appl Physiol. 1992;73:498–505. doi: 10.1152/jappl.1992.73.2.498. [DOI] [PubMed] [Google Scholar]
- 20.Bjustedt H, Rosenhamer G, Hesser C, Lindborg B. Responses to continuous negative-pressure breathing in man at rest and during exercise. J Appl Physiol. 1980;48:977–981. doi: 10.1152/jappl.1980.48.6.977. [DOI] [PubMed] [Google Scholar]
- 21.No�brega A, Williamson J, Friedman D, Araújo C, Mitchell J. Cardiovascular responses to active and passive cycling movements. Med Sci Sports Exerc. 1994;26:709–714. doi: 10.1249/00005768-199406000-00009. [DOI] [PubMed] [Google Scholar]
- 22.Fogel M, Weinberg P, Hoydu A, et al. The nature of flow in the systemic venous pathway measure by magnetic resonance blood tagging in patients having the Fontan operation. J Thorac Cardiovasc Surg. 1997;114:1032–1041. doi: 10.1016/S0022-5223(97)70017-5. [DOI] [PubMed] [Google Scholar]
- 23.Penny D, Redington A. Doppler echocardiographic evaluation of pulmonary blood flow after the Fontan operation: the role of the lungs. Br Heart J. 1991;66:372–374. doi: 10.1136/hrt.66.5.372. [DOI] [PMC free article] [PubMed] [Google Scholar]
- 24.Hsia T, Khambadkone S, Redington A, Migliavacca F, Deanfield J, Leval MD. Effects of respiration and gravity on infradiphragmatic venous flow in normal and Fontan patients. Circulation. 2000;102:III-148–III-153. doi: 10.1161/01.cir.102.suppl_3.iii-148. [DOI] [PubMed] [Google Scholar]
- 25.Penny D, Hayek Z, Redington A. The effects of positive and negative extrathoracic pressure ventilation on pulmonary blood flow after the total cavopulmonary shunt procedure. Int J Cardiol. 1991;30:128–131. doi: 10.1016/0167-5273(91)90137-e. [DOI] [PubMed] [Google Scholar]
- 26.Deshpande S, Kirshborn P, Maher K. Negative pressure ventilation as a therapy for post-operative complications in a patient with single ventricle physiology. Heart Lung Circulation. 2011;20:763–765. doi: 10.1016/j.hlc.2011.03.010. [DOI] [PubMed] [Google Scholar]
- 27.Pedersen E, Stenbøg E, Fründ T, et al. Flow during exercise in the total cavopulmonary connection measured by magnetic resonance velocity mapping. Heart. 2002;87:5554–5558. doi: 10.1136/heart.87.6.554. [DOI] [PMC free article] [PubMed] [Google Scholar]
- 28.Hjortdal V, Emmertsen K, Stenbøg E, et al. Effects of exercise and respiration on blood flow in total cavopulmonary connection. A real-time magnetic resonance flow study. Circulation. 2003;108:1227–1231. doi: 10.1161/01.CIR.0000087406.27922.6B. [DOI] [PubMed] [Google Scholar]


