

Abstract
Neurotoxic regimens of methamphetamine (METH) result in reactive microglia and astrocytes in striatum. Prior data indicate that rats with partial dopamine (DA) loss resulting from prior exposure to METH are resistant to further decreases in striatal DA when re-exposed to METH 30 days later. Such resistant animals also do not show an activated microglia phenotype, suggesting a relation between microglial activation and METH-induced neurotoxicity. To date, the astrocyte response in such resistance has not been examined. Thus, this study examined glial-fibrillary acidic protein (GFAP) and CD11b protein expression in striata of animals administered saline or a neurotoxic regimen of METH on postnatal days 60 and/or 90 (Saline:Saline, Saline:METH, METH:Saline, METH:METH). Consistent with previous work, animals experiencing acute toxicity (Saline:METH) showed both activated microglia and astocytes, whereas those resistant to the acute toxicity (METH:METH) did not show activated microglia. Interestingly, GFAP expression remained elevated in rats exposed to METH at PND60 (METH:Saline), and was not elevated further in resistant rats treated for the second time with METH (METH:METH). These data suggest that astrocytes remain reactive up to 30 days post-METH exposure. Additionally, these data indicate that astrocyte reactivity does not reflect acute, METH-induced DA terminal toxicity, whereas microglial reactivity does.
Keywords: astrocyte, microglia, methamphetamine, toxicity, dopamine
Introduction
Methamphetamine (METH) is a highly abused psychostimulant, and repeated high-dose administration of METH results in persistent damage to the dopamine (DA) system. This damage consists of decreased dopamine (DA) tissue concentrations (Kogan et al. 1976, Wagner et al. 1980), DA transporter (DAT)(Fleckenstein et al. 1997, McCann et al. 1998) and vesicular monoamine transporter-2 levels (Guilarte et al. 2003), and tyrosine hydroxylase activity (Kogan et al. 1976) in striatum.
Several studies have documented a robust activation of both astrocytes (O’Callaghan & Miller 1994, Cappon et al. 1997, Guilarte et al. 2003, Bowyer et al. 1994) and microglia (LaVoie et al. 2004, Guilarte et al. 2003, Thomas et al. 2004) following exposure of rodents to a neurotoxic regimen of METH. However, these studies examined astrocyte and microglia activation in response to a single neurotoxic regimen of METH. Human METH abusers administer multiple doses of METH. Thus, to more accurately model the repeated binge administration observed in humans, our lab and others (Hanson et al. 2009, Thomas & Kuhn 2005) have conducted studies in which animals are treated with a neurotoxic regimen of METH and challenged 7 or 30 days later with a second neurotoxic regimen of METH. These studies have revealed that such animals are resistant to acute DA neuron toxicity upon exposure to the second METH regimen. This experimental paradigm thus allows for the examination of factors associated with METH toxicity in animals matched for acute METH exposure, but differentiated with respect to acute METH-induced DA terminal degeneration. Prior work with this model has reported that animals that are resistant to the acute METH-induced neurotoxicity also do not demonstrate significant microglial activation following the second exposure as do animals experiencing acute toxicity (Thomas & Kuhn 2005), suggesting a possible role of microglial activation in METH-induced DA toxicity. The extent to which resistance to subsequent METH-induced neurotoxicity is also associated with decreased astrocyte reactivity is currently unknown. Therefore, the purpose of the present study was to examine both microglia and astrocyte reactivity, using CD11b and glial fibrillary acidic protein (GFAP) expression respectively, in animals rendered resistant to the acute DA toxicity induced by METH.
Methods
Animals
Male Sprague-Dawley rats (Charles River Laboratories, Raleigh, NC) were housed in wire mesh cages in a temperature-controlled room on a 12:12-hr light:dark cycle with free access to food and water. All animal care and experimental procedures were in accordance with both the ARRIVE guidelines and the Guide for the Care and Use of Laboratory Animals (8th Ed., National Research Council) and were approved by the Institutional Animal Care and Use Committee at the University of Utah.
METH administration
Due to tissue availability, one cohort of animals was used to examine GFAP expression and another cohort of animals was used to examine CD11b expression. METH and saline injections were conducted as previously described (Friend et al. 2013). Briefly, on treatment days (postnatal day (PND)60 and PND90), rats (5–8 per treatment group) were housed in groups of 6 in plastic tub cages (33 cm × 28 cm × 17 cm) with corncob bedding. Animals received injections of (±)-METH-HCl (10 mg free base/kg, s.c.; kindly provided by the National Institute on Drug Abuse) or 0.9% saline (1 ml/kg, s.c.) at 2-hr intervals resulting in a total of four injections. Rectal temperatures were monitored using a digital thermometer (BAT-12, Physitemp Instruments, Clifton, NJ) to ensure the presence of METH-induced hyperthermia. Baseline temperatures for each animal were taken 30 min prior to the first injection and 1 hr after each subsequent injection. If the body temperature of an animal exceeded 40.5°C, the animal was cooled by transferring it to a cage placed over wet ice until the body temperature fell below 39°C. Approximately 18 hours after the last injection on PND60, animals were returned to wire mesh cages in the colony room and allowed to recover for 30 days. On PND90, animals were again transferred to plastic tub cages and treated with either METH or saline as described above. This treatment regimen resulted in four treatment groups: Saline:Saline, Saline:METH, METH:Saline, and METH:METH based on treatments on PND60:PND90.
Tissue preparation
Animals were sacrificed 48 hr after the last injection on PND90 via exposure to CO2 for 1 min. Following decapitation, brains were rapidly removed and submerged in 4% paraformaldehyde with 0.9% NaCl for 24 hr at 4°C, then cryoprotected in 30% sucrose in 0.1M phosphate buffered saline (PBS) and stored at 4°C. The brains were then sectioned at 30 μm on a freezing microtome (Microm, HM 440E). For each animal, four coronal sections of striatum (+ 1.6 mm to +0.2 mm relative to bregma) were sectioned and stored at 4°C in 1mg/ml sodium azide in 0.1M PBS.
Immunohistochemistry
DAT immunohistochemistry was performed to evaluate METH-induced DA depletions. Briefly, sections were subject to heat-mediated antigen retrieval in 10mM citrate buffer containing 0.5% Tween-20 (pH 6.0) for 20 min at 98°F. After cooling at room temperature, sections were washed in 0.1M PBS, incubated for 10 min in 0.1M PBS containing 3% H2O2, and washed again in 0.1M PBS. Nonspecific antibody binding was blocked by incubating tissue in 0.1M PBS containing 5% milk and 0.2% Triton X-100 for 60 min. Tissue was then incubated overnight at 4°C in a primary antibody solution containing 0.1 M PBS, 2% milk, 0.2% Triton X-100, and rat anti-DAT antibody (Millipore, MAB369, 1:5000). The following day, tissue was washed in 0.1M PBS, incubated in a secondary antibody solution containing 0.1M PBS, 2% non-fat dry milk, 0.2% Triton X-100 and biotinylated goat anti-rat IgG (Vector Labs, BA-4000, 1:200). Finally, tissue was incubated in avidin-biotinylated peroxidase complex solution (ABC Elite Kit, Vector Labs, PK-6100) for 30 min and the reaction terminated by washing in 0.1M PBS. The tissue sections were then incubated in nickel-enhanced diaminobenzidine tetrahydrochloride (Ni-DAB; Vector, SK-4100) for 3–5 min, washed again in 0.1M PBS, mounted onto slides, dried, dehydrated and coverslipped with VectaMount (Vector Labs, H-5000).
For GFAP and CD11b immunohistochemistry, sections were washed in 0.1M PBS, and nonspecific antibody binding was prevented by incubating tissue for 2 hr at room temperature in a blocking solution containing 10% goat serum and 0.3% Triton X-100 in 0.1M PBS. Sections were then incubated in a primary antibody solution containing 10% goat serum, 0.3% Triton X-100, and either mouse anti-GFAP antibody conjugated to Alexa Fluor 488 (Millipore, MAB3402X, 1:1000) or mouse anti-CD11b (Abcam, AB1211, 1:50) overnight at 4°C. The following day, sections labeled for GFAP were washed in 0.1M PBS, mounted on slides, and coverslipped using Pronglong Gold® with DAPI (Invitrogen, 1034067). For CD11b immunohistochemistry, sections were also washed in 0.1M PBS and then incubated for 2 hrs at room temperature with a goat anti-mouse secondary antibody conjugated to Alexa Fluor 488 (Invitrogen, A11029, 1:1000). Sections were then washed in 0.1M PBS, mounted on slides, and coverslipped using Pronglong Gold® with DAPI.
Image acquisition and analysis
Image analyses were completed by an experimenter blinded to treatment conditions. For DAT immunohistochemistry, images were digitized and densitometric analysis was performed using the NIH ImageJ software (http://imagej.nih.gov/ij/), yielding background-subtracted, average gray values in both DM and DL striatum. Two rostral (+ 1.6 mm bregma) and two middle (+0.2 mm bregma) striatal sections per rat were analyzed and averaged. Average gray values were then compared across treatment groups. For GFAP and CD11b immunohistochemistry, 3×3 (0.63 mm2) montages in both DL and DM striatum were captured at 40X (Leica DM 4000B; 488-nm filter cube). Using NIH ImageJ software, images were thesholded to include cell bodies and processes of GFAP- or CD11b-positive cells. The percent area of the field with GFAP or CD11b signal was recorded, averaged for each animal, and compared across treatment groups. The use of this approach for quantifying astrocyte and microglia reactivity has previous been established as a reliable method for determining changes in astrocyte and microglia reactivity (LaVoie et al. 2004).
Statistical Analysis
Statistical analysis was performed using a two-factor ANOVA (PND60 treatment x PND90 treatment) followed by post hoc analysis via a Student’s t or Tukey’s HSD test, as appropriate. Statistical analysis on body temperatures was conducted using a MANOVA with repeated measures (PND60 treatment x PND90 treatment x Time) followed a t-test post hoc analysis at individual time points to determine main effects of treatments.
Results
Experiment 1
METH-induced hyperthermia in animals sacrificed to examine GFAP expression
For body temperature data collected during treatment of this cohort of animals on PND60 (Figure 1A), MANOVA revealed main effects of PND60 treatment (F(1,24)= 210.08, p<0.0001) and time (F(4,24)= 21.36, p<0.0001) and a significant PND60 treatment x time interaction (F(1,24) = 27.84, p<0.0001). Post hoc analysis revealed that the temperatures of animals receiving METH on PND60 were not different from controls at baseline (0 min, t=0.00, p=1.0), but were significantly greater than those receiving saline at all four time points after the injections of METH began (60 min, t=14.76, p<0.0001; 180 min, t=16.40, p<0.0001; 300 min, t=11.23, p<0.0001; 420 min, t=10.45, p<0.0001). For body temperature data collected during treatment of this cohort of animals on PND90 (Figure 1B), MANOVA revealed main effects of PND90 treatment (F(1,24)= 208.36, p<0.0001) and time (F(4,24)= 54.79, p<0.0001) and a significant PND90 treatment x time interaction (F(1,24)= 44.73, p<0.0001). Post hoc analysis of the PND90 treatment x time interaction again revealed that temperatures of animals acutely receiving METH (i.e. PND 90 treatment) were not different from controls at baseline (t=−0.86, p=0.40), but were significantly higher than those of controls at all time points after the administration of METH began (Figure 1B; 60 min, t=12.91, p<0.0001; 180 min, t=13.08, p<0.0001; 300 min, t=10.61, p<0.0001; 420 min, t=11.46, p<0.0001). Importantly, there was no significant PND60 treatment x PND 90 treatment (F(1,24)=0.35, p=0.74) or PND60 treatment x PND90 treatment x time (F(4,21)=1.87, p=0.15) interactions.
Figure 1.

Body temperatures (mean±SEM; n=5–8) of animals that received systemic injections of saline (4 × 1 mL/kg, s.c. at 2-hr intervals) or (±)-METH (4 × 10 mg/kg, s.c. at 2-hr intervals). Treatment group designations indicate PND60 treatment:PND90 treatment, resulting in the four treatment groups: Saline:Saline (SS); METH:Saline (MS); Saline:METH (SM); and METH:METH (MM). Temperatures were obtained 30 min prior to the first injection (baseline; BL) and 1 hr after each subsequent injection. X-axis values represent minutes after the first injection and arrows represent the time of each saline or METH injection. Temperatures of animals sacrificed 48 hr after the last injection on PND90 were recorded during treatment for experiment 1 on PND60 (A) or PND90 (B) and experiment 2 on PND60 (C) and PND90 (D). * p<0.005 and **p<0.01 Significant effect of METH at this time point.
METH-induced DA depletions
METH-treated rats showed significant decreases in DAT immunohistochemical staining compared to saline-treated controls (Table 1). Two-factor ANOVAs for the DL and DM striatum revealed significant PND60 treatment x PND90 treatment interactions (DL striatum: F(1,24)=29.32, p<0.0001; DM striatum: F(1,24)=27.80, p<0.0001). Post hoc analysis of the interaction revealed that groups of animals treated with the neurotoxic regimen of METH at PND60, PND90, or at both time points (PNS60 and PND90) were significantly different from the Saline:Saline group (Tukey’s HSD test, p values <0.002; Table 1). Furthermore, DAT staining in the Saline:METH group was significantly less than that in the METH:Saline and METH:METH groups (p values < 0.01), which were not different from each other (p=0.89). Thus, as previously shown, rats receiving a second neurotoxic regimen of METH were resistant to further acute neurotoxicity.
Table 1.
Striatal DAT immunohistocheistry following single or repeated exposure to a neurotoxic regimen of METH
| Experiment 1 | Experiment 2 | |||
|---|---|---|---|---|
| DL | DM | DL | DM | |
| Saline:Saline | 100 ± 0.73 | 100 ± 0.90 | 100 ± 2.18 | 100 ± 1.77 |
| METH:Saline | 72.56 ± 3.57* | 62.63 ± 3.45* | 65.65 ± 2.68* | 65.50 ± 6.59* |
| Saline:METH | 50.40 ± 3.48*^+ | 41.71 ± 4.45*^+ | 28.94 ± 0.95*^+ | 22.76 ± 1.42*^+ |
| METH:METH | 68.46 ± 4.38* | 59.78 ± 5.90* | 52.56 ± 3.38*^ | 46.42 ± 3.56*^ |
Data are mean gray values (±SEM; n=5–8) from densitometric analyses expressed as a percent of the respective Saline:Saline group. Treatment group designations indicate PND60 treatment: PND90 treatment, resulting in four treatment groups: Saline:Saline; METH:Saline; Saline:METH and METH:METH.
indicates (p<0.01) treatment group is significantly different from Saline:Saline.
indicates (p<0.01) that treatment groups is significantly different from METH:Saline.
indicates (p<0.01) treatment group is significantly different from METH:METH.
Effect of METH on astrocyte reactivity
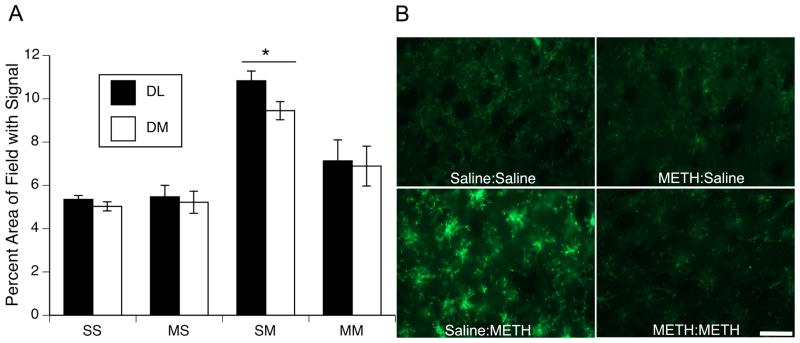
Rats treated with METH showed significant increases in GFAP immunohistocemical staining compared to saline-treated controls (Figure 2). Two-factor ANOVAs on data for the DL and DM striatum revealed main effects of PND60 treatment (DL striatum: F(1,27)=4.80, p<0.05; DM striatum: F(1,27)=6.83, p<0.05) and PND90 treatment (DL striatum: F(1,27)=9.83, p<0.01; DM striatum: F(1,27)=32.19, p<0.0001), as well as significant PND60 treatment X PND90 treatment interactions (DL striatum: F(1,108)=6.48, p<0.02; DM striatum: F(1,108)=5.11, p<0.05). Post hoc analysis of the significant interactions revealed that all treatment groups, including those that had received the neurotoxic regimen of METH 32 days prior to sacrifice (i.e. METH:Saline group), showed significantly greater levels of GFAP immunohistochemical staining than did the Saline:Saline controls (Tukey’s HSD test, p values <0.05); however, these groups that had received METH (METH:Saline, Saline:METH, METH:METH) were not significantly different (p values >0.05) from each other with respect to GFAP staining.
Figure 2.

(A) Quantitative analysis of the effects of single or repeated METH administration on GFAP expression in striata of animals sacrificed 48 hr after the last injection on PND90. Data are mean percent area of the total image field with GFAP signal above threshold (± SEM, n=5–8) in dorsolateral (DL; black bars) and dorsomedial (DM; white bars) striatum. Treatment group designations indicate PND60 treatment:PND90 treatment, resulting in the four treatment groups: Saline:Saline (SS); METH:Saline (MS); Saline:METH (SM); and METH:METH (MM). * All groups significantly different from SS group, p<0.05. (B) Representative images of GFAP immunohistochemical staining 48 hr after the last injection on PND90. Scale bar= 50μm.
Experiment 2
METH-induced hyperthermia in rats sacrificed to examine CD11b expression
For body temperature data collected during treatment of this cohort of animals on PND60 (Figure 1C), MANOVA revealed a main effect of PND60 treatment (F(1,24)= 183.33, p <0.0001) and time (F(4,21)= 51.99, p <0.0001) and a significant PND60 treatment x time interaction (F(1,21) = 31.85, p <0.0001). Post hoc analysis of the interaction revealed that the baseline temperatures of rats treated with saline on PND60 were slightly, but significantly (t=−2.7, p<0.05), lower than the temperatures of rats in the METH group. However, the temperatures of animals receiving METH were significantly greater than those of animals receiving saline at all four time points after the injections of METH began (Figure 1C; 60 min, t=−16.70, p<0.0001; 180 min, t=−14.83, p<0.0001; 300 min, t=−10.39, p<0.0001; 420 min, t=−7.93, p<0.0001). For body temperature data collected during treatment of this cohort of animals on PND90 (Figure 1D), MANOVA revealed main effects of PND90 treatment (F(1,24)= 195.07, p<0.0001) and time (F (4,24)= 35.73, p<0.0001) and a significant PND90 treatment x time interaction (F(1,24)= 59.30, p<0.0001). Post hoc analysis of the significant interaction revealed that the temperatures of animals receiving METH were significantly greater than those of controls at all four time points after the injections of METH began (Figure 1D; 60 min, t=−10.82, p<0.0001; 180 min, t=−16.89, p<0.0001; 300 min, t=−9.37, p<0.0001; 420 min, t=−9.14, p<0.0001). Importantly, there was no significant PND60 treatment x PND 90 treatment interaction F(1,24)=1.7, p=0.21 or PND60 treatment x PND90 treatment x time interactions (F(4,21)=1.32, p=0.29).
METH-induced DA depletions
As in Experiment 1, administration of METH to this cohort of animals resulted in significant decreases in DAT immunohistochemical staining when compared to that in saline-treated controls (Table 1). Two-factor ANOVAs for DL and DM striatum revealed main effects of PND90 treatment (DL striatum: F(1,24)=254.58, p<0.0001; DM striatum: F(1,24)=191.10, p<0.0001) and significant PND60 treatment X PND90 treatment interactions (DL striatum: F(1,24)=101.31, p<0.0001; DM striatum: F(1,24)=70.35, p<0.0001). Post hoc analyses of the interactions revealed that all treatment groups were significantly different from all other treatment groups (Tukey’s HSD test, p values <0.005; Table 1).
Effect of METH on mircoglia reactivity
Administration of a neurotoxic regimen of METH on PND90 resulted in a significant increase in immunohistochemical staining for CD11b expression only in animals acutely experiencing toxicity (i.e. Saline:METH group; Figure 3). Two-factor ANOVAs for the DL and DM striatum revealed main effects of PND60 treatment (DL striatum: F(1,24)=5.90, p<0.05; DM striatum: F(1,24)=3.02, p=0.095), main effects of PND90 treatment (DL striatum: F(1,24)=23.48, p<0.0001; DM striatum: F(1,24)=19.24, p<0.0002), and significant PND60 treatment X PND90 treatment interactions (DL striatum: F(1,24)=6.76, p<0.02; DM striatum: F(1,24)=4.37, p<0.05). Post hoc analyses of the interactions revealed that CD11b immunohistochemical staining in the Saline:METH group was significantly greater than that in all other treatment groups (Tukey’s HSD test, p values <0.03; Figure 4). Conversely, staining was not different between any of the other three groups (i.e. Saline:Saline, METH:Saline, and METH:METH); p values >0.2).
Figure 3.
(A) Quantitative analysis of the effects of single or repeated METH exposure on CD11b expression in striata of animals sacrificed 48hr after the last injection on PND90. Data are mean percent area of the total image field with CD11b signal above threshold (± SEM, n=5–8) in dorsolateral (DL; black bars) and dorsomedial (DM; white bars) striatum. Treatment group designations indicate PND60 treatment:PND90 treatment, resulting in the four treatment groups: Saline:Saline (SS); METH:Saline (MS); Saline:METH (SM); and METH:METH (MM). * SM group significantly different from all other groups, p<0.05. (B) Representative images of CD11b immunohistochemical staining 48 hr after the last injection on PND90. Scale bar= 50μm.
Discussion
METH abuse continues to be a significant public health concern, and recent studies report increased incidence of Parkinson’s Disease among individuals with a history of amphetamine use (Callaghan et al. 2010, Callaghan et al. 2012). Although it is established that METH exposure results in damage to the DA system, the cascade of events that ultimately results in DA terminal degeneration is not as well understood. Studies using animal models of METH-induced neurotoxicity show robust activation of both astrocytes and microglia (O’Callaghan & Miller 1994, LaVoie et al. 2004, Bowyer et al. 1994, Thomas et al. 2004, Guilarte et al. 2003), and recent work demonstrates reactive microglia (Kitamura et al. 2010, Sekine et al. 2008) and increased density of GFAP-positive astrocytes (Kitamura et al. 2010) in brains of human METH abusers. In addition, there is a growing amount of evidence indicating that amphetamine abuse has a high rate of comorbidity among individuals infected with human immunodeficiency virus (HIV) (Harris et al. 1993, Crofts et al. 1994). Given data suggesting combined effects of HIV and METH, including increased HIV viral load (Ellis et al. 2003), synergistic damage to the DA system (Maragos et al. 2002), altered glial response (Kaul & Lipton 1999, Zhao et al. 2001) and increased cytokine production (Shah et al. 2012a, Shah et al. 2012b), studies investigating the role of glial cells in METH-induced neurotoxicity are essential to identifying factors contributing to or mitigating METH-induced damage to DA nerve terminals.
Using an established model (Hanson et al. 2009, Thomas & Kuhn 2005) of resistance to acute METH-induced DA terminal injury, the present study examined the extent to which animals rendered resistant to further DA depletions are also resistant to astrocyte and microglia reactivity following the second neurotoxic regimen of METH. Consistent with previous work, we demonstrate that exposure to a neurotoxic regimen of METH results in significant astrocyte activation as assessed 48 hr after the last injection (i.e. in the Saline:METH group). However, we extend these previous findings by showing that GFAP expression remains elevated compared to controls even 32 days after exposure to a neurotoxic regimen of METH (i.e. in the METH:Saline group). Furthermore, the present findings reveal that the degree of GFAP expression is similar in animals exposed to METH and experiencing acute toxicity (Saline:METH) and those exposed to METH but not experiencing acute toxicity (METH:METH). Also consistent with prior work (Thomas and Kuhn 2005), the present data confirm that activation of microglia mirrors acute DA neuron toxicity, as only animals experiencing acute DA neuron toxicity (i.e. the Saline:METH group) show an increase in CD11b immunohistochemical staining. Thus, these data support the conclusion that activation of microglia, rather than astrocytes, is associated with the acute toxic effects of METH on DA nerve terminals, although we can not rule out a potential role of persistent astrocyte activation in resistance to acute METH-induced DA terminal toxicity.
Astrocytes have been shown to play important roles in normal brain function, such as neurotransmission and synaptic function, but have also been implicated in several central nervous system (CNS) diseases. GFAP immunohistochemistry is commonly used to assess astrocyte reactivity (Sofroniew & Vinters 2010) and is increased following various CNS pathologies (Zhang et al. 1999, Borges et al. 2003, Hozumi et al. 1990). Herein, we examined GFAP expression in animals that received single or repeated administration of a neurotoxic regimen of METH. In saline-treated control animals (Saline:Saline), GFAP expression is minimally expressed in striatum. Conversely, in animals treated with METH (METH:Saline, Saline:METH, and METH:METH), GFAP expression is much more dispersed throughout the entire striatum. In these groups, GFAP expression was much more intense and astrocytes took on a more reactive phenotype with thicker processes. To our knowledge, this is the first study to show that GFAP expression remains elevated in METH-exposed rats as far out as 32 days post-treatment. However, these data are consistent with previous work showing elevated GFAP expression in METH-exposed mice 21 days post treatment (O’Callaghan & Miller 1994) and in primates 30 days post-METH exposure (Harvey et al. 2000). It is important to note however, that in the study examining GFAP expression in mice 21 days following METH exposure (O’Callaghan & Miller 1994), GFAP expression was elevated compared to controls at 21 days, but the expression was decreased compared to GFAP levels in animals 2 days after exposure to METH. In the current work, we did not find significant differences in GFAP expression in animals treated with METH 32 days prior and those treated 2 days prior. However, in our work and the work of O’Callaghan and colleagues, the GFAP expression remains elevated for extended periods of time (O’Callaghan & Miller 1994).
It is presently unclear whether persistent astrocytosis in animals previously exposed to a neurotoxic regimen of METH may play a role in the resistance to further DA depletions seen in these animals. For example, astrocytes are key regulators of extracellular glutamate (GLU) via GLU transporters (Anderson & Swanson 2000). Given significant implication of GLU in METH-induced neurotoxicity (Nash & Yamamoto 1992, Gross et al. 2011, Mark et al. 2004, Sonsalla et al. 1989, O’Dell et al. 1992, Halpin & Yamamoto 2012, Shah et al. 2012b), it is tempting to speculate that changes in transporter expression or activity associated with increased GFAP expression following the first neurotoxic regimen of METH (PND60) may allow for more efficient astrocyte-mediated GLU buffering during the second METH administration (PND90). Astrocytes are also known to be involved in blood brain barrier (BBB) function (Abbott et al. 2006), and changes in BBB during and following METH exposure have been documented (Sharma & Kiyatkin 2009, Bowyer & Ali 2006, Ramirez et al. 2009). Therefore changes in astrocyte reactivity following the initial exposure to METH (PND60) could result in changes in the BBB function, resulting in protection against toxicity when animals are exposed again at PND90. Other possible areas of investigation related to astrocyte activity include protection against oxidative stress via glutathione production (Shih et al. 2003, Chen et al. 2001), protection against ammonia toxicity (Halpin & Yamamoto 2012), and regulation of inflammatory responses (Min et al. 2006, Okada et al. 2006, Shah et al. 2012b). Whether such enhanced functions of astrocytes underlie resistance to METH-induced DA terminal remains to be examined.
In the present studies, elevated GFAP expression was noted in animals exposed to the neurotoxic regimen of METH but not experiencing acute toxicity (i.e. the METH:METH group), suggesting a dissociation between reactive astrogliosis and METH-induced neurotoxicity. However, it remains possible that astrocytes are necessary for acute METH-induced neurotoxicity. The elevated GFAP expression in the METH:METH group likely reflects the persistent GFAP expression arising from the first exposure to the neurotoxic regimen on PND60, as is apparent in the METH:Saline group. In the METH:METH group, there is a lack of further acute activation of astrocytes in response to the second METH regimen on PND90 and a lack of further acute DA neurotoxicity. Thus, the apparent lack of further astrocyte activation and the lack of further toxicity may be linked. Our current understanding of the conditions under which astrocytes become activated, the nature of that activation, and the extent to which they provide detrimental vs. beneficial effects in the setting of CNS injury is in its infancy (Sofroniew 2009). Thus, although all of the METH-treated groups show similar levels of GFAP expression, it is thus possible that there are differences in the functions of seemingly similar “reactive” astrocytes under different METH-exposure conditions and that these differences in function are not reflected in differences in GFAP expression (Sofroniew 2009). It is also possible that the immunhistochemical detection of GFAP used herein may not be sensitive to subtle differences in GFAP expression, as prior work by O’Callaghan and Miller (O’Callaghan & Miller 1994) in mice have suggested some recovery of GFAP expression as assessed by an enzyme-linked immunosorbent assay three weeks after exposure to a similar neurotoxic regimen, whereas such recovery is not apparent in the present work. Prior studies of neurotoxicity associated with a single bolus injection of METH in mice show that minocycline pretreatment prevents the activation of microglia, but does not protect against toxicity or increases in GFAP expression (Sriram et al. 2006), suggesting an association between reactive astrocytosis, but not reactive microglia, and METH-induced neurotoxicity. However, that prior study was conducted using a single bolus regimen of METH, and other data suggest notable differences in the nature of the neurotoxicity resulting from a single bolus versus a neurotoxic binge regimen of METH (Zhu et al. 2006). Clearly, additional studies are necessary to discern the role of astrocytes in the persistent monoamine neurotoxicity induced by METH and to further define the phenotype of astrocytes under different METH-exposure conditions.
Microglia are the primary antigen-presenting cells in the CNS and also become highly reactive following various CNS insults. Microglia have been shown to migrate to sites of injury and to secrete proinflammatory cytokines, as well as a variety of other factors (Hanisch 2002). Reactive microglia have been observed in the brains of both animals (LaVoie et al. 2004, Guilarte et al. 2003, Thomas et al. 2004) exposed to METH and in the brains of human METH abusers (Sekine et al. 2008, Kitamura et al. 2010). Interestingly, Thomas and colleagues have shown that when animals are pretreated with a neurotoxic regimen of METH, allowed to recover for 7 days, and treated with a subsequent neurotoxic regimen of METH, they no longer demonstrate significant microglial activation. Similarly, here we show that when the recovery period between METH treatments is extended to 30 days, animals still remain resistant to acute DA-terminal injury and activation of microglia. Activated microglia are often characterized as having retracted, thickened processes with increased cell body size, whereas their “resting” counterparts demonstrate finely branched processes and ramified morphology and small cell body (Kreutzberg 1996). In control animals and those exposed to METH only at PND60 (METH:Saline), the resting microglia morphology was observed. Similarly, the majority of striatal sections from animals resistant to further toxicity also exhibited resting microglia morphology, as reflected in CD11b immunohistochemistry. Conversely, animals exposed to METH on PND90 and experiencing acute toxicity (Saline:METH) exhibited significant thickening of branches and more intense microglia cell-body staining. These data are consistent with the findings of Thomas and colleagues (Thomas & Kuhn 2005) and suggest that microglia reactivity remains a specific marker for acute damage to DA terminals following a neurotoxic regimen of METH. However whether microglial activation contributes to or simply mirrors METH-induced neurotoxicity remains unknown.
Clearly more direct experiments using pharmacological and genetic manipulations of astrocyte and microglia activation are needed to determine the role of these two cell types in METH-induced DA terminal degeneration. Studies investigating the molecular triggers for the activation of astrocytes and microglia following methamphetamine exposure will lead to a better understanding of the cascade of events that ultimately results in changes in these cells. Finally, more specific markers for the different stages of activation of both astrocytes and microglia are needed to further tease apart the differences in degree of activation and activity of these two cell types following METH exposure.
Acknowledgments
This work was supported by the National Institute of Drug Abuse [Grant DA 013367]
The authors wish to thank Dr. Steve O’Dell in Dr. John Marshall’s laboratory for assistance with the DAT immunohistochemistry assay
Abbreviations
- BBB
Blood brain barrier
- CNS
central nervous system
- DA
dopamine
- DAT
dopamine transporter
- GLU
glutamate
- METH
methamphetamine
- PBS
phosphate buffered saline
- PND
post-natal day
Footnotes
The authors declare no conflicts of interest
Authorship credit
Contribution to design and interpretation of data: Friend, Keefe
Data acquisition and analysis: Friend, Keefe
Drafting article and revising: Friend, Keefe
Final approval of the version to be published: Friend, Keefe
Requested Reviewers:
James P. O’Callaghan: Centers for Disease Control and Prevention, jdo5@cdc.gov
Teresa G. Hastings: University of Pittsburgh, hastingst@upmc.edu
Donald M. Kuhn: Wayne State University, aa3071@wayne.edu
References
- Abbott NJ, Ronnback L, Hansson E. Astrocyte-endothelial interactions at the blood-brain barrier. Nature reviews. Neuroscience. 2006;7:41–53. doi: 10.1038/nrn1824. [DOI] [PubMed] [Google Scholar]
- Anderson CM, Swanson RA. Astrocyte glutamate transport: review of properties, regulation, and physiological functions. Glia. 2000;32:1–14. [PubMed] [Google Scholar]
- Borges K, Gearing M, McDermott DL, Smith AB, Almonte AG, Wainer BH, Dingledine R. Neuronal and glial pathological changes during epileptogenesis in the mouse pilocarpine model. Experimental neurology. 2003;182:21–34. doi: 10.1016/s0014-4886(03)00086-4. [DOI] [PubMed] [Google Scholar]
- Bowyer JF, Ali S. High doses of methamphetamine that cause disruption of the blood-brain barrier in limbic regions produce extensive neuronal degeneration in mouse hippocampus. Synapse. 2006;60:521–532. doi: 10.1002/syn.20324. [DOI] [PubMed] [Google Scholar]
- Bowyer JF, Davies DL, Schmued L, Broening HW, Newport GD, Slikker W, Jr, Holson RR. Further studies of the role of hyperthermia in methamphetamine neurotoxicity. The Journal of pharmacology and experimental therapeutics. 1994;268:1571–1580. [PubMed] [Google Scholar]
- Callaghan RC, Cunningham JK, Sajeev G, Kish SJ. Incidence of Parkinson’s disease among hospital patients with methamphetamine-use disorders. Movement disorders: official journal of the Movement Disorder Society. 2010;25:2333–2339. doi: 10.1002/mds.23263. [DOI] [PubMed] [Google Scholar]
- Callaghan RC, Cunningham JK, Sykes J, Kish SJ. Increased risk of Parkinson’s disease in individuals hospitalized with conditions related to the use of methamphetamine or other amphetamine-type drugs. Drug and alcohol dependence. 2012;120:35–40. doi: 10.1016/j.drugalcdep.2011.06.013. [DOI] [PubMed] [Google Scholar]
- Cappon GD, Morford LL, Vorhees CV. Ontogeny of methamphetamine-induced neurotoxicity and associated hyperthermic response. Brain research Developmental brain research. 1997;103:155–162. doi: 10.1016/s0165-3806(97)81791-9. [DOI] [PubMed] [Google Scholar]
- Chen Y, Vartiainen NE, Ying W, Chan PH, Koistinaho J, Swanson RA. Astrocytes protect neurons from nitric oxide toxicity by a glutathione-dependent mechanism. Journal of neurochemistry. 2001;77:1601–1610. doi: 10.1046/j.1471-4159.2001.00374.x. [DOI] [PubMed] [Google Scholar]
- Crofts N, Hopper JL, Milner R, Breschkin AM, Bowden DS, Locarnini SA. Blood-borne virus infections among Australian injecting drug users: implications for spread of HIV. European journal of epidemiology. 1994;10:687–694. doi: 10.1007/BF01719282. [DOI] [PubMed] [Google Scholar]
- Ellis RJ, Childers ME, Cherner M, Lazzaretto D, Letendre S, Grant I, Group HIVNRC. Increased human immunodeficiency virus loads in active methamphetamine users are explained by reduced effectiveness of antiretroviral therapy. The Journal of infectious diseases. 2003;188:1820–1826. doi: 10.1086/379894. [DOI] [PubMed] [Google Scholar]
- Fleckenstein AE, Metzger RR, Wilkins DG, Gibb JW, Hanson GR. Rapid and reversible effects of methamphetamine on dopamine transporters. The Journal of pharmacology and experimental therapeutics. 1997;282:834–838. [PubMed] [Google Scholar]
- Friend DM, Son JH, Keefe KA, Fricks-Gleason AN. Expression and activity of nitric oxide synthase isoforms in methamphetamine-induced striatal dopamine toxicity. The Journal of pharmacology and experimental therapeutics. 2013;344:511–521. doi: 10.1124/jpet.112.199745. [DOI] [PMC free article] [PubMed] [Google Scholar]
- Gross NB, Duncker PC, Marshall JF. Cortical ionotropic glutamate receptor antagonism protects against methamphetamine-induced striatal neurotoxicity. Neuroscience. 2011;199:272–283. doi: 10.1016/j.neuroscience.2011.09.014. [DOI] [PMC free article] [PubMed] [Google Scholar]
- Guilarte TR, Nihei MK, McGlothan JL, Howard AS. Methamphetamine-induced deficits of brain monoaminergic neuronal markers: distal axotomy or neuronal plasticity. Neuroscience. 2003;122:499–513. doi: 10.1016/s0306-4522(03)00476-7. [DOI] [PubMed] [Google Scholar]
- Halpin LE, Yamamoto BK. Peripheral ammonia as a mediator of methamphetamine neurotoxicity. The Journal of neuroscience: the official journal of the Society for Neuroscience. 2012;32:13155–13163. doi: 10.1523/JNEUROSCI.2530-12.2012. [DOI] [PMC free article] [PubMed] [Google Scholar]
- Hanisch UK. Microglia as a source and target of cytokines. Glia. 2002;40:140–155. doi: 10.1002/glia.10161. [DOI] [PubMed] [Google Scholar]
- Hanson JE, Birdsall E, Seferian KS, Crosby MA, Keefe KA, Gibb JW, Hanson GR, Fleckenstein AE. Methamphetamine-induced dopaminergic deficits and refractoriness to subsequent treatment. European journal of pharmacology. 2009;607:68–73. doi: 10.1016/j.ejphar.2009.01.037. [DOI] [PMC free article] [PubMed] [Google Scholar]
- Harris NV, Thiede H, McGough JP, Gordon D. Risk factors for HIV infection among injection drug users: results of blinded surveys in drug treatment centers, King County, Washington 1988–1991. Journal of acquired immune deficiency syndromes. 1993;6:1275–1282. [PubMed] [Google Scholar]
- Harvey DC, Lacan G, Tanious SP, Melega WP. Recovery from methamphetamine induced long-term nigrostriatal dopaminergic deficits without substantia nigra cell loss. Brain research. 2000;871:259–270. doi: 10.1016/s0006-8993(00)02439-2. [DOI] [PubMed] [Google Scholar]
- Hozumi I, Aquino DA, Norton WT. GFAP mRNA levels following stab wounds in rat brain. Brain research. 1990;534:291–294. doi: 10.1016/0006-8993(90)90142-x. [DOI] [PubMed] [Google Scholar]
- Kaul M, Lipton SA. Chemokines and activated macrophages in HIV gp120-induced neuronal apoptosis. Proceedings of the National Academy of Sciences of the United States of America. 1999;96:8212–8216. doi: 10.1073/pnas.96.14.8212. [DOI] [PMC free article] [PubMed] [Google Scholar]
- Kitamura O, Takeichi T, Wang EL, Tokunaga I, Ishigami A, Kubo S. Microglial and astrocytic changes in the striatum of methamphetamine abusers. Legal medicine. 2010;12:57–62. doi: 10.1016/j.legalmed.2009.11.001. [DOI] [PubMed] [Google Scholar]
- Kogan FJ, Nichols WK, Gibb JW. Influence of methamphetamine on nigral and striatal tyrosine hydroxylase activity and on striatal dopamine levels. European journal of pharmacology. 1976;36:363–371. doi: 10.1016/0014-2999(76)90090-x. [DOI] [PubMed] [Google Scholar]
- Kreutzberg GW. Microglia: a sensor for pathological events in the CNS. Trends in neurosciences. 1996;19:312–318. doi: 10.1016/0166-2236(96)10049-7. [DOI] [PubMed] [Google Scholar]
- LaVoie MJ, Card JP, Hastings TG. Microglial activation precedes dopamine terminal pathology in methamphetamine-induced neurotoxicity. Experimental neurology. 2004;187:47–57. doi: 10.1016/j.expneurol.2004.01.010. [DOI] [PubMed] [Google Scholar]
- Maragos WF, Young KL, Turchan JT, Guseva M, Pauly JR, Nath A, Cass WA. Human immunodeficiency virus-1 Tat protein and methamphetamine interact synergistically to impair striatal dopaminergic function. Journal of neurochemistry. 2002;83:955–963. doi: 10.1046/j.1471-4159.2002.01212.x. [DOI] [PubMed] [Google Scholar]
- Mark KA, Soghomonian JJ, Yamamoto BK. High-dose methamphetamine acutely activates the striatonigral pathway to increase striatal glutamate and mediate long-term dopamine toxicity. The Journal of neuroscience: the official journal of the Society for Neuroscience. 2004;24:11449–11456. doi: 10.1523/JNEUROSCI.3597-04.2004. [DOI] [PMC free article] [PubMed] [Google Scholar]
- McCann UD, Wong DF, Yokoi F, Villemagne V, Dannals RF, Ricaurte GA. Reduced striatal dopamine transporter density in abstinent methamphetamine and methcathinone users: evidence from positron emission tomography studies with [11C]WIN-35,428. The Journal of neuroscience: the official journal of the Society for Neuroscience. 1998;18:8417–8422. doi: 10.1523/JNEUROSCI.18-20-08417.1998. [DOI] [PMC free article] [PubMed] [Google Scholar]
- Min KJ, Yang MS, Kim SU, Jou I, Joe EH. Astrocytes induce hemeoxygenase-1 expression in microglia: a feasible mechanism for preventing excessive brain inflammation. The Journal of neuroscience: the official journal of the Society for Neuroscience. 2006;26:1880–1887. doi: 10.1523/JNEUROSCI.3696-05.2006. [DOI] [PMC free article] [PubMed] [Google Scholar]
- Nash JF, Yamamoto BK. Methamphetamine neurotoxicity and striatal glutamate release: comparison to 3,4-methylenedioxymethamphetamine. Brain research. 1992;581:237–243. doi: 10.1016/0006-8993(92)90713-j. [DOI] [PubMed] [Google Scholar]
- O’Callaghan JP, Miller DB. Neurotoxicity profiles of substituted amphetamines in the C57BL/6J mouse. The Journal of pharmacology and experimental therapeutics. 1994;270:741–751. [PubMed] [Google Scholar]
- O’Dell SJ, Weihmuller FB, Marshall JF. MK-801 prevents methamphetamine-induced striatal dopamine damage and reduces extracellular dopamine overflow. Annals of the New York Academy of Sciences. 1992;648:317–319. doi: 10.1111/j.1749-6632.1992.tb24567.x. [DOI] [PubMed] [Google Scholar]
- Okada S, Nakamura M, Katoh H, et al. Conditional ablation of Stat3 or Socs3 discloses a dual role for reactive astrocytes after spinal cord injury. Nature medicine. 2006;12:829–834. doi: 10.1038/nm1425. [DOI] [PubMed] [Google Scholar]
- Ramirez SH, Potula R, Fan S, et al. Methamphetamine disrupts blood-brain barrier function by induction of oxidative stress in brain endothelial cells. Journal of cerebral blood flow and metabolism: official journal of the International Society of Cerebral Blood Flow and Metabolism. 2009;29:1933–1945. doi: 10.1038/jcbfm.2009.112. [DOI] [PMC free article] [PubMed] [Google Scholar]
- Sekine Y, Ouchi Y, Sugihara G, et al. Methamphetamine causes microglial activation in the brains of human abusers. The Journal of neuroscience: the official journal of the Society for Neuroscience. 2008;28:5756–5761. doi: 10.1523/JNEUROSCI.1179-08.2008. [DOI] [PMC free article] [PubMed] [Google Scholar]
- Shah A, Silverstein PS, Kumar S, Singh DP, Kumar A. Synergistic Cooperation between Methamphetamine and HIV-1 gsp120 through the P13K/Akt Pathway Induces IL-6 but not IL-8 Expression in Astrocytes. PloS one. 2012a;7:e52060. doi: 10.1371/journal.pone.0052060. [DOI] [PMC free article] [PubMed] [Google Scholar]
- Shah A, Silverstein PS, Singh DP, Kumar A. Involvement of metabotropic glutamate receptor 5, AKT/PI3K signaling and NF-kappaB pathway in methamphetamine-mediated increase in IL-6 and IL-8 expression in astrocytes. Journal of neuroinflammation. 2012b;9:52. doi: 10.1186/1742-2094-9-52. [DOI] [PMC free article] [PubMed] [Google Scholar]
- Sharma HS, Kiyatkin EA. Rapid morphological brain abnormalities during acute methamphetamine intoxication in the rat: an experimental study using light and electron microscopy. Journal of chemical neuroanatomy. 2009;37:18–32. doi: 10.1016/j.jchemneu.2008.08.002. [DOI] [PMC free article] [PubMed] [Google Scholar]
- Shih AY, Johnson DA, Wong G, Kraft AD, Jiang L, Erb H, Johnson JA, Murphy TH. Coordinate regulation of glutathione biosynthesis and release by Nrf2-expressing glia potently protects neurons from oxidative stress. The Journal of neuroscience: the official journal of the Society for Neuroscience. 2003;23:3394–3406. doi: 10.1523/JNEUROSCI.23-08-03394.2003. [DOI] [PMC free article] [PubMed] [Google Scholar]
- Sofroniew MV. Molecular dissection of reactive astrogliosis and glial scar formation. Trends in neurosciences. 2009;32:638–647. doi: 10.1016/j.tins.2009.08.002. [DOI] [PMC free article] [PubMed] [Google Scholar]
- Sofroniew MV, Vinters HV. Astrocytes: biology and pathology. Acta neuropathologica. 2010;119:7–35. doi: 10.1007/s00401-009-0619-8. [DOI] [PMC free article] [PubMed] [Google Scholar]
- Sonsalla PK, Nicklas WJ, Heikkila RE. Role for excitatory amino acids in methamphetamine-induced nigrostriatal dopaminergic toxicity. Science. 1989;243:398–400. doi: 10.1126/science.2563176. [DOI] [PubMed] [Google Scholar]
- Sriram K, Miller DB, O’Callaghan JP. Minocycline attenuates microglial activation but fails to mitigate striatal dopaminergic neurotoxicity: role of tumor necrosis factor-alpha. Journal of neurochemistry. 2006;96:706–718. doi: 10.1111/j.1471-4159.2005.03566.x. [DOI] [PubMed] [Google Scholar]
- Thomas DM, Kuhn DM. Attenuated microglial activation mediates tolerance to the neurotoxic effects of methamphetamine. Journal of neurochemistry. 2005;92:790–797. doi: 10.1111/j.1471-4159.2004.02906.x. [DOI] [PubMed] [Google Scholar]
- Thomas DM, Walker PD, Benjamins JA, Geddes TJ, Kuhn DM. Methamphetamine neurotoxicity in dopamine nerve endings of the striatum is associated with microglial activation. The Journal of pharmacology and experimental therapeutics. 2004;311:1–7. doi: 10.1124/jpet.104.070961. [DOI] [PubMed] [Google Scholar]
- Wagner GC, Ricaurte GA, Seiden LS, Schuster CR, Miller RJ, Westley J. Long-lasting depletions of striatal dopamine and loss of dopamine uptake sites following repeated administration of methamphetamine. Brain research. 1980;181:151–160. doi: 10.1016/0006-8993(80)91265-2. [DOI] [PubMed] [Google Scholar]
- Zhang ZG, Bower L, Zhang RL, Chen S, Windham JP, Chopp M. Three-dimensional measurement of cerebral microvascular plasma perfusion, glial fibrillary acidic protein and microtubule associated protein-2 immunoreactivity after embolic stroke in rats: a double fluorescent labeled laser-scanning confocal microscopic study. Brain research. 1999;844:55–66. doi: 10.1016/s0006-8993(99)01886-7. [DOI] [PubMed] [Google Scholar]
- Zhao ML, Kim MO, Morgello S, Lee SC. Expression of inducible nitric oxide synthase, interleukin-1 and caspase-1 in HIV-1 encephalitis. Journal of neuroimmunology. 2001;115:182–191. doi: 10.1016/s0165-5728(00)00463-x. [DOI] [PubMed] [Google Scholar]
- Zhu JP, Xu W, Angulo N, Angulo JA. Methamphetamine-induced striatal apoptosis in the mouse brain: comparison of a binge to an acute bolus drug administration. Neurotoxicology. 2006;27:131–136. doi: 10.1016/j.neuro.2005.05.014. [DOI] [PMC free article] [PubMed] [Google Scholar]