

Abstract
HLA-DRB1 codes for a major histocompatibility complex class II cell surface receptor. Genetic variants in and around this gene have been linked to numerous autoimmune diseases. Most notably, an association between HLA-DRB1*1501 haplotype and multiple sclerosis has been defined. Utilizing electronic health records and 4235 individuals within Marshfield Clinic’s Personalized Medicine Research Project, a reverse genetic screen coined Phenome Wide Association Study (PheWAS) tested association of rs3135388 genotype (tagging HLA-DRB1*1501) with 4841 phenotypes. As expected, HLA-DRB1*1501 was associated with multiple sclerosis (ICD9 340, P=0.023), while the strongest association was with alcohol-induced cirrhosis of the liver (ICD9 571.2, P=0.00011). HLA-DRB1*1501 also demonstrated association with erythematous conditions (ICD9 695, P=0.0054) and benign neoplasms of the respiratory and intrathoracic organs (ICD9 212, P=0.042), replicating previous findings. This study not only builds on the feasibility/utility of the PheWAS approach, represents the first external validation of a PheWAS, but may also demonstrate the complex etiologies associated with the HLA-DRB1*1501 loci.
Keywords: PheWAS, HLA-DRB1, benign neoplasm, alcohol, erythematous, rosacea, intertrigo, multiple sclerosis
INTRODUCTION
Over the last decade, significant technological advances have allowed the scientific community to measure over one million single nucleotide polymorphisms (SNPs) in a single assay. These technologies are the fundamental keystones of the phenotype-to-genotype strategy of studying human genetics commonly identified as a “genome wide association study” (GWAS). Many of these GWAS results have been curated by the National Human Genome Research Institute “Catalog of Published GWASs.” This repository contains over 1600 genome-wide significant genomic markers (P<5.0E-8) for over 250 traits (https://www.genome.gov/26525384).1 One of the challenges in conducting GWASs is identifying specific clinically-defined traits with clear correspondence to an underlying genetic component. Even when such traits are observed, GWASs often fail to explain much of the variability exhibited by subjects under study.2 This is exemplified in one of the largest GWASs conducted to date, which focused on human height in 183727 participants. Even though human height is believed to be >80% heritable, 10.5% of the phenotypic variance can be explained by 180 genome-wide statistically significant SNPs.3 The challenge of identifying markers associated with any phenotype during a GWAS is compounded further by most statistically significant markers having marginal effect sizes. The few exceptions to this include variants describing many common HLA haplotypes including HLA-DRB1*1501.
HLA-DRB1 encodes an important component of the HLA class II histocompatibility complex necessary for antigen presentation. Not surprisingly, variants in and around this gene have been associated with numerous autoimmune diseases by GWAS analysis including: rheumatoid arthritis,4–9 juvenile arthritis,10 Grave’s disease,11 type 1 diabetes,12 systemic lupus erythematous,13 ulcerative colitis,14 and multiple sclerosis (MS).15–18 In addition, variants in and around HLA-DRB1 have been associated with drug-induced liver injury.19,20 The association of common genetic variants in HLA-DRB1 with numerous disease phenotypes suggests that HLA-DRB1 may be a pivotal gene involved in overall human health.
In addition to enormous amounts of genomic data being generated and stored for scientific study as the result of GWASs, substantial amounts of phenotypic data are also being stored in the form of electronic medical records (EMR). EMR data can contain intimate long-term medical histories including physician notes, imaging results, laboratory results, medication records, family histories, and billing information–most notably tracked by the International Classification of Disease version 9-CM (ICD9) and “V” codes, a standardized hierarchical coding system to define patient care. These multi-level ICD9/V codes not only support a standardized mechanism for billing purposes, but provide insight into thousands of disease phenotypes. Not surprisingly, ICD9 codes are commonly used to define disease status for genetic studies, but these studies typically focus on one specific disease.21 Where GWASs start with a phenotype and attempt to define a predictive genotype, it is now possible to go in the reverse direction, where the genetic variant is associated with the entire content of the EMR to define many phenotypes. This approach has been termed PheWAS. The PheWAS strategy may help address some of the limitations of the GWAS approach, specifically as it relates to phenotypic constraints.
Only a handful of PheWASs have been conducted to date,22–24 including a proof of principle for the technique using Vanderbilt’s DNA biobank (BioVU).25 SNPs selected for analysis in the BioVU study were chosen based on statistically significant GWAS results published previously. Most notably, one of the SNPs selected included rs3135388, a marker that tags for HLA-DRB1*1501 (r2=0.97). Located about 130 kb from HLA-DRB1, rs3135388 is strongly associated with MS.26 Of the five SNPs genotyped in 6005 European-Americans in BioVU, four of the five SNPs were validated for association with the ICD9 codes that defined the predicted phenotypes, including the expected association of rs3135388 with MS. In addition to the expected phenotypes, rs3135388 genotype demonstrated novel associations with additional phenotypes including erythematous conditions and benign neoplasm of respiratory and intrathoracic organs.25 Because of the pleiotropic nature of HLA-DRB1 and the potential utility of a PheWAS strategy in identifying novel phenotypes associated with HLA-DRB1, we genotyped rs3135388 in 4235 DNA samples from subjects enrolled in Marshfield Clinic’s Personalized Medicine Research Project (PMRP)27 and associated those genotypes with 4 841 phenotypes defined by standardized ICD9 and V codes along with site specific ICD9 codes (Figure 1).
Figure 1.
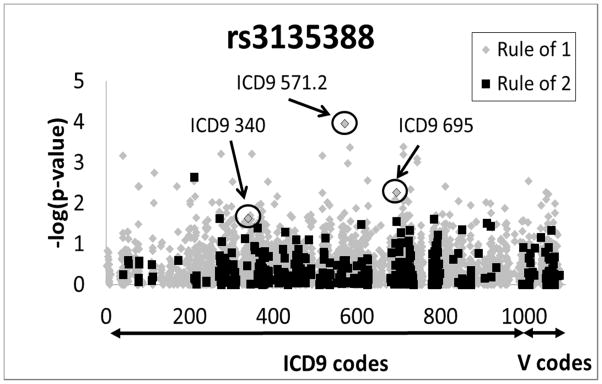
Manhattan plot of unadjusted −log10 (P-values) for all ICD9 and V codes as related to rs3135388 genotype. Highlighted are associations results for multiple sclerosis (MS) (ICD9 340, P=0.023), erythematous conditions (ICD9 695, P=0.0054), and alcohol-induced cirrhosis of liver (ICD9 571.2, P=0.00011). Grey diamonds represent ICD9 codes defined by “rule of 1,” while black squares represent phenotypes defined by “rule of 2.”
RESULTS AND DISCUSSION
Although none of the PheWAS associations met a conservative Bonferroni corrected p-value (P<1.0E-5), interesting associations were observed. Despite a small sample size (n=20 cases), rs3135388 showed association with the ICD9 code for MS (ICD9 340, P=0.023) in our cohort, as expected (Figure 1, Table 1). Interestingly, the ICD9 code for “benign neoplasm of the respiratory and intrathoracic organs” (ICD9 212) was also associated with rs3135388 genotype (P=0.042), potentially validating novel results from the BioVU dataset.25 “Benign neoplasm of other parts of the digestive system” was also associated with rs3135388 in our cohort (ICD9 211, P=0.0023), but in the opposite direction observed in the BioVU dataset, suggesting caution should be considered when interpreting these phenotypes (Table 1). Conversely, if the genetic associations with one or more of these two phenotypes are accurate, chronic inflammation and/or disruption of immune-mediated tumor surveillance may underlie the pathophysiology of these conditions.
Table 1.
Top associations (P <0.01) and other relevant phenotypes for PheWAS including analysis method (Fisher exact vs. logistic regression), rule method (“Rule of 1” vs. “Rule of 2”), and previously reported PheWAS associations from BioVU’s. 25 P-values include raw and adjusted p-values (Adusted1-sex and years of EMR data; Adusted2-sex, years of EMR data, and age)
| Description (ICD9/V CODE) | Cases | Controls | P-values | Allelic OR | Analysis | Rule | BioVU P-value (OR) | ||||
|---|---|---|---|---|---|---|---|---|---|---|---|
| Count | MAF | Count | MAF | raw | Adjusted1 | Adjusted2 | |||||
| Alcohol Cirrhosis Liver (571.2)* | 11 | 0.45 | 4219 | 0.14 | 0.00011 | 5.01 (2.16–11.62) | Fisher Exact | 1 | |||
|
| |||||||||||
| Crystal arthropathies (712) | 230 | 0.20 | 4000 | 0.14 | 0.00041 | 0.00045 | 0.00052 | 1.53 (1.21–1.94) | Logistic | 1 | |
| Acute Kidney Failure W Lesion Of Tubular Necrosis (584.5) | 13 | 0.42 | 4217 | 0.14 | 0.00043 | 4.41 (2.02–9.62) | Fisher Exact | 1 | |||
| Other Disorder Of Calcium Metabolism (275.49) | 188 | 0.20 | 4042 | 0.14 | 0.00061 | 1.57 (1.21–2.03) | Fisher Exact | 1 | |||
| Other specified disorders of nervous system (349.8) | 18 | 0.33 | 4212 | 0.14 | 0.00063 | 3.00 (1.50–6.01) | Fisher Exact | 1 | |||
| Chondrocalcinosis cause unspecified (712.3) | 212 | 0.20 | 4018 | 0.14 | 0.00064 | 0.0007 | 0.00080 | 1.53 (1.20–1.96) | Logistic | 1 | |
| Pulmonary Eosinophilia (518.3) | 82 | 0.24 | 4148 | 0.14 | 0.00068 | 0.00081 | 0.0013 | 1.89 (1.31–2.72) | Logistic | 1 | |
| Staphylococcus Aureus Infection (041.11) | 101 | 0.23 | 4129 | 0.14 | 0.0007 | 0.00078 | 0.00086 | 1.79 (1.28–2.5) | Logistic | 1 | |
| Secundum Atrial Sept Defect (745.5) | 44 | 0.27 | 4186 | 0.14 | 0.00081 | 0.00089 | 0.0013 | 2.26 (1.41–3.63) | Logistic | 1 | |
| Bulbus cordis anomalies and anomalies of cardiac septal closure (745) | 47 | 0.27 | 4183 | 0.14 | 0.001 | 0.0011 | 0.0015 | 2.19 (1.38–3.47) | Logistic | 1 | |
| Intestinal malabsorption (579) | 168 | 0.21 | 4062 | 0.14 | 0.0011 | 0.0012 | 0.0014 | 1.58 (1.20–2.07) | Logistic | 1 | |
| Histoplasmosis unspecified (115.9) | 16 | 0.38 | 4214 | 0.14 | 0.0018 | 3.61 (1.76–7.4) | Fisher Exact | 1 | |||
| Benign neoplasm of other parts of digestive system (211) | 1417 | 0.12 | 2155 | 0.15 | 0.0023 | 0.0021 | 0.014 | 0.81 (0.70–0.93) | Logistic | 2 | 0.00094 (1.33) |
| Irregular Menstruation (626.4) | 503 | 0.17 | 3727 | 0.14 | 0.0028 | 0.003 | 0.17 | 1.30 (1.09–1.55) | Logistic | 1 | |
| Benign Neoplasm Large Bowel (211.3) | 1344 | 0.13 | 2231 | 0.15 | 0.0028 | 0.0022 | 0.015 | 0.81 (0.70–0.93) | Logistic | 2 | |
| history of malignant neoplasm of other sites (V10.89) | 11 | 0.36 | 4219 | 0.14 | 0.0029 | 3.43 (1.44–8.19) | Fisher Exact | 1 | |||
| Other and unspecified alcohol dependence, episodic (303.92) | 14 | 0.36 | 4216 | 0.14 | 0.003 | 3.34 (1.54–7.25) | Fisher Exact | 1 | |||
| Otorrhea (388.6) | 47 | 0.17 | 4183 | 0.14 | 0.003 | 1.23 (0.72–2.11) | Fisher Exact | 1 | |||
| Other closed fracture of upper end of humerus (812.09) | 20 | 0.18 | 4210 | 0.14 | 0.0039 | 1.27 (0.56–2.88) | Fisher Exact | 1 | |||
| Other Operations On Bones, Except Facial Bones (078.8) | 305 | 0.15 | 3925 | 0.14 | 0.0039 | 1.04 (0.82–1.31) | Fisher Exact | 1 | |||
| Malignant neoplasm of connective and other soft tissue (171) | 14 | 0.32 | 4216 | 0.14 | 0.004 | 2.84 (1.28–6.29) | Fisher Exact | 1 | |||
| Unspecified disorder of muscle, ligament, and fascia (728.9) | 257 | 0.14 | 3973 | 0.14 | 0.0047 | 0.94 (0.72–1.22) | Fisher Exact | 1 | |||
|
| |||||||||||
| Erythematous conditions (695) | 614 | 0.17 | 3063 | 0.14 | 0.0054 | 0.0068 | 0.049 | 1.27 (1.08–1.50) | Logistic | 2 | 0.0033 (1.47) |
|
| |||||||||||
| Adjustment Hearing Aid (V53.2) | 333 | 0.11 | 3761 | 0.15 | 0.0055 | 0.0046 | 0.0064 | 0.70 (0.54–0.90) | Logistic | 2 | |
| Pulmonary Infiltrate (518.3) | 74 | 0.24 | 4156 | 0.14 | 0.0056 | 1.87 (1.27–2.75) | Fisher Exact | 1 | |||
| Aftercare Following Surgery Sense Organs (V58.71) | 697 | 0.12 | 3533 | 0.15 | 0.006 | 0.0051 | 0.0053 | 0.78 (0.65–0.93) | Logistic | 1 | |
| Lipoma Intra-Abdominal (214.3) | 29 | 0.14 | 4201 | 0.14 | 0.0069 | 0.95 (0.45–2.01) | Fisher Exact | 1 | |||
| Anterior Wall Infarction Subsequent Care (410.12) | 22 | 0.27 | 4208 | 0.14 | 0.0069 | 2.25 (1.16–4.38) | Fisher Exact | 1 | |||
| Unspecified monoarthritis, lower leg (716.66) | 44 | 0.22 | 4186 | 0.14 | 0.0076 | 1.65 (0.99–2.75) | Fisher Exact | 1 | |||
| Fitting and adjustment of urinary devices (V53) | 1545 | 0.13 | 1962 | 0.15 | 0.0081 | 0.0043 | 0.019 | 0.82 (0.72–0.94) | Logistic | 2 | |
| Acute Dermatitis Due To Solar Radiation (692.72) | 115 | 0.20 | 4115 | 0.14 | 0.0081 | 0.0093 | 0.0093 | 1.55 (1.12–2.15) | Logistic | 1 | |
| Other Malignant Neoplasms of Lymphoid and Histiocytic Tissue (202) | 26 | 0.10 | 4204 | 0.14 | 0.0089 | 0.63 (0.25–1.59) | Fisher Exact | 1 | |||
| Sprain Cruciate Lig Knee (844.2) | 26 | 0.10 | 4204 | 0.14 | 0.0089 | 0.63 (0.25–1.59) | Fisher Exact | 1 | |||
| Chondrocalcinosis, unspecified, lower leg (712.36) | 111 | 0.21 | 4119 | 0.14 | 0.0089 | 1.63 (1.17–2.26) | Fisher Exact | 1 | |||
| Disorders Of Sacrum (724.6) | 381 | 0.17 | 3849 | 0.14 | 0.0092 | 0.013 | 0.018 | 1.29 (1.06–1.57) | Logistic | 1 | |
| Adrenogenital Disorders (255.2) | 31 | 0.21 | 4199 | 0.14 | 0.0095 | 1.59 (0.86–2.94) | Fisher Exact | 1 | |||
| Tongue Disorder (529.9) | 68 | 0.10 | 4162 | 0.14 | 0.0095 | 0.63 (0.35–1.12) | Fisher Exact | 1 | |||
| Pure Hypercholesterolem (272) | 3450 | 0.14 | 780 | 0.16 | 0.0097 | 0.0031 | 0.0059 | 0.83 (0.71–0.96) | Logistic | 1 | |
| Insect Bite Head-Infect (910.5) | 12 | 0.17 | 4218 | 0.14 | 0.0097 | 1.19 (0.41–3.49) | Fisher Exact | 1 | |||
| Histoplasmosis (115) | 21 | 0.31 | 4209 | 0.14 | 0.0098 | 2.69 (1.39–5.19) | Fisher Exact | 1 | |||
|
| |||||||||||
| Multiple Sclerosis (340) | 20 | 0.30 | 4210 | 0.14 | 0.023 | 2.57 (1.3–5.07) | Fisher Exact | 1 | 2.8E-6 (2.24) | ||
| Benign Neoplasm of Respiratory and Intrathoracic Organs (212) | 14 | 0.29 | 4216 | 0.14 | 0.042 | 2.4 (1.05–5.46) | Fisher Exact | 1 | 0.0021 (1.96 | ||
ICD9 571.2 phenotype was manually assess in EMR. 4 of the 11 cases could not be validated.
The rs3135388 genotype was also associated with erythematous conditions (ICD9 695, P=0.0054), further confirming the association reported in the BioVU cohort25 (Table 1 and Table 2). Although this association does not reach PheWAS significance, restricting the number of independent tests to those reported for rs3135388 in the BioVU cohort (eight), allows for a more disease focused interpretation of the P-value. Under this scenario, ICD9 695 remains significant after a Bonferroni adjustment (P<0.05). Unlike the BioVU cohort, sub-phenotypes of ICD9 695 were analyzed within this cohort including toxic erythema (ICD9 695.0, P=0.096), erythema multiform (ICD9 695.1, P=0.45), erythema nodosum (ICD9 695.2, P=0.48), rosacea (ICD9 695.3, P=0.028), lupus erythematous (ICD9 695.4, P=0.28), intertrigo (ICD9 695.89, P=0.067), and unspecified erythematous conditions (ICD9 695.9, P=0.84) including the site specific phenotype chronic erythematous caused by a tick bite (ICD9 695.900, P=1.0) (Table 2). These results suggest that rosacea, along with intertrigo, may be contributing to the association observed with erythematous conditions. Interestingly, rosacea and intertrigo are relatively independent of each other based on the lack of overlap (40 patients) observed within the ICD9 695 phenotype (Supplemental Figure 1).
Table 2.
Associations for the subtypes of Erythematous conditions (ICD9 695) including case and control counts, MAFs, raw p-values, Allelic ORs and 95% CIs, analysis methods (Fisher exact vs. logistic regression), and rule methods (“Rule of 1” vs. “Rule of 2”).
| Description (ICD9/V CODE) | Cases | Controls | P-value | Allelic OR (95% CI) | Analysis | Rule | ||
|---|---|---|---|---|---|---|---|---|
| count | MAF | count | MAF | |||||
| Erythematous conditions (695) | 614 | 0.17 | 3063 | 0.14 | 0.0054 | 1.27 (1.08–1.5) | Logistic | 2 |
|
| ||||||||
| Toxic Erythema (695.0) | 18 | 0.08 | 4212 | 0.14 | 0.096 | 0.54 (0.17–1.77) | Fisher Exact | 1 |
| Erythema Multiforme (695.1) | 28 | 0.18 | 4202 | 0.14 | 0.46 | 1.3 (0.65–2.58) | Fisher Exact | 1 |
| Erythema Nodosum (695.2) | 30 | 0.12 | 4200 | 0.14 | 0.48 | 0.79 (0.36–1.74) | Fisher Exact | 1 |
|
| ||||||||
| Rosacea (695.3) | 311 | 0.18 | 3732 | 0.14 | 0.028 | 1.29 (1.04–1.6) | Logistic | 2 |
|
| ||||||||
| Lupus Erythematosus (695.4) | 22 | 0.20 | 4208 | 0.14 | 0.28 | 1.54 (0.74–3.21) | Fisher Exact | 1 |
|
| ||||||||
| Intertrigo (695.89) | 438 | 0.16 | 3792 | 0.14 | 0.067 | 1.19 (0.98–1.44) | Logistic | 1 |
|
| ||||||||
| Unspecified Erythematous Condition (695.9) | 337 | 0.15 | 3893 | 0.14 | 0.84 | 1.03 (0.82–1.29) | Logistic | 1 |
| Tick Bite Induced Erythema (695.900) | 11 | 0.09 | 4219 | 0.14 | 1.0 | 0.6 (0.14–2.55) | Fisher Exact | 1 |
Within the subset of the PMRP cohort, the strongest rs3135388 PheWAS association observed was with alcohol-induced cirrhosis of the liver (ICD9 571.2, P=0.00011), with the related phenotype “unspecified alcohol liver damage” also demonstrating suggestive results (ICD9 571.3, P=0.018) (Figure 1, Table 1). Because of the small number of cases and level of significance, all cases coded for ICD9 571.2 were manually inspected. Of the eleven cases, seven were confirmed. Of the four that were not confirmed, all had elevated liver enzymes suggesting liver damage, one had a record of “cirrhosis” without mention of alcohol abuse, while the other three had extensive records of alcohol abuse but no evidence of “cirrhosis” in their EMR. When these four cases were removed from the ICD9 571.2 case group, rs3135388’s association with ICD9 571.2 became less significant (P=0.012). Within the BioVU cohort, these sub-phenotypes were not specifically reported.25 Although we are not aware of any published relationship between MS and alcohol-induced cirrhosis, Singer et al.19 demonstrated that the HLA-DRB1*1501 haplotype is associated with lumiracoxib-related liver injury (P=6.8e-25, OR 5, CI 3.6–7.0). Further, Lucena et al.14 demonstrated a similar association with amoxicillin-clavulanate-induced liver injury (P=4.8e-14, OD 3.1, CI 2.3–4.2). Although the potential relationship between drug-induced liver damage and alcohol-induced liver damage is enticing, replication studies will be necessary to confirm the potential role of rs3135388 genotype with alcohol-induced liver damage.
The ability to identify statistical significance with any phenotype is limited by the inherent nature of the phenotype(s) being studied (e.g., heritability, polygenicity, case/control specificity, and sample size) in either the GWAS or PheWAS strategy. Conversely, when logical genetic targets are identified, either by their known disease association or potential function, the PheWAS strategy may provide broad insight into the pathophysiology of multiple disease processes. One challenge in conducting a PheWAS is determining how to replicate the findings. Is a case-control study or an independent PheWAS necessary for replication? To determine how many cases and controls are necessary for a disease specific replication, assumptions on prevalence, allele frequency, and effect size must be made but are often best-guest estimates. In a PheWAS, many of the case sizes are small, and accurately estimating these parameters may be difficult. In Supplemental Table 1, we report the number of cases and controls needed to replicate the top findings (P<0.01) with 80% power. Conversely, when the exact disease of interest to replicate is not known, an independent PheWAS replication may be an alternative approach.
In this study, we demonstrate the first external validation of an EMR based PheWAS. In addition, we expanded the use of the PheWAS approach by including the majority of rare and common phenotypes within the EMR by using multiple levels of ICD9 and V codes when studying HLA-DRB1*1501. These results may further emphasize the pleiotropic nature of the HLA region, provide further insight into the role of antigen presentation in disease pathogenesis, and may inform new treatment options appropriate for multiple conditions. Importantly, as EMRs are more frequently applied and better tools are developed to define accurate clinical phenotypes within EMRs, the PheWAS strategy may become a powerful complimentary/alternative strategy to the GWAS.
MATERIALS AND METHODS
Sample collection and processing of DNA used in this study has been previously described.21,27 Briefly, all individuals analyzed were greater than 50 years of age, had over 30 years of EMR data on average, were self-identified as being white/non-Hispanic, and were originally selected as subpopulations who met eligibility criteria for inclusion in cohort-based studies examining genetic associations with high-density lipoprotein levels or cataract disease.28 Written informed consent was acquired for all participants and reviewed by Marshfield Clinic’s Institutional Review Board.
In the present study, ICD9 and V codes, including a few site specific codes, formed the basis for defining cases and controls. Individuals whose medical record contained ICD9 codes inclusive of three levels of resolution defined by ICD9 code suffix (e.g. ICD9 695, 695.1, 695.11) were designated as a case for that condition at each level, while those with no record of these codes in their EMR were classified as controls. Under this scenario, cases for one ICD9 code may be coded as controls for a related ICD9 code (e.g., ICD9 695.3 and 695.4) potentially diluting the significance of either if both share a common genetic etiology. Due to privacy concerns, only those phenotypes that were observed greater than nine times within the cohort were included among the phenotypes chosen for analysis. Utilizing this approach, there were 4 841 phenotypes extracted from the EMR. Prevalence of each phenotype can be seen in Supplementary Figure 2.
One of the challenges in conducting a PheWAS study is balancing sample size and how well the cases and controls are defined. As such, all cases were assigned by either “rule of one” (individuals only had to have been coded once to be considered a case) or “rule of two” (defined as occurrence of an ICD9/V code at least twice in the EMR of a given subject). Informed by Monte Carlo power calculations, “rule of one” was applied for rare conditions (fewer than 300 cases). For more common phenotypes, rule of two was applied where rule of two explained greater than 75% of the cases defined by rule of one. This was a compromise for the added benefit of including more samples at the risk of reducing the positive predictive value. In applying rule of two, any individual coded only once was thus censored from further analysis. No further filtering of phenotypes was conducted, including filtering based on potential environmental effects and/or injury, because of the possibility that those codes could help define symptoms for more complex conditions. For example, a variant associated with broken bones could be indicative of an osteoporotic-like condition.
Rs3135388 was genotyped as part of a larger multiplex Sequenom assay (Sequenome, San Diego, CA, USA) in accordance with manufacturer’s specifications for 384 well format. Primer sequences are available upon request. On each 384 plate, a CEPH trio was genotyped along with two negative controls. No Mendelian errors were observed, and the variant was consistent with Hardy Weinberg equilibrium (P=0.064).
For common ICD9 and V codes, unadjusted and adjusted logistic regression analysis was conducted. Because all patients in this cohort were older than age 50 (mean=74 and median=75), and age may be a confounder for many phenotypes, two adjustment conditions were considered. 1: sex, and years of EMR data 2: age, sex, and years of EMR data. For rare ICD9 and V codes, where cell counts for an allele or genotype fell below five in an X2 contingency table, a Fisher’s exact test was used without adjustments similar to the method defined by the BioVU PheWAS.25 PheWAS analysis was conducted in R (http://www.r-project.org). No evidence of strong systematic confounding or bias in the SNP-phenotype associations was observed according to the Q-Q plot (Supplemental Figure 3). Sample size estimates were calculated in R assuming a balanced case-control study utilizing the observed disease prevalence, allele frequency, and ORs.
Supplementary Material
Breakdown of ICD9 695 by 695.3, 695.89, and other 965.* phenotypes. (* denotes a “wildcard” value).
Incidence (percent of cohort) for all 4841 phenotypes including ICD9 and V codes. Grey diamonds represent ICD9 codes defined by “rule of 1,” while black squares represent phenotypes defined by “rule of 2.”
Q-Q plot of rs3135388 PheWAS under the additive model. Observed P-values are unadjusted.
Acknowledgments
This study was funded by NLM grant 5T15LM007359, NIGMS grant R01GM097618, NCATS grant 9U54TR000021, and NCRR grant 1U1RR025011. In addition, the authors gratefully acknowledge the support from the Marshfield Clinic Research Foundation through the Personalized Medicine Research Project.
Footnotes
CONFLICT OF INTEREST
Authors declare no conflicts of interest.
References
- 1.Hindorff LA, MacArthur J, Wise A, Junkins HA, Hall PN, Klemm AK, et al. A Catalog of Published Genome-Wide Association Studies. 2012 Available at: www.genome.gov/gwastudies. [cited 2012]
- 2.Manolio TA, Collins FS, Cox NJ, Goldstein DB, Hindorff LA, Hunter DJ, et al. Finding the missing heritability of complex diseases. Nature. 2009;461:747–753. doi: 10.1038/nature08494. [DOI] [PMC free article] [PubMed] [Google Scholar]
- 3.Lango Allen H, Estrada K, Lettre G, Berndt SI, Weedon MN, Rivadeneira F, et al. Hundreds of variants clustered in genomic loci and biological pathways affect human height. Nature. 1021;467:832–838. doi: 10.1038/nature09410. [DOI] [PMC free article] [PubMed] [Google Scholar]
- 4.Wellcome Trust Case Control Consortium. Genome-wide association study of 14,000 cases of seven common diseases and 3,000 shared controls. Nature. 2007;447:661–678. doi: 10.1038/nature05911. [DOI] [PMC free article] [PubMed] [Google Scholar]
- 5.Freudenberg J, Lee HS, Han BG, Shin HD, Kang YM, Sung YK, et al. Genome-wide association study of rheumatoid arthritis in Koreans: population-specific loci as well as overlap with European susceptibility loci. Arthritis Rheum. 2011;63:884–893. doi: 10.1002/art.30235. [DOI] [PubMed] [Google Scholar]
- 6.Kochi Y, Okada Y, Suzuki A, Ikari K, Terao C, Takahashi A, et al. A regulatory variant in CCR6 is associated with rheumatoid arthritis susceptibility. Nat Genet. 2010;42:515–519. doi: 10.1038/ng.583. [DOI] [PubMed] [Google Scholar]
- 7.Plenge RM, Seielstad M, Padyukov L, Lee AT, Remmers EF, Ding B, et al. TRAF1-C5 as a risk locus for rheumatoid arthritis--a genomewide study. N Engl J Med. 2007;357:1199–1209. doi: 10.1056/NEJMoa073491. [DOI] [PMC free article] [PubMed] [Google Scholar]
- 8.Raychaudhuri S, Remmers EF, Lee AT, Hackett R, Guiducci C, Burtt NP, et al. Common variants at CD40 and other loci confer risk of rheumatoid arthritis. Nat Genet. 2008;40:1216–1223. doi: 10.1038/ng.233. [DOI] [PMC free article] [PubMed] [Google Scholar]
- 9.Stahl EA, Raychaudhuri S, Remmers EF, Xie G, Eyre S, Thomson BP, et al. Genome-wide association study meta-analysis identifies seven new rheumatoid arthritis risk loci. Nat Genet. 2010;42:508–514. doi: 10.1038/ng.582. [DOI] [PMC free article] [PubMed] [Google Scholar]
- 10.Behrens EM, Finkel TH, Bradfield JP, Kim CE, Linton L, Casalunovo T, et al. Association of the TRAF1-C5 locus on chromosome 9 with juvenile idiopathic arthritis. Arthritis Rheum. 2008;58:2206–2207. doi: 10.1002/art.23603. [DOI] [PubMed] [Google Scholar]
- 11.Chu X, Pan CM, Zhao SX, Liang J, Gao GQ, Zhang XM, et al. A genome-wide association study identifies two new risk loci for Graves’ disease. Nat Genet. 2011;43:897–901. doi: 10.1038/ng.898. [DOI] [PubMed] [Google Scholar]
- 12.Hakonarson H, Grant SF, Bradfield JP, Marchand L, Kim CE, Glessner JT, et al. A genome-wide association study identifies KIAA0350 as a type 1 diabetes gene. Nature. 2007;448:591–594. doi: 10.1038/nature06010. [DOI] [PubMed] [Google Scholar]
- 13.Han JW, Zheng HF, Cui Y, Sun LD, Ye DQ, Hu Z, et al. Genome-wide association study in a Chinese Han population identifies nine new susceptibility loci for systemic lupus erythematosus. Nat Genet. 2009;41:1234–1237. doi: 10.1038/ng.472. [DOI] [PubMed] [Google Scholar]
- 14.Anderson CA, Boucher G, Lees CW, Franke A, D’Amato M, Taylor KD, et al. Meta-analysis identifies 29 additional ulcerative colitis risk loci, increasing the number of confirmed associations to 47. Nat Genet. 2011;43:246–252. doi: 10.1038/ng.764. [DOI] [PMC free article] [PubMed] [Google Scholar]
- 15.Comabella M, Craig DW, Camina-Tato M, Morcillo C, Lopez C, Navarro A, et al. Identification of a novel risk locus for multiple sclerosis at 13q31. 3 by a pooled genome-wide scan of 500,000 single nucleotide polymorphisms. PLoS One. 2008;3:e3490. doi: 10.1371/journal.pone.0003490. [DOI] [PMC free article] [PubMed] [Google Scholar]
- 16.De Jager PL, Jia X, Wang J, de Bakker PI, Ottoboni L, Aggarwal NT, et al. Meta-analysis of genome scans and replication identify CD6, IRF8 and TNFRSF1A as new multiple sclerosis susceptibility loci. Nat Genet. 2009;41:776–782. doi: 10.1038/ng.401. [DOI] [PMC free article] [PubMed] [Google Scholar]
- 17.Patsopoulos NA, Esposito F, Reischl J, Lehr S, Bauer D, Heubach J, et al. Genome-wide meta-analysis identifies novel multiple sclerosis susceptibility loci. Ann Neurol. 2011;70:897–912. doi: 10.1002/ana.22609. [DOI] [PMC free article] [PubMed] [Google Scholar]
- 18.Australia and New Zealand Multiple Sclerosis Genetics Consortium (ANZgene) Genome-wide association study identifies new multiple sclerosis susceptibility loci on chromosomes 12 and 20. Nature Genet. 2009;41:824–828. doi: 10.1038/ng.396. [DOI] [PubMed] [Google Scholar]
- 19.Singer JB, Lewitzky S, Leroy E, Yang F, Zhao X, Klickstein L, et al. A genome-wide study identifies HLA alleles associated with lumiracoxib-related liver injury. Nature Genet. 2010;42:711–714. doi: 10.1038/ng.632. [DOI] [PubMed] [Google Scholar]
- 20.Lucena MI, Molokhia M, Shen Y, Urban TJ, Aithal GP, Andrade RJ, et al. Susceptibility to amoxicillin-clavulanate-induced liver injury is influenced by multiple HLA class I and II alleles. Gastroenterology. 2011;141:338–347. doi: 10.1053/j.gastro.2011.04.001. [DOI] [PMC free article] [PubMed] [Google Scholar]
- 21.McCarty CA, Chisholm RL, Chute CG, Kullo IJ, Jarvik GP, Larson EB, et al. The eMERGE Network: a consortium of biorepositories linked to electronic medical records data for conducting genomic studies. BMC Med Genomics. 2011;4:13. doi: 10.1186/1755-8794-4-13. [DOI] [PMC free article] [PubMed] [Google Scholar]
- 22.Pendergrass SA, Dudek SM, Crawford DC, Ritchie MD. Visually integrating and exploring high throughput Phenome-Wide Association Study (PheWAS) results using PheWAS-View. BioData Min. 2012;5:5. doi: 10.1186/1756-0381-5-5. [DOI] [PMC free article] [PubMed] [Google Scholar]
- 23.Denny JC, Crawford DC, Ritchie MD, Bielinski SJ, Basford MA, Bradford Y, et al. Variants near FOXE1 are associated with hypothyroidism and other thyroid conditions: using electronic medical records for genome- and phenome-wide studies. Am J Hum Genet. 2011;89:529–542. doi: 10.1016/j.ajhg.2011.09.008. [DOI] [PMC free article] [PubMed] [Google Scholar]
- 24.Pendergrass SA, Brown-Gentry K, Dudek SM, Torstenson ES, Ambite JL, Avery CL, et al. The use of phenome-wide association studies (PheWAS) for exploration of novel genotype-phenotype relationships and pleiotropy discovery. Genet Epidemiol. 2011;35:410–422. doi: 10.1002/gepi.20589. [DOI] [PMC free article] [PubMed] [Google Scholar]
- 25.Denny JC, Ritchie MD, Basford MA, Pulley JM, Bastarache L, Brown-Gentry K, et al. PheWAS: demonstrating the feasibility of a phenome-wide scan to discover gene-disease associations. Bioinformatics. 2010;26:1205–1210. doi: 10.1093/bioinformatics/btq126. [DOI] [PMC free article] [PubMed] [Google Scholar]
- 26.de Bakker PI, McVean G, Sabeti PC, Miretti MM, Green T, Marchini J, et al. A high-resolution HLA and SNP haplotype map for disease association studies in the extended human MHC. Nat Genet. 2006;38:1166–1172. doi: 10.1038/ng1885. [DOI] [PMC free article] [PubMed] [Google Scholar]
- 27.McCarty CA, Wilke RA, PFG, Wesbrook SD, Caldwell MD. Marshfield Clinic Personalized Medicine Research Project (PMRP): design, methods and recruitment for a large population-based biobank. Personalized Medicine. 2005;2:49–79. doi: 10.1517/17410541.2.1.49. [DOI] [PubMed] [Google Scholar]
- 28.Turner SD, Berg RL, Linneman JG, Peissig PL, Crawford DC, Denny JC, et al. Knowledge-driven multi-locus analysis reveals gene-gene interactions influencing HDL cholesterol level in two independent EMR-linked biobanks. PLoS One. 2011;6:e19586. doi: 10.1371/journal.pone.0019586. [DOI] [PMC free article] [PubMed] [Google Scholar]
Associated Data
This section collects any data citations, data availability statements, or supplementary materials included in this article.
Supplementary Materials
Breakdown of ICD9 695 by 695.3, 695.89, and other 965.* phenotypes. (* denotes a “wildcard” value).
Incidence (percent of cohort) for all 4841 phenotypes including ICD9 and V codes. Grey diamonds represent ICD9 codes defined by “rule of 1,” while black squares represent phenotypes defined by “rule of 2.”
Q-Q plot of rs3135388 PheWAS under the additive model. Observed P-values are unadjusted.