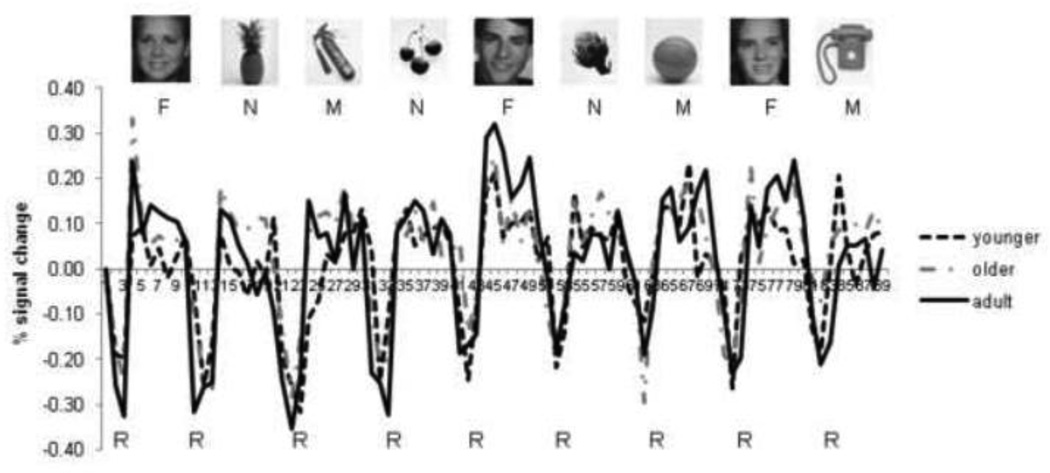
Figure 1.
Average time series for each age group in the right fusiform face area region of interest. F = face blocks, N = natural object blocks, M = manufactured object blocks, R = rest blocks. Intensity values of the time series were converted to percent signal change relative to the first volume so that the time series for the different age groups could be visualized on the same scale. Sample stimuli for each category are shown.

