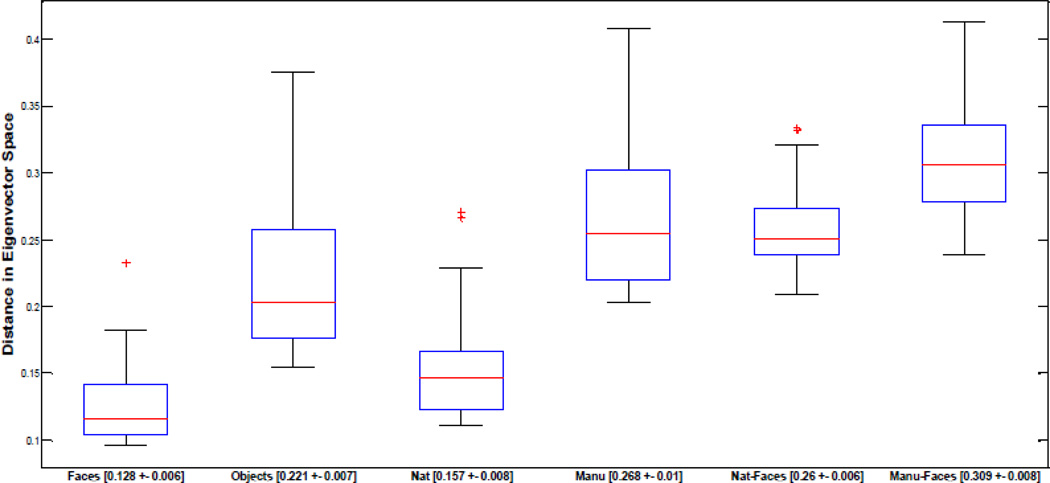
Figure 8.
Boxplots displaying medians (red line) and quartiles of the distributions for the distances of individual images to other images within the same class or to those images within another class in eigenvector space. Within-face distances (n=30) are significantly lower than within-object distances (n=60), within-natural distances (n=30) are significantly lower than within-manufactured distances (n=30). Mean distance between natural and face images (n=30) is significantly lower than the mean distance between manufactured and face images (n=30). All p-values are < 0.001. Outliers are indicated as red crosses and mean value and standard error for each condition are given on the x axis.

