Abstract
Nitric oxide (NO) signaling pathways mediate diverse physiological functions, including vasodilation and neurotransmission. Soluble guanylate cyclase (sGC), the primary NO receptor, triggers downstream signaling cascades by producing the second messenger cGMP. NO binds the sGC heme cofactor to stimulate cyclase activity, yet the molecular mechanisms of cyclase activation remain obscure. Although structural models of the individual sGC domains are available, the structure of the full sGC heterodimer is unknown. Understanding the higher-order domain architecture of sGC is a prerequisite to elucidating the mechanisms of NO activation. We used protein footprinting to map interdomain interaction surfaces of the sGC signaling domains. Hydrogen/deuterium exchange mass spectrometry revealed direct interactions between the Per/Arnt/Sim domain and the heme-associated signaling helix of the heme-NO/O2 binding (H-NOX) domain. Furthermore, interfaces between the H-NOX and catalytic domains were mapped using domain truncations and full-length sGC. The H-NOX domain buries surfaces of the α1 catalytic domain proximal to the cyclase active site, suggesting a signaling mechanism involving NO-induced derepression of catalytic activity. Together, our data reveal interdomain interactions responsible for communicating NO occupancy from H-NOX heme to the catalytic domain active site.
Keywords: HDX-MS, hemoprotein, gas receptor, nucleotide cyclase
The diatomic gas nitric oxide (NO) serves as a unique signaling molecule in mammalian physiology. NO signaling controls diverse circulatory and neural processes, including vasodilation, neurotransmission, myocardial function, and platelet aggregation (1, 2). Accordingly, disruptions in NO signaling have been linked to heart disease, erectile dysfunction, stroke, hypertension, and neurodegeneration (3, 4).
Soluble guanylate cyclase (sGC) is the primary cellular NO receptor (5, 6). sGC responds to NO with exquisite sensitivity, amplifying the signal to downstream effectors by catalyzing the formation of the second messenger cGMP from GTP. As a central arbiter of cGMP signaling, sGC represents an attractive target for therapeutic development. Indeed, several sGC stimulators are in clinical development for treatment of cardiovascular disease (7, 8).
NO binds to sGC through a ferrous heme cofactor. Formation of the NO-heme complex breaks the bond between the heme iron and the axial histidine ligand to initiate a largely uncharacterized conformational change that ultimately stimulates cyclase activity several hundred fold.
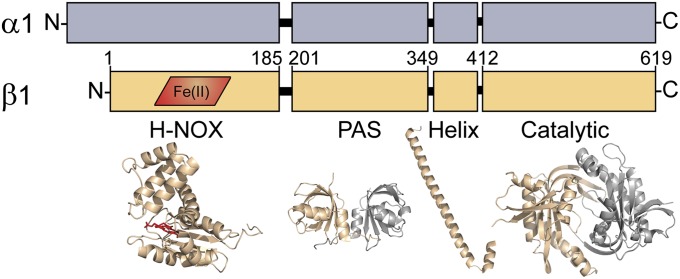
The predominant and best-characterized sGC isoform is a heterodimeric hemoprotein composed of two homologous subunits: α1 and β1. Each subunit is composed of four domains: an N-terminal receptor domain, a Per/Arnt/Sim (PAS)-like domain, an amphipathic helix, and a C-terminal catalytic domain (Fig. 1). The N-terminal domain of the β1 subunit shares sequence homology with a broader family of gas sensors dubbed heme-NO/O2 binding (H-NOX) domains (9, 10). The corresponding domain of the α1 subunit is a degenerate H-NOX that does not bind heme, and its function remains unclear. The sGC PAS and helical domains are involved in heterodimer formation and play ambiguous roles in cyclase activation (11–13). The C-terminal catalytic domains encompass the cyclase active site (14). The active site is formed between the α1 and β1 catalytic domains, with residues from both subunits contributing to catalysis.
Fig. 1.
Domain organization of sGC subunits. Each sGC subunit, α1 (gray) and β1 (tan), is composed of four modular domains. The H-NOX domain of the β1 subunit contains the heme cofactor (red). Amino acid numberings approximate the boundaries of the β1 domains. The H-NOX structure is modeled from a standalone H-NOX from Nostoc sp. PCC 7120 (33% identity, PDB: 2O09) (10). The representative PAS domain is from Nostoc punctiforme histidine kinase (35% identity, PDB: 2P04) (12). The helical domain (PDB: 3HLS) and catalytic domain (PDB: 3UVJ) are crystallized truncations of sGC from Rattus norvegicus and Homo sapiens, respectively (13).
The molecular mechanism by which NO occupancy of the sGC heme controls cyclase activity remains a central question in sGC/NO signaling. NO-induced activation presumably occurs via conformational changes communicated from the sGC heme to the catalytic domain. However, this regulatory mechanism remains poorly understood largely because the domain architecture of the full enzyme heterodimer is unknown. Although the structure of full-length sGC remains undetermined, high-resolution structures have been reported for sGC domain truncations and homologs (Fig. 1). We sought to gain insight into the structural organization of the sGC holoenzyme by studying the interactions of its isolated domains.
To explore the higher-order architecture of sGC, we used protein footprinting strategies amenable to mapping interdomain interactions. Protein footprinting reports on the solvent accessibility and local chemical environment of protein residues by monitoring their susceptibility to chemical modification. Changes in the propensity for modification at particular protein regions can be mapped to define conformational changes, domain interactions, and protein–protein interactions. Hydrogen/deuterium exchange MS (HDX-MS) is a widely used footprinting technique that relies on measuring the rate of exchange of peptide bond amide protons with the deuterons of a D2O solvent (15–17). Residues buried by protein interactions or conformational changes are detected as decreases in exchange rates. Here, we report results of HDX-MS studies to map interactions between functional sGC domain truncations. Interaction surfaces link heme-associated H-NOX surfaces with the PAS domain. Furthermore, the H-NOX–PAS domains jointly impact regulatory lobes of the catalytic domain. Taken together, the interdomain interaction footprints reveal a potential allosteric pathway by which NO occupancy of the H-NOX heme is communicated to the catalytic domain active site.
Results
H-NOX—PAS Domain Interactions.
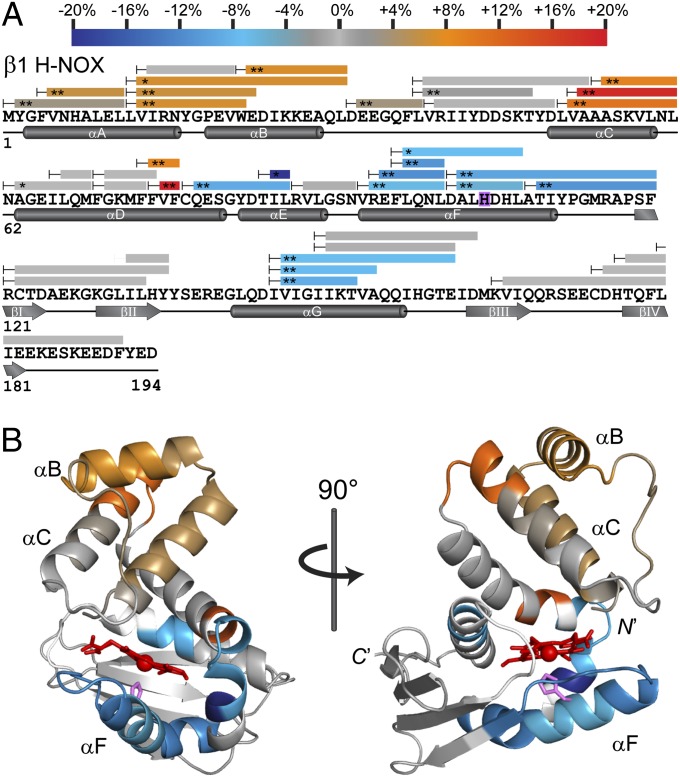
NO interacts with sGC via the heme cofactor of the N-terminal β1 H-NOX domain, initiating conformational changes that ultimately activate the C-terminal catalytic domain. The two intervening domains, PAS and helical, likely participate in communicating the heme occupancy state through the enzyme. Accordingly, we reasoned that direct interactions between the H-NOX and PAS domains could propagate conformational changes to the catalytic domain. To assess H-NOX–PAS interactions, HDX-MS was used to compare the surface accessibility of two truncations of sGC: β1[1-194], the minimal, monomeric H-NOX domain, and homodimeric β1[1-385], which contains the full H-NOX and PAS domains and a portion of the helical domain (9, 18) (Fig. 1). H-NOX surfaces buried by dimerization and/or PAS domain interaction are predicted to exchange more slowly in the β1[1-385] construct. Hydrogen/deuterium (H/D) exchange was initiated by diluting each H-NOX construct into buffered D2O. At various time points, samples were quenched with acid and digested into uniquely identifiable peptide fragments with pepsin. Deuterium incorporation was assessed by reversed-phase LC-MS. Exchange time courses for each identified H-NOX peptide are shown in Fig. S1. Overall sequence coverage (∼90%) and exchange rate differences between β1[1-194] and β1[1-385] were mapped to the primary amino acid sequence (Fig. 2A). The amino acid resolution of HDX-MS is limited by the length and overlap of the peptide products, and observed rate changes may be attributable to subsections of the peptide.
Fig. 2.
Comparison of HDX-MS exchange kinetics of H-NOX (β1[1-194]) vs. H-NOX-PAS (β1[1-385]). (A) Peptide coverage from HDX-MS analysis is represented by bars superimposed over primary sequence with secondary structural features annotated below. H-NOX peptides exhibiting significant exchange rate differences due to inclusion of the PAS domain are color-coded according to the scale bar. Exchange rate changes are calculated as the average differences between %D incorporation over the actively exchanging portion of the time course. Peptides exchanging more slowly in β1[1-385] are in the blue color range, whereas peptides exchanging more rapidly are in the red color range. The axial heme ligand His-105 is highlighted in purple. Asterisks denote the results of two-tailed, unpaired t tests: *P < 0.01; **P < 0.005. Peptides exhibiting nonsignificant changes (P > 0.01) are colored gray. (B) Color-coded HDX-MS results were mapped to a model of the sGC β1 H-NOX derived from the Nostoc sp. PCC 7120 H-NOX. Heme (red) and His-105 (purple) are represented as sticks. Regions lacking HDX-MS peptide coverage are colored white.
Mapping H-NOX accessibility and dynamic changes induced by PAS domain.
H-NOX regions exhibiting significant PAS-dependent exchange rate differences cluster to two main regions. First, multiple overlapping peptides demonstrate that the helices of the N-terminal lobe (αA-C) undergo increased exchange rates in the β1[1-385] construct (Fig. 2B). Increased exchange at the N terminus is consistent with greater local dynamics and may be relevant to the signaling state of the H-NOX domain. Indeed, shifting of the H-NOX N-terminal lobe relative to the C terminus is implicated in signal-initiating conformational changes in bacterial H-NOX domains (19). Alternatively, the increased dynamics may be a consequence of the PAS domain–mediated homodimerization of the β1[1-385] construct (18). Contact between homodimerized H-NOX domains may perturb the N terminus.
The second H-NOX region perturbed by inclusion of the PAS domain centers on the αF helix associated with the heme cofactor (Fig. 2B). This “signaling helix” contains His-105, the axial ligand of the heme iron. Notably, NO-binding breaks the Fe(II)-His bond, liberating the signaling helix (19, 20). Both the signaling helix and the flanking αF-βI surface loop are significantly protected from exchange when tethered to the PAS domain. The decrease in exchange may be attributable to localized stabilization of secondary structure. Nevertheless, given the apparent lack of alternative interfaces, direct burial seems likely. Because the β1[1-385] construct is a homodimer, either PAS or interdimeric H-NOX interactions may be responsible for the increased protection. PAS domain interaction seems more probable, as isolated H-NOX domains exhibit no apparent affinity (9). Taken together, these results indicate that the PAS domain either directly interacts with the signaling helix or strongly influences local structure around the heme. Regardless, the PAS domain is poised to propagate NO-induced conformational changes.
Probing H-NOX interfaces with disruptive residue substitutions.
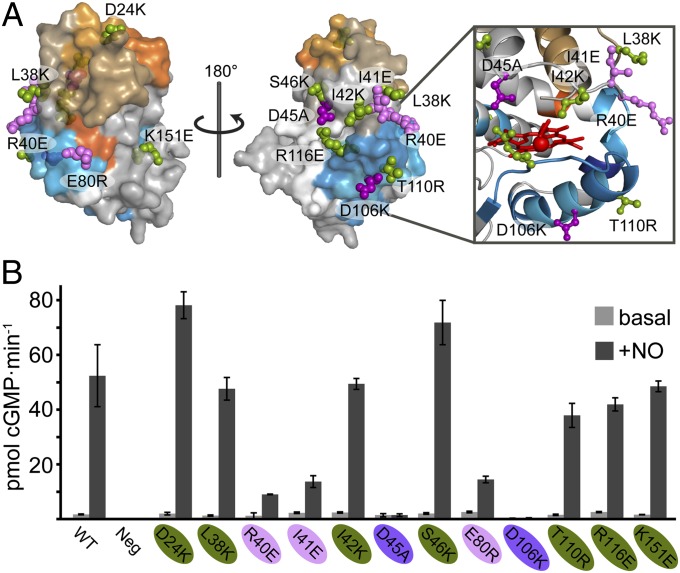
The associations between the H-NOX signaling helix and PAS domain begin to define an interdomain allosteric pathway for regulating cyclase activity. However, functionally important H-NOX interactions likely extend beyond the PAS domain footprint. Indeed, several studies indicate direct H-NOX domain contacts with the catalytic domain (14, 21). To explore further the functional importance of interdomain interactions of the H-NOX, site-directed mutagenesis was used to introduce potentially disruptive side chain substitutions in full-length sGC. Altering residues that directly contribute to the allosteric pathway is expected to disrupt NO stimulation. Residues were selected to test H-NOX interaction surfaces identified by HDX-MS, as well as bordering surfaces that may be involved in interactions with either the helical or catalytic domain. Several previous sGC mutagenesis studies were also available to guide residue selection (20, 22, 23). Twelve sGC α1β1 H-NOX variants along with the WT and negative control (β1 subunit without α1) were engineered and expressed in small Sf9 cell cultures (Fig. 3A). Catalytic activity of the basal (i.e., unstimulated) and NO-stimulated enzyme were assessed with cGMP-specific enzyme immunoassays (EIAs; Fig. 3B).
Fig. 3.
Survey of basal and NO-stimulated cyclase activity of H-NOX variants. (A) H-NOX variants were designed to probe regions implicated in interactions and/or conformational changes in the presence of the PAS domain. Mutated residues are shown on a surface model of sGC β1 H-NOX derived from the Nostoc sp. PCC 7120 H-NOX. Residues are color-coded based on results of activity assays, as in B. (B) WT, negative control (β1 sGC subunit alone), or H-NOX variants of full-length α1β1 sGC were enriched from Sf9 cell lysates. Cyclase activity of both basal (i.e., minus NO) or NO-stimulated enriched sGC was assayed with cGMP-specific EIA and normalized to WT expression levels. Error bars represent the SD of three experimental replicates. Variants exhibiting similar NO-stimulated activity to WT, moderately reduced activity (<30% of WT), or highly reduced activity (<5% of WT) are color-coded green, pink, and purple, respectively.
Variants of sGC exhibiting little change in either basal or NO-stimulated activity largely localize to the N-terminal region, outside of the PAS domain footprint. The exceptions, T110R and R116E, reside on the periphery of the interface; the side chains of these residues may extend away from the H-NOX–PAS interaction. Interestingly, alanine substitution at T110 has been reported to elevate basal activity (22). The D106K variant exhibited the greatest impairment of activity (>500-fold inhibition). Accordingly, D106 resides in the middle of the H-NOX–PAS domain interface. Mutation of several clustered residues (I41E, R40E, and D45A) in the N-terminal lobe also substantially reduces NO stimulation of cyclase activity. The I41E, R40E, and D45A variants colocalize to the αB-αC loop overlaying the heme pocket (Fig. 3A, Inset). These results agree well with previous alanine scanning studies that revealed the functional importance of the αB-αC loop (20, 22). HDX-MS results showed little significant perturbations to the αB-αC loop due to the PAS domain (Fig. 2A). Taken together, these results suggest that the αB–αC loop participates in regulatory interactions with the catalytic domain.
Catalytic Domain Interactions.
The sGC catalytic domain is composed of the C-terminal domains of the α1 and β1 subunits, with both subunits contributing essential active-site residues. Catalytic domain truncations, α1[467-690] and β1[414-619], can be expressed independently and recombined to reconstitute cyclase activity (14). Direct interactions between the sGC H-NOX/PAS and catalytic domain are thought to be responsible for regulating cyclase activity. In fact, coincubation of the catalytic domain truncations (αβcat) with H-NOX truncations represses cyclase activity, suggesting an autoinhibitory regulatory role for the sGC H-NOX (14). Furthermore, the β1[1-385] construct inhibits αβcat more potently than the shorter β1[1-194] truncation, indicating that the PAS domain and/or dimerization contribute to repression of catalytic domain activity. To explore the mechanisms underlying autoinhibition of the catalytic domain, HDX-MS was used to map catalytic domain surfaces buried by regulatory domain interactions.
Mapping αβcat interactions with β1[1-385].
When added in trans, several molar equivalents of H-NOX domain are required to inhibit αβcat activity. To ensure detectable interactions via HDX-MS, the concentration dependence of β1[1-385] inhibition of αβcat activity was determined (Fig. S2). A 10-fold molar excess of β1[1-385] over αβcat inhibited cyclase activity by more than 70%. H/D exchange time courses (10 time points in triplicate, ranging from 5 s to 60 min) were performed comparing αβcat alone vs. αβcat incubated with 10 molar equivalents of β1[1-385] (see Fig. S3 for full exchange time course plots).
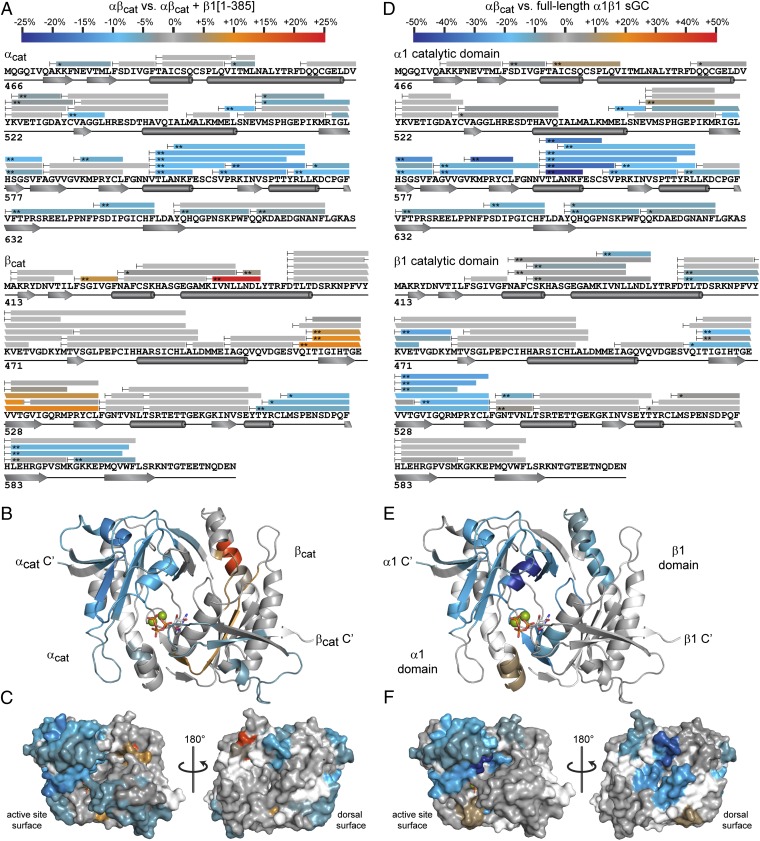
Peptide coverage was plotted to primary amino acid sequence for both αcat and βcat (Fig. 4A). β1[1-385]–induced changes in the extent of exchange (Δ%D) were color-coded and mapped to both primary sequence and structure of αβcat (Fig. 4 A and B). The two catalytic domain subunits exhibit asymmetries in β1[1-385]–dependent exchange rate effects. The C-terminal third of the αcat subunit exhibits extensively reduced exchange rates. On the other hand, the βcat subunit contains far fewer peptide fragments displaying lower exchange rates, and conversely, undergoes increased exchange in two discrete regions.
Fig. 4.
Mapping interdomain interactions of the sGC catalytic domains with HDX-MS. (A) Comparison of HDX-MS exchange kinetics of αβcat in the presence or absence of a 10-fold molar excess of β1[1-385]. Peptide coverage is represented by bars superimposed over catalytic domain primary sequence annotated with secondary structural features. Regions of αβcat exhibiting exchange rate differences (Δ%D) induced by β1[1-385] are color-coded according to the scale bar (*P < 0.01, **P < 0.005; two-tailed, unpaired t test). Peptides exchanging more slowly in the presence of β1[1-385] are color-coded in the blue range, whereas peptides exchanging more rapidly are in the red range. Peptides exhibiting nonsignificant changes (P > 0.01) are colored gray. (B) Exchange rate differences of αβcat induced by addition of β1[1-385] are mapped to the structure of human αβcat. Regions lacking peptide coverage are colored white. (C) Surface representations of αβcat were color-coded as in B to highlight potential interdomain interfaces with H-NOX and PAS domains. (D) Comparison of HDX-MS exchange kinetics of αβcat vs. the α1β1 catalytic domain in the context of full-length sGC. Exchange rate differences are denoted as in A with color bar rescaled to accommodate the larger magnitude changes in full-length sGC. Catalytic domain regions exchanging more slowly in full-length sGC than in the free αβcat truncation are scaled in shades of blue. (E) Likewise, rate differences between free αβcat and the catalytic domain of full-length sGC are color-coded and mapped to the αβcat structure. (F) Results in D were mapped to surface representations of the catalytic domains.
Mapped to the structure of the human αβcat, the regions protected by β1[1-385] cluster to one prominent lobe bordering the active site pocket (Fig. 4B). The smaller region of protected surface on the βcat subunit also envelops the active site pocket. Interestingly, most of the αβcat surfaces affected by the β1[1-385] interaction surround the active site, leaving the opposite surface largely unaffected (Fig. 4C, Right).
Mapping catalytic domain interactions in full-length sGC.
Comparing domain truncations interacting in trans is invaluable for isolating domain-specific contributions to the architecture of the sGC holoenzyme. Nevertheless, isolated truncations are unrestrained by the linkers and intervening domains that constitute the native sGC heterodimer. We sought to examine regulatory interactions with the catalytic domain in the context of full-length α1β1 sGC. The interaction surfaces of the catalytic domain in the native enzyme can be revealed by comparing the intrinsic solvent accessibility of the isolated αβcat vs. the catalytic domain ensconced within the sGC holoenzyme.
Full-length sGC presents additional challenges to HDX-MS analysis. The large size (∼150 kDa) and limited protein expression are potential complications for HDX-MS analysis. Nevertheless, high-resolution Orbitrap LC-MS afforded excellent sequence coverage, and large magnitude changes in exchange rates between free αβcat and full-length sGC were strikingly evident (Fig. 4C; Fig. S4). Unsurprisingly, the catalytic domain tethered within the full sGC holoenzyme exhibited larger exchange rate perturbations compared with αβcat incubated with free β1[1-385]. Magnitude differences aside, comparing αβcat vs. β1[1-385] with αβcat vs. full-length sGC reveals interesting parallels. Much like incubation with β1[1-385], full-length sGC buries catalytic domain surfaces surrounding the active site (Fig. 4D). Again, the regions exhibiting the most conspicuously slowed exchange rates cluster to the C-terminal lobe of the α1 catalytic subunit. The majority of the β1 catalytic subunit remains unaffected by inclusion of the full sGC. However, full-length sGC does appear to bury small regions of both α1 and β1 on the “dorsal” catalytic domain surface, opposite the active site (Fig. 4F). This region corresponds to the attachment point of the helical domains. Burial at the dorsal surface may be attributable to catalytic–helical domain interactions. Accordingly, this interface is not evident in the interactions with β1[1-385], which lacks the C-terminal helical domain (Fig. 4C).
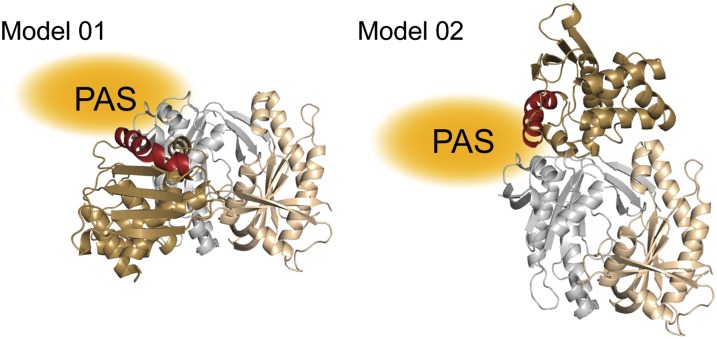
Previous reports on the higher-order architecture of sGC position the NO sensor H-NOX domain in contact with the catalytic domains (10, 14, 21, 22). Nevertheless, the structural details of this crucial regulatory interaction remain ambiguous. To explore possible modes of interaction between H-NOX and catalytic domains, a homology-based model of β1 H-NOX and the structure of human αβcat were docked using the ClusPro server (24, 25). HDX-MS and mutagenesis results were factored into the modeling as attraction and repulsion constraints. The top 10 balanced models were evaluated for conformations that satisfy experimental constraints. The two best models are shown in Fig. 5. Both models allow for mutual contacts between H-NOX–PAS and H-NOX–catalytic domains. Notably, the heme-associated signaling helices of both models are poised to allow simultaneous PAS domain interaction and proximity to the proposed regulatory α1 lobe.
Fig. 5.
Modeling the H-NOX–catalytic domain interface. The model of sGC β1 H-NOX (based on Nostoc sp. PCC 7120 H-NOX) and structure of truncated human catalytic domain were submitted to the ClusPro 2.0 server (24, 25). Collected HDX-MS results served as attraction and repulsion restraints (SI Materials and Methods). ClusPro models representative of the two most highly populated classes of interdomain interactions are pictured with β1 H-NOX (brown with red “signaling helix”), α1 (gray), and β1 (tan) catalytic domain subunits. Hypothetical PAS domain locations are noted in orange.
Taken together, the parallel HDX-MS experiments comparing catalytic domain interfaces both point to a regulatory role for the C-terminal subdomain of the α1 catalytic subunit. Importantly, this region folds over to adjoin the loops containing the two catalytic Mg2+-binding Asp residues and has implications for catalytic regulation (discussed below).
Discussion
Interdomain Interactions of sGC H-NOX and PAS Domains.
HDX-MS revealed H-NOX–PAS domain interactions encompassing the signaling helix (αF) with likely implications for interdomain conformational changes. On NO binding to the sGC heme, the bond to the axial His-105 ligand breaks. Consequently, heme distortion is relieved, and the newly freed signaling helix rearranges conformation (10, 19, 20). Stabilization of local structure may also contribute to the observed protection of the signaling helix, potentially expanding the extent of the affected surface. In addition, due to the intrinsic affinity of the β1 PAS domain, homodimerization of β1[1-385] may also influence local structure. Nevertheless, inclusion of the PAS domain strongly influences the heme-associated helix, likely exerted, in part, by direct interaction. With the PAS domain abutting the signaling helix, the NO-induced conformational change is likely propagated through the PAS domain on to the catalytic domain. Indeed, mutational screens have implicated several PAS domain residues in NO activation of sGC (12).
The surfaces of sGC H-NOX responsible for interdomain communication also extend beyond the signaling helix. Mutagenesis studies demonstrate a functional role for the αB–αC loop and contiguous surfaces (20, 22). The observation that β1[1-194] represses αβcat activity in trans also indicates that direct H-NOX–catalytic domain interactions contribute to cyclase regulation. Nevertheless, the isolated H-NOX represses αβcat activity far less potently than the H-NOX–PAS construct (14). Taken together, these studies suggest that cooperative interdomain interactions involving both H-NOX and PAS domains regulate sGC catalytic activity.
Interdomain Interactions of the sGC Catalytic Domain.
The results of our HDX-MS investigations implicate defined, contiguous catalytic domain surfaces engaged in interdomain interactions in both αβcat and full-length sGC. Specifically, the β1 H-NOX and/or PAS domain bury the C-terminal lobe of the α1 catalytic domain. The proximity of the affected surfaces to the sGC active site suggests a role in controlling cyclase activity. Although αβcat surfaces buried by β1[1-385] largely localize to the αcat domain, subtle decreases in exchange rate were also observed in the βcat subunit. β1[1-385] interactions with βcat are confined to a C-terminal feature, pseudosymmetrical to the buried lobe of αcat. However, buried β1 catalytic subunit surfaces were not evident in full-length sGC. The homodimerized β1 H-NOX domains of β1[1-385] may bury more surface area than the full-length sGC, which substitutes a pseudo–H-NOX in the α1 subunit.
Comparing our HDX-MS results with the proposed activation mechanisms of adenylate cyclase (AC) yields insights into the regulation of sGC activity. The sGC catalytic domain shares the overall dimeric, wreath-like protein fold as AC and may undergo similar conformational changes (26). AC is activated on interaction with the α subunit of a heterotrimeric G protein (Gsα). Stimulation of cyclase activity involves closing the active site (e.g., the P-site lid) to position two catalytic aspartate residues into coordination with the Mg2+-triphosphate of the ATP substrate (27–29). The active AC conformation is represented by the costructure of the AC catalytic domain and Gsα, a stimulatory G protein (30). The inactive conformation is thought to resemble the structure of a low-activity homodimeric catalytic domain. Activation of AC is proposed to involve an ∼7° rotation between the two subunits to enclose the substrate within the P site (29, 30).
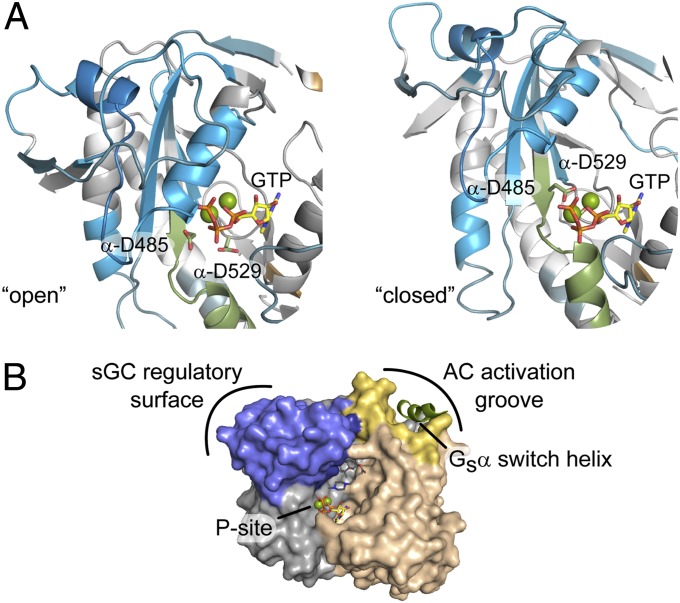
To explore activation mechanisms of sGC catalytic domains, the interdomain interactions determined by HDX-MS were mapped to models of active and inactive sGC (Fig. 6A). Inactive sGC, represented by an “open” structure of the human sGC catalytic domain, exhibits a relatively compacted α1 C-terminal lobe (Fig. 6A, Left). Consequently, the P-site lid is pushed open, displacing the catalytic aspartate residues (D485 and D529) away from the modeled substrate triphosphate. In contrast, a model of activated sGC catalytic domain based on AC demonstrates a realignment of the α1 lobe, drawing the catalytic aspartate residues into coordination with Mg2+-triphosphate (Fig. 6A, Right).
Fig. 6.
Conformational changes involved in catalytic domain activation. (A) HDX-MS results (αβcat vs. αβcat+β1[1-385]) mapped to two proposed activity-related conformations of nucleotide cyclases: the putatively inactive conformation (Left, PDB: 3UVJ) and a model of sGC catalytic domains based on an active adenylate cyclase structure (Right, PDB: 1AZS). The two conformations were aligned via the β1 subunit alone using PyMol. The P-site lid is colored drab green. Mg2+-coordinating, active-site aspartate residues (α-D485 and α-D529) are highlighted as sticks. (B) Regulatory surfaces of sGC and AC mapped to activated AC bound to Gsα (PDB: 1AZS). Buried sGC surfaces identified by HDX-MS are mapped to the homologous regions of AC in blue. The activation groove of AC is colored yellow with the bound Gsα helix in green. The rest of Gsα is omitted for clarity.
Interestingly, the sGC regulatory interfaces identified herein differ from those of AC. Although HDX-MS implicates the C-terminal α1 lobe in sGC regulation, the costructure of AC catalytic domain with Gsα demonstrates a stimulatory role for an N-terminal groove in the subunit corresponding to β1 sGC subunit (Fig. 6B). Sprang and coworkers (30) proposed that binding of Gsα to the AC groove favors the closed catalytic domain conformation, thereby orienting the P site lid into the catalytically competent position. Likewise, activation of sGC may proceed via an analogous intersubunit “closing” mechanism, albeit by relieving repressive interactions through an opposing surface (Movie S1).
The results of these mapping studies suggest mechanisms by which NO binding to the sGC N-terminal H-NOX controls cyclase activity at the C terminus. We anticipate that future structural investigations will address remaining questions. For instance, the interdomain interactions of the α1 pseudo–H-NOX and helical domains remain to be elucidated. Nevertheless, the interdomain interactions defined herein highlight an allosteric pathway through which the sGC heme can communicate with the cyclase active site. These HDX-MS results, in conjunction with high-resolution structural investigations (10, 12–14, 19), contribute toward building a model of the sGC holoenzyme (8). Ultimately, a refined model of the higher-order architecture of sGC will empower the development of next-generation therapeutics targeting sGC.
Materials and Methods
HDX-MS Analysis.
β1[1-194], β1[1-385] (18), αcat/βcat (14), and full-length sGC (31) were purified as previously described with modifications detailed in SI Materials and Methods. H/D exchange was performed as three independent time courses for each treatment. Protein stocks were diluted into buffered D2O (pD 8.0, 25 °C) to initiate exchange. Aliquots were withdrawn at various time points, quenched to pH 2.5 with trifluoroacetic acid, and frozen. Rapidly thawed samples were digested (3 min, pH 2.5, 4 °C) with immobilized pepsin (Pierce), frozen in LC-MS vials, and stored at −80 °C until MS analysis. Mass spectra for β1[1-194] and β1[1-385] samples were collected on an Agilent 1100/Waters LCT Premier XE LC-MS. Full-length sGC and αβcat were analyzed on an Agilent 1200/Thermo Fisher Scientific LTQ Orbitrap XL LC-MS. C8 columns were maintained at 4 °C throughout LC-MS analysis. HDX-MS data were analyzed using HX Express (32) and HDX Workbench (33) software for β1[1-194]/β1[1-385] and αβcat experiments, respectively (Fig. S5).
Cyclase Activity Assays.
Recombinant, His6-tagged H-NOX variants of sGC were expressed in 25 mL Sf9 cell culture using the Bac-to-Bac baculovirus expression system (Invitrogen). sGC variants were enriched from Sf9 cell lysates using magnetic Ni-NTA agarose beads (Qiagen). Cyclase activity was assayed in triplicate in the presence or absence of 130 μM DEA-NONOate at 25 °C. Endpoint activity assays were initiated with 2 mM GTP and quenched after 6 min. The cGMP product was quantified using the cGMP EIA kit (Enzo Life Sciences), per the manufacturer’s instructions.
Full experimental details are described in SI Materials and Methods.
Supplementary Material
Acknowledgments
We thank Bruce Pascal, Michael Chalmers, and Patrick Griffin (Scripps Florida) for data analysis advice and HDX Workbench software assistance. LC-MS/MS instrumentation was acquired with National Institutes of Health (NIH) support (Grant 1S10RR022393-01). E.S.U. received financial support from NIH Postdoctoral Fellowship 5F32GM093564. This is The Scripps Research Institute Manuscript 22075.
Footnotes
The authors declare no conflict of interest.
This article is a PNAS Direct Submission.
This article contains supporting information online at www.pnas.org/lookup/suppl/doi:10.1073/pnas.1301934110/-/DCSupplemental.
References
- 1.Lucas KA, et al. Guanylyl cyclases and signaling by cyclic GMP. Pharmacol Rev. 2000;52(3):375–414. [PubMed] [Google Scholar]
- 2.Garthwaite J. Concepts of neural nitric oxide-mediated transmission. Eur J Neurosci. 2008;27(11):2783–2802. doi: 10.1111/j.1460-9568.2008.06285.x. [DOI] [PMC free article] [PubMed] [Google Scholar]
- 3.Bredt DS. Endogenous nitric oxide synthesis: Biological functions and pathophysiology. Free Radic Res. 1999;31(6):577–596. doi: 10.1080/10715769900301161. [DOI] [PubMed] [Google Scholar]
- 4.Friebe A, Mergia E, Dangel O, Lange A, Koesling D. Fatal gastrointestinal obstruction and hypertension in mice lacking nitric oxide-sensitive guanylyl cyclase. Proc Natl Acad Sci USA. 2007;104(18):7699–7704. doi: 10.1073/pnas.0609778104. [DOI] [PMC free article] [PubMed] [Google Scholar]
- 5.Derbyshire ER, Marletta MA. Structure and regulation of soluble guanylate cyclase. Annu Rev Biochem. 2012;81(1):533–559. doi: 10.1146/annurev-biochem-050410-100030. [DOI] [PubMed] [Google Scholar]
- 6.Koesling D, Russwurm M, Mergia E, Mullershausen F, Friebe A. Nitric oxide-sensitive guanylyl cyclase: Structure and regulation. Neurochem Int. 2004;45(6):813–819. doi: 10.1016/j.neuint.2004.03.011. [DOI] [PubMed] [Google Scholar]
- 7.Evgenov OV, et al. NO-independent stimulators and activators of soluble guanylate cyclase: Discovery and therapeutic potential. Nat Rev Drug Discov. 2006;5(9):755–768. doi: 10.1038/nrd2038. [DOI] [PMC free article] [PubMed] [Google Scholar]
- 8.Stasch JP, Pacher P, Evgenov OV. Soluble guanylate cyclase as an emerging therapeutic target in cardiopulmonary disease. Circulation. 2011;123(20):2263–2273. doi: 10.1161/CIRCULATIONAHA.110.981738. [DOI] [PMC free article] [PubMed] [Google Scholar]
- 9.Karow DS, et al. Characterization of functional heme domains from soluble guanylate cyclase. Biochemistry. 2005;44(49):16266–16274. doi: 10.1021/bi051601b. [DOI] [PMC free article] [PubMed] [Google Scholar]
- 10.Ma X, Sayed N, Beuve A, van den Akker F. NO and CO differentially activate soluble guanylyl cyclase via a heme pivot-bend mechanism. EMBO J. 2007;26(2):578–588. doi: 10.1038/sj.emboj.7601521. [DOI] [PMC free article] [PubMed] [Google Scholar]
- 11.Rothkegel C, et al. Dimerization region of soluble guanylate cyclase characterized by bimolecular fluorescence complementation in vivo. Mol Pharmacol. 2007;72(5):1181–1190. doi: 10.1124/mol.107.036368. [DOI] [PubMed] [Google Scholar]
- 12.Ma X, Sayed N, Baskaran P, Beuve A, van den Akker F. PAS-mediated dimerization of soluble guanylyl cyclase revealed by signal transduction histidine kinase domain crystal structure. J Biol Chem. 2008;283(2):1167–1178. doi: 10.1074/jbc.M706218200. [DOI] [PMC free article] [PubMed] [Google Scholar]
- 13.Ma X, Beuve A, van den Akker F. Crystal structure of the signaling helix coiled-coil domain of the beta1 subunit of the soluble guanylyl cyclase. BMC Struct Biol. 2010;10:2. doi: 10.1186/1472-6807-10-2. [DOI] [PMC free article] [PubMed] [Google Scholar]
- 14.Winger JA, Marletta MA. Expression and characterization of the catalytic domains of soluble guanylate cyclase: Interaction with the heme domain. Biochemistry. 2005;44(10):4083–4090. doi: 10.1021/bi047601d. [DOI] [PubMed] [Google Scholar]
- 15.Chalmers MJ, Busby SA, Pascal BD, West GM, Griffin PR. Differential hydrogen/deuterium exchange mass spectrometry analysis of protein-ligand interactions. Expert Rev Proteomics. 2011;8(1):43–59. doi: 10.1586/epr.10.109. [DOI] [PMC free article] [PubMed] [Google Scholar]
- 16.Wales TE, Engen JR. Hydrogen exchange mass spectrometry for the analysis of protein dynamics. Mass Spectrom Rev. 2006;25(1):158–170. doi: 10.1002/mas.20064. [DOI] [PubMed] [Google Scholar]
- 17.Englander SW. Hydrogen exchange and mass spectrometry: A historical perspective. J Am Soc Mass Spectrom. 2006;17(11):1481–1489. doi: 10.1016/j.jasms.2006.06.006. [DOI] [PMC free article] [PubMed] [Google Scholar]
- 18.Zhao Y, Marletta MA. Localization of the heme binding region in soluble guanylate cyclase. Biochemistry. 1997;36(50):15959–15964. doi: 10.1021/bi971825x. [DOI] [PubMed] [Google Scholar]
- 19.Erbil WK, Price MS, Wemmer DE, Marletta MA. A structural basis for H-NOX signaling in Shewanella oneidensis by trapping a histidine kinase inhibitory conformation. Proc Natl Acad Sci USA. 2009;106(47):19753–19760. doi: 10.1073/pnas.0911645106. [DOI] [PMC free article] [PubMed] [Google Scholar]
- 20.Martin F, et al. Structure of cinaciguat (BAY 58-2667) bound to Nostoc H-NOX domain reveals insights into heme-mimetic activation of the soluble guanylyl cyclase. J Biol Chem. 2010;285(29):22651–22657. doi: 10.1074/jbc.M110.111559. [DOI] [PMC free article] [PubMed] [Google Scholar]
- 21.Haase T, Haase N, Kraehling JR, Behrends S. Fluorescent fusion proteins of soluble guanylyl cyclase indicate proximity of the heme nitric oxide domain and catalytic domain. PLoS ONE. 2010;5(7):e11617. doi: 10.1371/journal.pone.0011617. [DOI] [PMC free article] [PubMed] [Google Scholar]
- 22.Baskaran P, Heckler EJ, van den Akker F, Beuve A. Identification of residues in the heme domain of soluble guanylyl cyclase that are important for basal and stimulated catalytic activity. PLoS ONE. 2011;6(11):e26976. doi: 10.1371/journal.pone.0026976. [DOI] [PMC free article] [PubMed] [Google Scholar]
- 23.Baskaran P, Heckler EJ, van den Akker F, Beuve A. Aspartate 102 in the heme domain of soluble guanylyl cyclase has a key role in NO activation. Biochemistry. 2011;50(20):4291–4297. doi: 10.1021/bi2004087. [DOI] [PMC free article] [PubMed] [Google Scholar]
- 24.Comeau SR, Gatchell DW, Vajda S, Camacho CJ. ClusPro: A fully automated algorithm for protein-protein docking. Nucleic Acids Res. 2004;32(Web Server issue, Suppl 2):W96-9. doi: 10.1093/nar/gkh354. [DOI] [PMC free article] [PubMed] [Google Scholar]
- 25.Kozakov D, et al. Achieving reliability and high accuracy in automated protein docking: Cluspro, PIPER, SDU, and stability analysis in CAPRI rounds 13–19. Proteins Struct Funct. Bioinform. 2010;78(15):3124–3130. doi: 10.1002/prot.22835. [DOI] [PMC free article] [PubMed] [Google Scholar]
- 26.Winger JA, Derbyshire ER, Lamers MH, Marletta MA, Kuriyan J. The crystal structure of the catalytic domain of a eukaryotic guanylate cyclase. BMC Struct Biol. 2008;8:8. doi: 10.1186/1472-6807-8-42. [DOI] [PMC free article] [PubMed] [Google Scholar]
- 27.Hurley JH. Structure, mechanism, and regulation of mammalian adenylyl cyclase. J Biol Chem. 1999;274(12):7599–7602. doi: 10.1074/jbc.274.12.7599. [DOI] [PubMed] [Google Scholar]
- 28.Tesmer JJG, et al. Two-metal-Ion catalysis in adenylyl cyclase. Science. 1999;285(5428):756–760. doi: 10.1126/science.285.5428.756. [DOI] [PubMed] [Google Scholar]
- 29.Linder JU, Schultz JE. Versatility of signal transduction encoded in dimeric adenylyl cyclases. Curr Opin Struct Biol. 2008;18(6):667–672. doi: 10.1016/j.sbi.2008.11.008. [DOI] [PubMed] [Google Scholar]
- 30.Tesmer JJG, Sunahara RK, Gilman AG, Sprang SR. Crystal structure of the catalytic domains of adenylyl cyclase in a complex with Gsalpha.GTPgammaS. Science. 1997;278(5345):1907–1916. doi: 10.1126/science.278.5345.1907. [DOI] [PubMed] [Google Scholar]
- 31.Winger JA, Derbyshire ER, Marletta MA. Dissociation of nitric oxide from soluble guanylate cyclase and heme-nitric oxide/oxygen binding domain constructs. J Biol Chem. 2007;282(2):897–907. doi: 10.1074/jbc.M606327200. [DOI] [PubMed] [Google Scholar]
- 32.Weis DD, Engen JR, Kass IJ. Semi-automated data processing of hydrogen exchange mass spectra using HX-Express. J Am Soc Mass Spectrom. 2006;17(12):1700–1703. doi: 10.1016/j.jasms.2006.07.025. [DOI] [PubMed] [Google Scholar]
- 33.Pascal BD, et al. HDX workbench: Software for the analysis of H/D exchange MS data. J Am Soc Mass Spectrom. 2012;23(9):1512–1521. doi: 10.1007/s13361-012-0419-6. [DOI] [PMC free article] [PubMed] [Google Scholar]
Associated Data
This section collects any data citations, data availability statements, or supplementary materials included in this article.


