Abstract
The present study aimed at identifying early damage index in the cerebellum following total body irradiation (TBI). Adult male CD2F1 mice (n=18) with or without TBI challenge (8.5 Gy irradiation) were assessed for histology and expression of selected immunohistochemical markers including malondiadehyde (MDA), 8-hydroxy-2′-deoxyguanosine (8-OHdG), protein 53 (p53), vascular endothelial growth factor receptor 2 (VEGF-R2), CD45, calbindin D-28k (CB-28) and vesicular glutamate transport-2 (VGLUT2) in cerebellar folia II to IV. Compared to sham-controls, TBI significantly increased vacuolization of the molecular layer. At high magnification, deformed fiber-like structures were found along with the empty matrix space. Necrotic Purkinje cells were identified on 3.5 days after TBI, but not on 1 day. Purkinje cell count was reduced significantly 3.5 days after TBI. Compared with sham control, overall intensities of MDA and 8-OHdG immunoreactivities were increased dramatically on 1 and 3.5 days after TBI. Expression of VEGF-R2 was identified to be co-localized with 8-OHdG after TBI. This validates microvessel endothelial damage. The p53 immunoreactivities mainly deposited in the granular layer and microvessels after TBI and co-localization of the p53 with the CD45, both which were found within the microvessels. After TBI, CB28 expression decreased whereas the VGLUT2 expression increased significantly; Purkinje cells exhibited a reduced body size and deformity of dendritic arbor, delineated by CB28 immunoreactivity. Substantial damage to the cerebellum can be detectable as early as 1– 3.5 days in adult animals following sublethal TBI. Oxidative stress, inflammatory response and calcium neurotoxicity-associated mechanisms are involved in radiation-induced neuronal damage.
Keywords: inflammatory response, sublethal radiation, oxidative stress, calcium, Purkinje cell, cerebellum
INTRODUCTION
Acute radiation syndrome is characterized by multiple organ/tissue injuries following total body irradiation (TBI). The biphasic clinical signs and symptoms of TBI include nausea, vomiting, seizures and coma, implying radiation-elicited direct damage in central nervous system [1, 2]. Clinical evidence remains elusive concerning irradiation-induced cerebellar damage [3, 4]. Two reports indicated cerebellar damage following exposure to TBI, with either functional (balance and gait) and/or morphological (CT/MRI) evidence, however, this also involved other factors including leukemia as the primary disease, treatments of bone marrow transplantation, chemotherapy and antibiotics were in association with TBI treatment [1, 2]. A retrospective study examined 35 cases of cerebellar injury from total of 418 leukemia patients who received multiple treatments. The study ascribed cerebellar damage to effects of the chemotherapy and/or the antibiotics other than TBI. On the other hand, it is evident from experiments that radiation-induced cerebellar damage takes place in developing animals. In postnatal period, X-irradiation causes behavior deficits including ataxia, tremor, hypertonus, and dysmetria; all associated with reduced cerebellar volume and weight in cats [5]. Recently, Manda’s group has published a series of reports in which adult mice were employed to expose TBI with X-ray or high energy particle irradiation [6–9]. Cerebellar Purkinje cell and granular cell death was identified using conventional histology and a modified TUNEL method indicating occurrence of neuronal apoptosis [10]. Nevertheless, early damage as in morphological and immunohistochemical changes was not explored in these studies.
Purkinje cells are long-axon, large size neurons residing in the cerebellar cortex. While their total cell number composes less than 0.1 % of the total cell count of the cerebellum, these cells are the only known neurons that send output from the cerebellar cortex and have functions of motor coordination, learning, and cognitive tasks. Purkinje cells appear unique in histological stains. On the other hand, these neurons have been proposed as a heterogeneous population depending upon their expression of neurotransmitters, neuropeptides, and enzymes synthesizing neurotransmitters. Using monoclonal antibodies directed against cell-specific proteins, Purkinje cells can be categorized as Zebrin 2 (Aldolase C), P-path, Purkinje cell protein-2 [11], P400 [12, 13], and calbindin-D28K [14] subtypes. In application, CB-28 has been indicated as an excellent neuroanatomic marker for neuronal subpopulations including Purkinje cells [15, 16], while CB-28 immunoreactivity as a pathophysiological marker remains obscure.
As a central mechanism of irradiation induced damage, oxidative stress is elicited via interaction of ionizing radiation directly with water molecules, generating various transient reactive oxygen species (ROS) including superoxide, hydrogen peroxide, and hydroxyl radical [17–19]. Although radiotherapy is essential for brain tumor treatment, there is little evidence linking irradiation to neuronal oxidative dam-age specifically in the cerebellum. Alternatively, oxidative damage, if detected in a delayed period, can be ascribed to a secondary injury resulting from free radical leakage from mitochondria as seen in numerous diseases [20]. Taken together, the present study was designed to explore early signs of oxidative damage to cerebellum induced by sublethal dose of TBI. We employed oxidative stress markers, neuroanatomic markers, endothelial marker, and hematopoietic progenitor/inflammatory marker. Oxidative stress markers included: malondiadehyde (MDA), 8-hydroxy-2′-deoxyguanosine (8- OHdG), and protein 53 (p53), which labels lipid peroxidation, indicates DNA oxidation, highlights DNA damage, respective. Neuroanatomic markers included CB-28 and vesicular glutamate transport-2 (VGLUT2). Vascular endothelial growth factor receptor 2 (VEGF-R2) was used for endothelial marker [21–23]. CD45 was used for hematopoietic progenitor/inflammatory marker [24–27]. All markers were used to target histological and immunohistochemical features of Purkinje cells and their surroundings following the onset of TBI.
MATERIALS AND METHODS
Animals
Randomly bred, male CD2F1 mice (Harlan Sprague Dawley, Indianapolis, IN) were employed at the initiation age of 6–7 weeks (body weight 22– 25 g). They were housed in conventional cages under standardized conditions with controlled temperature and humidity and a 12– 12 h day-night light cycle in an AAALAC accredited facility. Animals had free access to water and chow (Harlan Teklad laboratory diet 7012, Purina Mills, St. Louis, MO). A total of 18 mice were assigned at random to 0 day group (n=6), 1 day group (n=6) and 3.5 day group (n=6): mice with or without exposure to a single-dose of total body irradiation (TBI) were euthanized by cervical dislocation at: 0 h (no irradiation/sham-control), 1 day, and 3.5 days, respectively. The brains were harvested and immediately preserved in a fixation solution for later analysis (see “Tissue preparation, Histology and Immunofluorescence staining”).
The experimental protocol was reviewed and approved by the Central Arkansas Veterans Healthcare System (CAVHS) Institutional Animal Care and Use Committee (IACUC) as well as by the IACUC at the University of Arkansas for Medical Sciences.
Irradiation and dosimetry
Un-anesthetized mice were exposed to a single dose of TBI in a Shepherd Mark I irradiator (model 25 Cs-137, J.L. Shepherd & Associates, San Fernando, CA). During irradiation, the animals were placed in a well-ventilated cylindrical Plexiglas chamber (J.L. Shepherd & Associates). The chamber was divided into four 90° “pie slice” compartments by vertical dividers made of T-6061 aluminum (machinable grade) with a gold anodized coating. Mice in 1 day and 3.5 day groups received a single dose of 8.5 Gy. Dosimetry was calculated by average dose rate of 6.41 Gy per minute and was corrected for decay.
Antibodies
Rabbit polyclonal antibodies: MDA, VEGF-R2 and CD45, and mouse monoclonal antibodies: 8-OHdG and p53, were purchased from Abcam Inc. (Cambridge, MA). Mouse monoclonal antibody for CB-28 and rabbit polyclonal antibody for vesicular glutamate transport-2 (VGLUT2) were purchased from Sigma-Aldrich (St. Louis, MO) and Novus Biologicals, Inc. (Littleton, CO), respectively. Second antibodies conjugated with fluorescent Alexa 488 and Alexa 594 were purchased from Molecular Probes (Eugene, OR).
Tissue preparation, histology and immunofluorescence staining
Brain tissues were fixed in methanol Carnoy’s solution (60% methanol, 30% chloroform, 10% acetic acid) and embedded in paraffin. Ten 10 μm-thick slices were cut along the sagittal axis starting from the midline of the cerebellum, each containing a sagittal view highlighting 10 folia of the cerebellar vermis. The adjacent slices were evaluated using hematoxylin and eosin (H&E) staining and immunofluorescent staining of 4 aforementioned target molecules: MDA, 8-OHdG, VEGF-R2, p53, CD45, CB- 28 and VGLUT2.
For immunofluorescence staining, the tissue was blocked with 2% BSA/5% goat serum in PBS for 1 h. Primary antibodies were diluted in the following ratios: MDA, 1: 200; 8-OHdG, 1: 100; VEGF-R2/P53, 1: 500; CD45, 1:250; CB-28/VGLUT2, 1: 5000. Sections were incubated with primary antibodies at 4 °C overnight and incubated thereafter with secondary antibodies (goat anti-rabbit/mouse IgG) conjugated with fluorescent Alexa 488/594 (1:200, Molecular Probes) for 1 h in dark at room temperature. 4′, 6- Diamidio-2-phenylindole (DAPI, 100 ng/ml) was used to identify nuclei in the final visualization. Sections incubated in the vehicle solution in the absence of primary antibody were used as negative controls. When double-labeling was required, primary antibodies from different hosts were used in combination with appropriate secondary antibodies, which were against the immunoglobulin from the corresponding hosts [28].
Microscopy and image analysis
Images for light micrograph
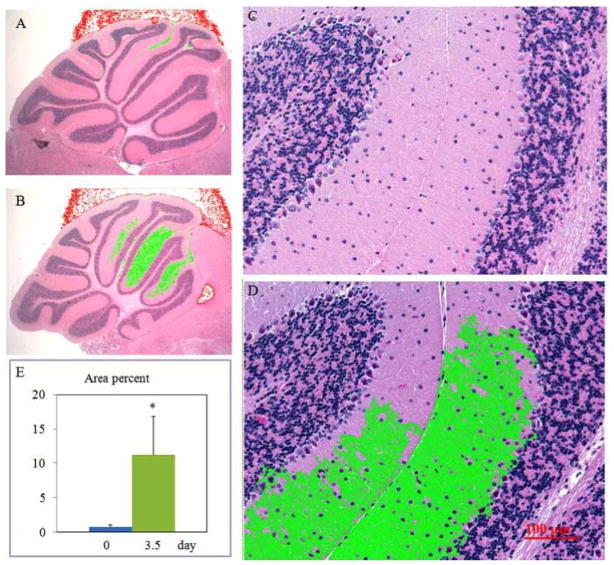
Using AxioVision ver 4.7 (Cari Zeiss MicroImaging, Inc. NY), density values were determined in the molecular layer in Folia II~IV of the cerebellar vermis (Fig. (1)). Reduction of the density in the molecular layer was validated by two processes: an area with reduced density was automatically determined by the software with pre-imported density value extent; evidence in high magnification images indicated morphological changes in the density-reduced area defined by the first procedure (Fig. (2)).
Fig. 1.
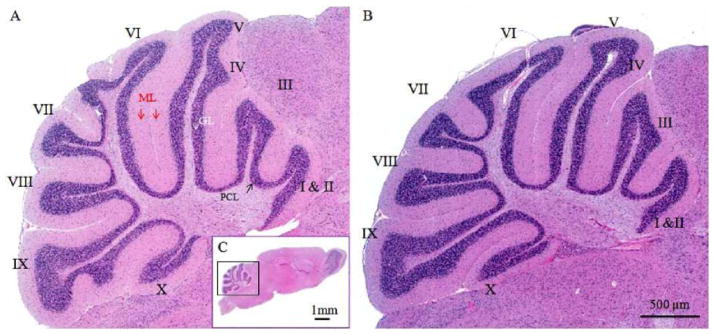
Representative micrographs of mouse cerebella with or without TBI challenge. Light micrographs of HE-stained sagittal sections are through the vermis of the cerebella demonstrating control (A) and TBI-damaged cerebellum (B). Fig. 1C displays a sagittal view of the whole brain. Three layers, molecular layer (ML), Purkinje cell layer (PCL) and granular layer (GL), are clearly distinguishable and look similar between intact and TBI-damaged cerebella. Roman numerals (I–X) indicate cerebellar folia
Fig. 2.
Image analyses identifying irradiation-induced morphological changes in the cerebellar molecular layer (refer to “Materials and Methods” section). Representative light micrographs with low (A&B) and high (C&D) magnifications exhibit Folia II~IV of the cerebellar vermis from control (A&C) and irradiation-challenged (3.5 day group, B&D) animals. The low density regions highlighted in green are automatically selected by computer software (AxioVision ver 4.7) after pre-inputing a density extent. In high magnification, deformed fiber-like structures along with the empty matrix space are identified (C&D). Ratio changes of green color area to total area of the sagittal sections of the cerebella vermis are summarized in E. *p<0.05 vs. the 0 day (control) group.
Purkinje cell counting was performed using H&E staining images in folia II~IV of the cerebellar vermis referring a method described before [29]. Briefly, the Purkinje cell number was counted along the Purkinje cell layer in folia II~IV using images acquired by a Zeiss Axio Observer Z1 Motorized Inverted Microscope (Cari Zeiss MicroImaging, Inc. NY) referring that folia II~IV are vulnerable to irradiation damage [30]. After determining the total length of alignment of Purkinje cells in Purkinje cell layer of the folia, the Purkinje cell count was expressed as Purkinje cell number per millimeter. Purkinje cells were conducted using 20 x magnification images, 3 slices per animal. Average of a parameter was derived from about 60 Purkinje cells per sample.
Images for immunoreactivities
Green (MDA, VEGF-R2, CD45 or VGLUT2), Red (8- OHdG, p53 or CB-28) and DAPI (blue for nuclear) were acquired in different camera channels using filters for fluorescein isothiocyanate, Texas red or DAPI, respectively in folia II~IV. Fluorescence intensity was quantized with software AxioVision ver 4.7. Negative control samples were used to establish the mean pixel intensity of the background signal per sample and treatment. Mean background intensity was then digitally subtracted by applying the low threshold tool to the images, and the average signal intensity (mean fluorescence intensity in arbitrary units, 3 slices per animal) was determined for each image.
For MDA or 8-OHdG, we measured overall intensities in the entire sagittal cerebellar vermis. The density was stan-dardized per area (Density/μm2). Three-dimensional image (40x/63x magnifications) reconstruction was performed to co-localize the targeted immunoreactivities, which led to better delineate Purkinje cell body and its dendritic arbor as well as microvessel structure. A stack of 18 optical sections covered the cerebellum entire depth of the section. Z-stack scanning microscopy images were acquired at step of 1.0 jim from the bottom to the top of any targeted structures. The objective had a working distance of 170 jim at a resolution of 1300 × 1030 pixels for 3D reconstruction.
For CB-28 or VGLUT2, we measured the intensities of the region in Purkinje cell lay and the molecular layer in Folia II~IV of the cerebellar vermis. The density was standardized per area (Density/μm2).
Statistical analysis
Analyses of variance (ANOVAs) were used to establish main effects of treatment and Fisher’s PLSD hoc tests with significance set at p < 0.05 were employed to localize specific differences. Data were presented as means ± SEM.
RESULTS
Assessments in cerebellar anatomy and histology
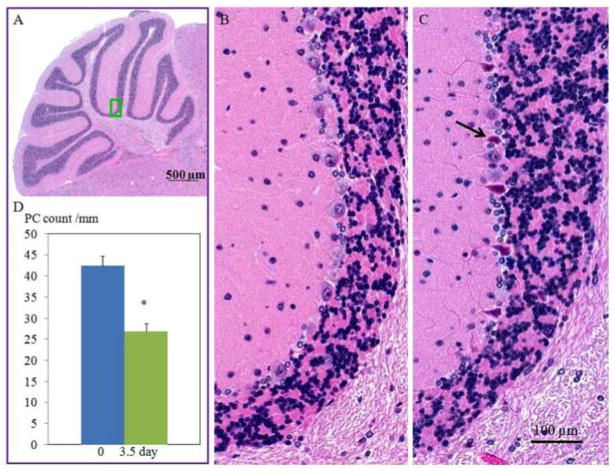
The cerebellar morphology at anatomic level showed similarity between groups. The organization of the cerebella cortex such as foliation and layer formation appeared regular in all groups (Fig. (1)). The anterior lobules (folia II–IV) were selected for further histological and immunohistochemical analyses. The H&E stained images revealed that TBI significantly increased vacuolization of the molecular layer as compared to sham-controls. At high magnification (Fig. (2)), deformed fiber-like structures along with the empty matrix space were identified. Percentage of intensity-reduced area to total area in the molecular layer was 7.0% ± 0.4 in 0 day group and 11.0% ± 0.6 in 3.5 day group, respectively (Fig. (2), p= 0.0002, 0 day group vs. 3.5 day group). Apparent necrotic Purkinje cells (Fig. (3)) were identified in 3.5 day group but not in the other two experimental groups. Purkinje cell counts were significantly decreased in 3.5 day group (p< 0.001) but not in 1 day group compared to at 0 day groups (Fig. (3)).
Fig. 3.
Micrographs showing cerebellar Purkinje cell morphology with or without TBI challenge (3.5 day). A green square in (A) highlights the location of where the representative micrographs (B, control animal; C, irradiation-challenged animal) were acquired. Arrows in (C) indicate degenerated Purkinje cells. Changes in Purkinje cell counts are summarized in D. *p<0.05 vs. the 0 day (control) group.
MDA and 8-OHdG immunoreactivities
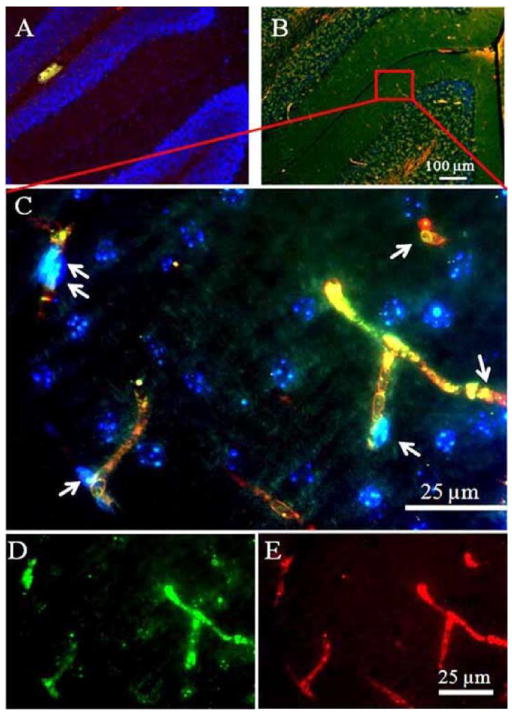
Overall intensities of the MDA immunoreactivities were dramatically increased 1 and 3.5 days (p= 0.0003 and p= 0.0005, respectively) after TBI as compared with sham control (Fig. (4)). Similarly, the overall 8-OHdG immunoreactivities were significantly increased at day 1 and day 3.5 (p= 0.0379 and p= 0.0032, respectively) as compared with sham control. In high magnification, the MDA immunoreactivities were identified in Purkinje cells and granular cells. On the other hand, 8-OHdG immunoreactivity was found to deposit in microvessel-like structures according to their morphological features and their anatomic locations (Fig. (5)). Localizations of MDA and 8-OHdG immunoreactivities after TBI were further visualized by the three-dimensional image reconstruction and granular cell bodies, while the 8- OHdG-labeling fluorescence stained amorphous structures within microvessel-like structures. Furthermore, the 8- OHdG immunoreactivities were found to be co-immunostained with the VEGF-R2 which, together with the DAPI staining, delineated the endothelial cells of the micro-vessels after TBI. However, either the 8-OHdG or the VEGF-R2 were rarely detectable in the sham-controls’ cerebellum (Fig. (6)).
Fig. 4.
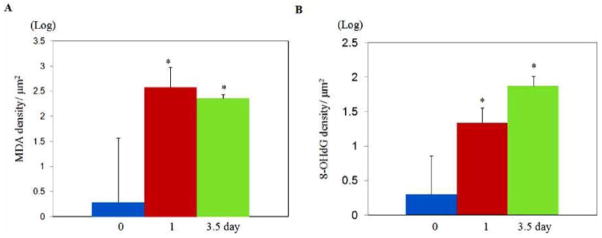
MDA and 8-OHdG immunoreactivities with or without TBI challenge. Changes in overall MDA fluorescent intensity are summarized in A, and changes in overall 8-OHdG fluorescent intensity are summarized in B. *p<0.05 vs. the 0 day (control) group.
Fig. 5.
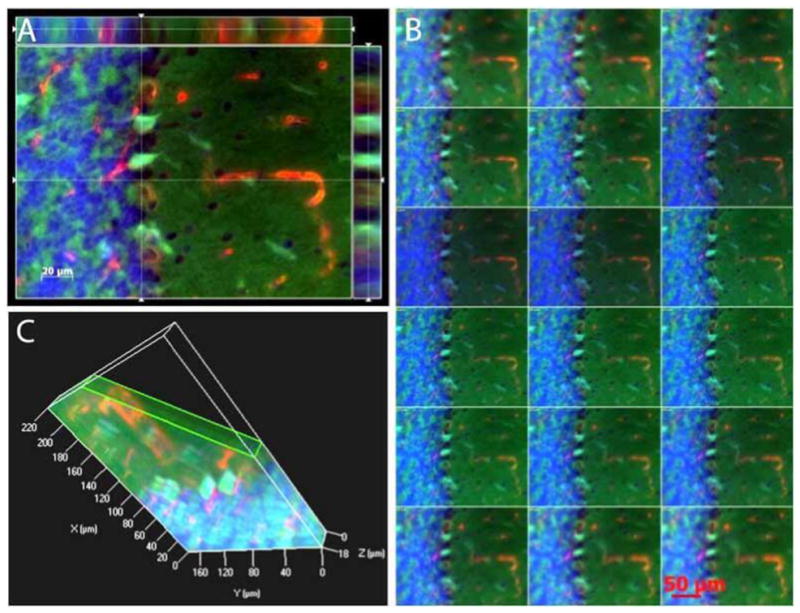
Three-dimensional reconstruction of MDA and 8-OHdG immunoreactivities Cut view images after TBI challenge. The micrographs highlight that 8-OHdG immunoreactivity deposits in microvessels-like structures, while MDA are anchored to Purkinje cells and granular cells (A). B: A series of digital images (1 tm) acquired by Z-stack scanning from the bottom to the top of to Purkinje cells and granular cells. Green, MDA; Red, 8-OHdG, blue, DAPI. C: A 3D structure of three layers, molecular layer, Purkinje cell layer and granular layer in cerebella.
Fig. 6.
VEGF-R2 and 8-OHdG immunoreactivities in the microvessel endothelial cells after TBI. The VEGF-R2 or the 8-OHdG was rarely detectable in 0 day (A). The VEGF-R2 were found to be co-localized with the 8-OHdG in the microvessel endothelial cells 1 day after TBI (B). The co-localization of the VEGF-R2 and 8-OHdG immunoreactivities was further verified in the high magnification image (C). Arrows indicate endothelial cells which stain yellow after merging the VEGF-R2 labeling color (green, image (D)), and the 8-OHdG labeling color (red, image (E)).
P53 and CD45 immunoreactivities
There were little p53 or CD45 immunoreactivities in the sham-controls’ cerebellum (Fig. (7)). However, either the p53 or the CD45 immunoreactivities appeared in the cerebellum 1 and 3.5 days after TBI. Interestingly, both the p53 and the CD45 deposited in the molecular layer and the granular layer, and these two proteins barely displayed co-localization 1 day after TBI. The molecular layer showed strong expressions of the p53 and the CD45 3.5 days after TBI. The p53 and the CD45 immunoreactivities were largely distributed within the microvessels of the molecular layer 3.5 days after TBI. Many hematopoietic nucleated cells expre-ssed both p53 and CD45, which were identified by their intravascular location, DAPI-nucleic staining, and their labeled immunoreactivity color (displaying yellow after color merging of the green (CD45) and the red (p53)). Nevertheless, neither the p53 nor the CD45 was identified in the Purkinje cell layer before or after TBI.
Fig. 7.

Cerebellar p53 and CD45 immunoreactivities after TBI. There were little p53 (red) or CD45 (green) immunoreactivities in the cerebellum of sham controls (Fig. (A)). The p53 or the CD45 immunoreactivities appeared in the cerebellum 1 (B) and 3.5 (C) days after TBI. Many hematopoietic nucleated cells expressed both p53 and CD45, which were identified by their intravascular location (C, arrow), DAPI-nucleic staining, CD45 expression and their labeled immunoreactivity color (displaying yellow after color merging of the green (CD45) and the red (p53)).
CB-28 and VGLUT2 expression
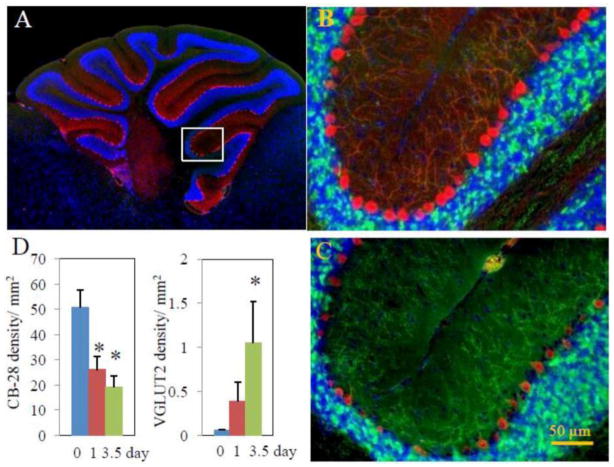
The CB-28 immunoreactivity (red) evidently delineated Purkinje cell bodies and their arbors in sham-control animals (Fig. (8A)). After the onset of TBI, CB-28 expression displayed marked reductions in Purkinje cell bodies and their dendrite arbors, either in fluorescent intensity or in cell body size and arbor branch numbers (Figs. (8B and C)). Further-more, the fan-like dendrite arbors deformed after TBI. Since they generally extend across the entire molecular layer, the average vertical height of the Purkinje cell arbors in control animals is taken as 100%. After TBI, the height was reduced by 26.81± 2.78% in 1 day group and by 54.99± 1.94% in 3.5 day group. On the other hand, there was very low VGLUT2 immunoreactivity detectable along the Purkinje cell bodies or their arbors in these animals (Fig. (8A)). After TBI, VGLUT2 expression was significantly intensified (bright green dots, Figs. (8B and C)). As demonstrated in Fig. (8C), reduction in CB-28 expression was reversely associated with increase in VGLUT2 expression over times. Overall CB-28 fluorescent intensity was significantly reduced at 1 day and 3.5 day, whereas overall VGLUT2 fluorescent intensity was significantly increased by 3.5 day.
Fig. 8.
Cerebellar CB-28 and VGLUT2 immunoreactivities. Representative micrographs show CB-28 (red) and VGLUT2 (green) immuno-flourescence-delineated cerebellar structures in 0 day (B) and 3.5 day (C) group animals following TBI, while Fig. (6A) shows the overall view of the cerebellar sagittal section in which the representative images in (B) and (C) are localized (rectangle). TBI resulted in reduction in CB-28 expression and deformation of CB-28-delineated cell structures, evidently Purkinje cell bodies and Purkinje cell dendrite arbors. On the other hand, TBI intensified VGLUT2 expression. Changes in overall CB-28 and VGLUT2 expression are summarized in (D). *p<0.05 vs. the 0 day (control) group.
DISCUSSION
The present study has established for the first time the early damage indices of cerebellum, as revealed by histological and immunohistochemical techniques (see Table 1), in adult mice subjected to a sublethal dose of TBI. Loss of Purkinje cells occur 3.5 days post-TBI and deformation of neuronal projections, the axons and dendritic arbor, appears as early as 1 day following onset of TBI. Immunohistochemical indices of early cerebellar damage include reduced expression of CB-28, and increased expression of VGluT2, MDA and 8-OHdG. In addition, expressions in VEGFR2, CD45 and p53 are minimal in the cerebellums of the control animals, but are readily detectable in the cerebellums after TBI. These findings have substantial translational implications in that they suggest a significant performance decrement in radiation exposed individuals after a radiation accident or in the nuclear/radiological terrorism situation, as well as the potential for long term neurological deficits in patients who have undergone radiation therapy of cancer.
Table 1.
Sublethal TBI-elicited histological and immunofluorescent changes in the cerebellum
| IFS/HE studies | 0 day | 1 day | 3.5 day | ||||||
|---|---|---|---|---|---|---|---|---|---|
| Primary antibodies | ML | PCL | MV | ML | PCL | MV | ML | PCL | MV |
| HE | − | − | − | − | − | − | vacuolization | + | − |
| MDA | +/− | +/− | +/− | + | + | + | + | + | + |
| 8-OHdG | +/− | +/− | +/− | + | + | + | ++ | ++ | ++ |
| VEGF-R2 | − | − | − | − | − | + | +/− | +/− | +/− |
| CD45 | − | − | − | + | + | + | + | +/− | + |
| p53 | − | − | − | + | − | + | + | − | + |
| CB-28 | ++ | ++ | N/A | + | + | N/A | + | + | N/A |
| VGLUT2 | +/− | +/− | N/A | + | +/− | N/A | ++ | +/− | N/A |
TBI: Total body irradiation
IFS: Immunofluorescence staining
HE: Hematoxylin & Eosin stain
ML: Molecular layer
PCL: Purkinje cell layer
MV: Microvessels
MDA: malondiadehyde
8-OHdG: 8-hydroxy-2′-deoxyguanosine
VEGF-R2: Vascular Endothelial Growth Factor Receptor-2
CB-28: Calbindin D-28k
VGLUT2: vesicular glutamate transport-2
−: indicates negative expression/normal appearance;
+: indicates positive expression/drastic change;
+/−: suggests an obscure alteration;
++: displays strong expression
Mechanistically, irradiation induces radiolysis of water and generates reactive radicals, which initiate oxidative damage of intracellular target molecules including RNA, DNA and membrane lipid [19]. As shown in Fig. (4), total arbitrative intensities of MDA and 8-OHdG immunofluorescence increased sharply, indicating lipid peroxidation and RNA and/or DNA oxidation in acute phase (1 – 3.5 days) of TBI-induced cerebellar damage. While the method applied in the present study is different from the previous study in determining oxidative levels, the acute increases in MDA and 8-OHdG following irradiation appears much more dramatic as compared to chronic, aging-associated MDA and 8-OHdG changes (increase of 1 fold or less) in the cerebellum [31]. It is plausible that aging process is “physiological” and/or compensative mechanisms at least partly inhibit aging-associated increases of the oxidative products, while TBI at sublethal dose of irradiation compromises the existing anti-oxidative mechanisms in the cerebellum. It is worthy of mentioning that 8-OHdG is primarily localized in the cellular nuclei, suggesting DNA oxidation [31]. Similar findings are reported recently in irradiation-induced chronic neuronal damage: nuclear deposit of 8-OHdG in hippocampal granular cells [9]. Interestingly, the present study demonstrates deposit of 8-OHdG as well as MDA in microvessel-like structures. The discrepancy may be attributable to the fact that MDA is anchored to the cellular membrane while 8- OHdG, degraded RNA and DNA sections, were permeable to the cellular membrane and were drained to the micro-vessels. Increase in MDA may increase cellular membrane permeability, facilitating damaged RNA and DNA leakage. The present study applied a protocol, which did not include the perfusion of animals and therefore 8-OHdG was retained in the serum of the microvessels. 8-OHdG is detectable in serum of animals and it increases after exposure to cadmium [32] or to irradiation [8], arguing for this assumption.
The neurovascular syndrome that develops after exposure to high doses of ionizing radiation is well known. The syndrome is attributable to occurrence of brain-blood-barrier (BBB) damage and inflammation. Using the VEGF-R2, endothelial DNA damage of the microvessels was identified by the co-immunostaining of the VEGF-R2 with the 8- OHdG after onset of the TBI (Fig. (6)). VEGF-R2 is a transmembrane kinase receptor that regulates multiple vas-cular endothelial functions including proliferation, migration, survival and permeability [33]. Our results concerning VEGF-R2 expression are consistent with others, demonstrating that VEGF-R2 expression is minimal in normal brain tissue [34]. Up-regulation of VEGF-R2 has been shown in many pathologic conditions including cancer [35] and stroke [34] in which active angiogenesis and increased vascular permeability occur. The mechanisms of how radiation up-regulates VEGF-R2 remain unclear, nevertheless, radiation indeed results in increased VEGF-R2 expression in tumor [36]. The present study indicates that oxidative stress/DNA damage may trigger VEGF-R2 up-regulation because VEGF-R2 is co-immunostained with 8-OHdG.
Inflammatory responses occur after exposure to ionizing irradiation, displaying increased microphage activation [37]. p53 induction has been proposed as an in vivo marker for irradiation-induced genomic instability [38]. Ionizing irradiation induced cell death in the developing central nervous system requires p53 [39]. After TBI, p53 is activated in the cerebellum and p53 may induce apoptotic neuron death via the caspase-dependent or the caspase-independent pathway [40]. The present study is consistent with the above findings that p53 induction occurs in the cerebellar granular layer after TBI. Noticeably, many cells in the granular layer expressed CD45 without co-immunostained with p53 1 day after TBI, indicating that microphages might respond to granular neuron damage/death. Because the Purkinje cell counts did not decrease 1 day but did decrease 3.5 days after the sublethal TBI, multiple granular cell deaths 1 day after TBI might accelerate degeneration of the Purkinje cells that had been damaged by exposure of the TBI. Interestingly, the p53 expression after TBI was also found in the microvessels, noticeably 3.5 days after TBI. The co-immunostaining of p53 with CD45 (Fig. (7)) indicates that the TBI may synchronize cell death of the hematopoietic nucleated cells. Nevertheless, because no p53 immunoreactivities were detected in the Purkinje cell layer, the significant Purkinje cell loss 3.5 days after TBI might not result from the p53 mediated pathogenic mechanism. On the other hand, the mechanisms by which the Purkinje cells die of the sublethal TBI warrant further investigations.
Ca2+ signaling is essential for neuronal function. Ca2+ signaling is thought to be mediated by cytosolic Ca2+- binding proteins [41]. CD-28 is one of the best characterized high-affinity Ca2+-binding proteins [42]. In general, the physiological function of CB-28 remains not fully clarified [43], while it is thought to act either as an intracellular calcium buffer, or as a vehicle for calcium-intramembranous transport. CB-28 has also been indicated as an excellent neuroanatomic marker for neuronal subpopulations such as for one of subtypes of Purkinje cells [15, 16]. However, in randomly-selected intact cerebellar tissue slices, some of Purkinje cells (cell body) are CB-28 immunoreactivity-negative, while the majority of Purkinje cells, even along the same Purkinje cell layer, express CB-28. Our finding of the Purkinje cell CB-28 immunoreactivity in intact animals is consistent with those reported before [15, 16]. Noticeably, the present study demonstrates that CB-28 immunoreactivity can be applied to address pathophysiological status: early changes in irradiation-induced neuronal/Purkinje cell damage.
CB-28 immunoreactivity-based pathophysiological features can be classified in 2 categories: reduction in CB-28 expression and deformation of CB-28-delineated cell structures, evidently Purkinje cell bodies and Purkinje cell dendrite arbors. While application of other methods such as Western blot analysis can be used to confirm reduced CB-28 expression other than CB-28 redistribution following TBI, degradation/consumption and inhibition of synthesis of CB-28 may also explain the reduction of CB-28 expression. Reduction in CB-28 expression has been reported in other pathophysiological conditions including aging [44] and epilepsy [45]. The deformed Purkinje cells outlined by the CB-28 immunoreactivity may be partially derived as a result of CB-28 reduction. These deformations include reduced Purkinje cell body size, changed cell body shape, shortening in height of the Purkinje cell dendrite arbors, and reduction in size of the dendrite arbor trunk and number of the arbor branches. Although we observed a reduction in the length of Purkinje arbors, CB-28 reduction does not seem to lead distortion of the Purkinje cell dendrite arbors (see Fig. 8). Thus CB-28 immunoreactivity provides a morphological parameter to define pathological Purkinje cell changes. Interestingly, these findings are consistent with the report in which rats subjected to postnatal X-ray irradiation had shown 3 weeks later reduced CB-28 immunoreactivity accompanied by thin, shortened, and disoriented Purkinje cell dendrite arbors [30]. Similarly, a morphological study using Golgi-staining method demonstrated multiple primary dendrites, angulation of the primary dendrites, long segments of primary dendrites without branches and significantly reduced dendritic volume in postnatal rats subjected to in utero exposure to continuous irradiation [46].
VGLUT2 mediates the uptake of glutamate into synaptic vesicles at presynaptic nerve terminals of excitatory neural cells. VGLUT2 may also mediate the transport of inorganic phosphate. Major subcellular locations of VGLUT2 are cytoplasmic vesicle, secretory vesicle and synaptic vesicle membrane. Recent molecular biology studies have identified three subtypes of the vesicular glutamate transporter: VGluT1; VGluT2; and VGluT3 [47]. VGLUT2 (NM_ 020346.1) is a sodium dependent inorganic phosphate co-transporter that is involved in the calcium dependent glutamate release from astrocytes [48]. The present study demonstrates that TBI induces up-regulation of VGLUT2 along the Purkinje cell dendrite arbors (Fig. 8). The locations of VGLUT2 immunoreactivity indicate a pre-synaptic accumulation at the climbing fiber endings. It is likely that VGLUT2 was transferred to the locations relevant to local glutamate transport and calcium-dependent events. It is of interest whether or not VGLUT2 plays a crucial role in irradiation-induced neuronal damage. VGLUT2 may be involved in an excitotoxicity pathway: irradiation—oxidative stress--VGLUT2 increase--glutamate release- Ca2+ influx into cells -CB-28 consumption, and finally leads to neuron death. Future studies are warranted to determine the possibilities of such a pathway.
In conclusion sublethal TBI results in significant damage to the cerebellum of adult mice. Oxidative damage was detectable in Purkinje cells, cell bodies and their dendrite arbors, 1 day after radiation; however, neuronal death was not evident until 3.5 days, indicating partial delayed death of Purkinje neurons. Oxidative stress, inflammatory response and calcium neurotoxicity-associated mechanisms are involved in radiation-induced neuronal damage.
These findings have significant implications to radiation exposure of civilians or military personnel in nuclear/radio-logical accidents, warfare, or terrorism scenarios, as well as to the use of ionizing radiation as a cancer treatment modality.
Acknowledgments
This work was supported by the Defense Threat Reduction Agency (grant HDTRA1-07-C-0028 to MH-J and H.10027-07-AR-R to KSK) and by NIH/NIAID (grant AI67798 to MH-J).
References
- 1.Diener HC, Ehninger G, Schmidt H, Stab U, Majer K, Marquardt B. Neurologic complications after bone marrow transplantation. Nervenarzt. 1991;62(4):221–25. [PubMed] [Google Scholar]
- 2.Mott SH, Packer RJ, Vezina LG, et al. Encephalopathy with parkinsonian features in children following bone marrow transplantations and high-dose amphotericin B. Ann Neurol. 1995;37(6):810–14. doi: 10.1002/ana.410370616. [DOI] [PubMed] [Google Scholar]
- 3.Di Toro CG, Di Toro PA, Zieher LM, Guelman LR. Sensitivity of cerebellar glutathione system to neonatal ionizing radiation exposure. Neurotoxicology. 2007;28(3):555–61. doi: 10.1016/j.neuro.2006.12.002. [DOI] [PubMed] [Google Scholar]
- 4.Konczak J, Timmann D. The effect of damage to the cerebellum on sensorimotor and cognitive function in children and adolescents. Neurosci Biobehav Rev. 2007;31(8):1101–13. doi: 10.1016/j.neubiorev.2007.04.014. [DOI] [PubMed] [Google Scholar]
- 5.Anderson WJ, Stromberg MW. Effects of low-level x-irradiation on cat cerebella at different postnatal intervals. II. Changes in Purkinje cell morphology. J Comp Neurol. 1977;171(1):39–50. doi: 10.1002/cne.901710104. [DOI] [PubMed] [Google Scholar]
- 6.Manda K, Ueno M, Moritake T, Anzai K. cc-Lipoic acid attenuates x-irradiation-induced oxidative stress in mice. Cell Biol Toxicol. 2007a;23(2):129–37. doi: 10.1007/s10565-006-0137-6. [DOI] [PubMed] [Google Scholar]
- 7.Manda K, Ueno M, Moritake T, Anzai K. Radiation-induced cognitive dysfunction and cerebellar oxidative stress in mice: protective effect of alpha-lipoic acid. Behav Brain Res. 2007b;177(1):7–14. doi: 10.1016/j.bbr.2006.11.013. [DOI] [PubMed] [Google Scholar]
- 8.Manda K, Ueno M, Anzai K. Melatonin mitigates oxidative damage and apoptosis in mouse cerebellum induced by high-LET 56Fe particle irradiation. J Pineal Res. 2008a;44(2):189–96. doi: 10.1111/j.1600-079X.2007.00507.x. [DOI] [PubMed] [Google Scholar]
- 9.Manda K, Ueno M, Anzai K. Memory impairment, oxidative damage and apoptosis induced by space radiation: ameliorative potential of alpha-lipoic acid. Behav Brain Res. 2008b;187(2):387– 95. doi: 10.1016/j.bbr.2007.09.033. [DOI] [PubMed] [Google Scholar]
- 10.Kurita H, Kawahara N, Asai A, Ueki K, Shin M, Kirino T. Radiation-induced apoptosis of oligodendrocytes in the adult rat brain. Neurol Res. 2001;23(8):869–74. doi: 10.1179/016164101101199324. [DOI] [PubMed] [Google Scholar]
- 11.Varela MC, Arce A, Greiner B, et al. Cyclosporine A-induced decrease in calbindin-D 28 kDa in rat kidney but not in cerebral cortex and cerebellum. Biochem Pharmacol. 1998;55(12):2043–46. doi: 10.1016/s0006-2952(98)00025-2. [DOI] [PubMed] [Google Scholar]
- 12.Maeda N, Niinobe M, Inoue Y, Mikoshiba K. Developmental expression and intracellular location of P400 protein characteristic of Purkinje cells in the mouse cerebellum. Dev Biol. 1989;133(1):67–76. doi: 10.1016/0012-1606(89)90297-2. [DOI] [PubMed] [Google Scholar]
- 13.Maeda N, Niinobe M, Mikoshiba K. A cerebellar Purkinje cell marker P400 protein is an inositol 1,4,5-trisphosphate (InsP3) receptor protein. Purification and characterization of InsP3 receptor complex. EMBO J. 1990;9(1):61–7. doi: 10.1002/j.1460-2075.1990.tb08080.x. [DOI] [PMC free article] [PubMed] [Google Scholar]
- 14.Nordquist DT, Kozak CA, Orr HT. cDNA cloning and characterization of three genes uniquely expressed in cerebellum by Purkinje neurons. J Neurosci. 1988;8(12):4780–89. doi: 10.1523/JNEUROSCI.08-12-04780.1988. [DOI] [PMC free article] [PubMed] [Google Scholar]
- 15.Andressen C, Blumcke I, Celio MR. Calcium-binding proteins: selective markers of nerve cells. Cell Tissue Res. 1993;271(2):181–208. doi: 10.1007/BF00318606. [DOI] [PubMed] [Google Scholar]
- 16.Celio MR. Calbindin D-28k and parvalbumin in the rat nervous system. Neuroscience. 1990;35(2):375–475. doi: 10.1016/0306-4522(90)90091-h. [DOI] [PubMed] [Google Scholar]
- 17.Simic MG, al-Sheikhly M, Jovanovic SV. Inhibition of free radical processes by antioxidants--tryptophan and 5-hydroxytryptophan. Bibl Nutr Diet. 1989;(43):288–96. doi: 10.1159/000416713. [DOI] [PubMed] [Google Scholar]
- 18.Walburg HE, Eisele GR, Mraz FR. Quantitative separation of bone and muscle radioactivity in small rodents using dermestid beetles. Health Phys. 1979;37(3):400–01. [PubMed] [Google Scholar]
- 19.Weiss JF, Kumar KS. Antioxidant mechanisms in radiation injury and radioprotection. In: Chow CK, editor. Cellular Antioxidant Defense. USA: CRC Press; 1988. pp. 163–189. [Google Scholar]
- 20.Liu-Snyder P, Logan MP, Shi R, Smith DT, Borgens RB. Neuroprotection from secondary injury by polyethylene glycol requires its internalization. J Exp Biol. 2007;210(Pt 8):1455–62. doi: 10.1242/jeb.02756. [DOI] [PubMed] [Google Scholar]
- 21.Chen KD, Li YS, Kim M, et al. Mechanotransduction in response to shear stress. Roles of receptor tyrosine kinases, integrins, and Shc. J Biol Chem. 1999;274(26):18393–400. doi: 10.1074/jbc.274.26.18393. [DOI] [PubMed] [Google Scholar]
- 22.Jin ZG, Ueba H, Tanimoto T, Lungu AO, Frame MD, Berk BC. Ligand-independent activation of vascular endothelial growth factor receptor 2 by fluid shear stress regulates activation of endothelial nitric oxide synthase. Circ Res. 2003;93(4):354–63. doi: 10.1161/01.RES.0000089257.94002.96. [DOI] [PubMed] [Google Scholar]
- 23.Punyadeera C, Thijssen VL, Tchaikovski S, et al. Expression and regulation of vascular endothelial growth factor ligands and receptors during menstruation and post-menstrual repair of human endometrium. Mol Hum Reprod. 2006;12(6):367–75. doi: 10.1093/molehr/gal027. [DOI] [PubMed] [Google Scholar]
- 24.Gille J, Heidenreich R, Pinter A, et al. Simultaneous blockade of VEGFR-1 and VEGFR-2 activation is necessary to efficiently inhibit experimental melanoma growth and metastasis formation. Int J Cancer. 2007;120(9):1899–908. doi: 10.1002/ijc.22531. [DOI] [PubMed] [Google Scholar]
- 25.Hollemann D, Budka H, Loscher WN, Yanagida G, Fischer MB, Wanschitz JV. Endothelial and myogenic differentiation of hematopoietic progenitor cells in inflammatory myopathies. J Neuropathol Exp Neurol. 2008;67(7):711–19. doi: 10.1097/NEN.0b013e31817d8064. [DOI] [PubMed] [Google Scholar]
- 26.Porto I, Di VL, De Maria GL, et al. Comparison of the effects of ramipril versus telmisartan on high-sensitivity C-reactive protein and endothelial progenitor cells after acute coronary syndrome. Am J Cardiol. 2009;103(11):1500–505. doi: 10.1016/j.amjcard.2009.01.370. [DOI] [PubMed] [Google Scholar]
- 27.Swijnenburg RJ, Govaert JA, van der Bogt KE, et al. Timing of bone marrow cell delivery has minimal effects on cell viability and cardiac recovery after myocardial infarction. Circ Cardiovasc Imaging. 2010;3(1):77–85. doi: 10.1161/CIRCIMAGING.109.872085. [DOI] [PMC free article] [PubMed] [Google Scholar]
- 28.Cui L, Blanchard RK, Cousins RJ. The permissive effect of zinc deficiency on uroguanylin and inducible nitric oxide synthase gene upregulation in rat intestine induced by interleukin 1cc is rapidly reversed by zinc repletion. J Nutr. 2003;133(1):51–6. doi: 10.1093/jn/133.1.51. [DOI] [PubMed] [Google Scholar]
- 29.Khan J, Iiboshi Y, Cui L, Wasa M, Okada A. Role of intestinal mucus on the uptake of latex beads by Peyer’s patches and on their transport to mesenteric lymph nodes in rats. JPEN J Parenter Enteral Nutr. 1999;23(1):19–23. doi: 10.1177/014860719902300119. [DOI] [PubMed] [Google Scholar]
- 30.Li HP, Miki T, Yokoyama T, et al. Regional differences in vulnerability of the cerebellar foliations of rats exposed to neonatal X-irradiation. Neurosci Lett. 2006;402(1–2):86–91. doi: 10.1016/j.neulet.2006.03.040. [DOI] [PubMed] [Google Scholar]
- 31.Cui L, Hofer T, Rani A, Leeuwenburgh C, Foster TC. Comparison of lifelong and late life exercise on oxidative stress in the cerebellum. Neurobiol Aging. 2009;30(6):903–09. doi: 10.1016/j.neurobiolaging.2007.09.005. [DOI] [PMC free article] [PubMed] [Google Scholar]
- 32.Galazyn-Sidorczuk M, Brzoska MM, Jurczuk M, Moniuszko-Jakoniuk J. Oxidative damage to proteins and DNA in rats exposed to cadmium and/or ethanol. Chem Biol Interact. 2009;180(1):31–38. doi: 10.1016/j.cbi.2009.01.014. [DOI] [PubMed] [Google Scholar]
- 33.Holmes K, Roberts OL, Thomas AM, Cross MJ. Vascular endothelial growth factor receptor-2: structure, function, intracellular signalling and therapeutic inhibition. Cell Signal. 2007;19(10):2003–12. doi: 10.1016/j.cellsig.2007.05.013. [DOI] [PubMed] [Google Scholar]
- 34.Cai W, Guzman R, Hsu AR, et al. Positron emission tomography imaging of poststroke angiogenesis. Stroke. 2009;40(1):270–77. doi: 10.1161/STROKEAHA.108.517474. [DOI] [PubMed] [Google Scholar]
- 35.Plate KH, Breier G, Millauer B, Ullrich A, Risau W. Up-regulation of vascular endothelial growth factor and its cognate receptors in a rat glioma model of tumor angiogenesis. Cancer Res. 1993;53(23):5822–27. [PubMed] [Google Scholar]
- 36.Solberg TD, Nearman J, Mullins J, Li S, Baranowska-Kortylewicz J. Correlation between tumor growth delay and expression of cancer and host VEGF, VEGFR2, and osteopontin in response to radiotherapy. Int J Radiat Oncol Biol Phys. 2008;72(3):918–26. doi: 10.1016/j.ijrobp.2008.06.1925. [DOI] [PMC free article] [PubMed] [Google Scholar]
- 37.Lorimore SA, Coates PJ, Scobie GE, Milne G, Wright EG. Inflammatory-type responses after exposure to ionizing radiation in vivo: a mechanism for radiation-induced bystander effects? Oncogene. 2001;20(48):7085–95. doi: 10.1038/sj.onc.1204903. [DOI] [PubMed] [Google Scholar]
- 38.Coates PJ, Robinson JI, Lorimore SA, Wright EG. Ongoing activation of p53 pathway responses is a long-term consequence of radiation exposure in vivo and associates with altered macrophage activities. J Pathol. 2008;214(5):610–16. doi: 10.1002/path.2321. [DOI] [PubMed] [Google Scholar]
- 39.Wood KA, Youle RJ. The role of free radicals and p53 in neuron apoptosis in vivo. J Neurosci. 1995;15(8):5851–57. doi: 10.1523/JNEUROSCI.15-08-05851.1995. [DOI] [PMC free article] [PubMed] [Google Scholar]
- 40.Herzog KH, Schulz A, Buerkle C, Gromoll C, Braun JS. Radiation induced apoptosis in retinal progenitor cells is p53-dependent with caspase-independent DNA fragmentation. Eur J Neurosci. 2007;25(5):1349–56. doi: 10.1111/j.1460-9568.2007.05381.x. [DOI] [PubMed] [Google Scholar]
- 41.Carafoli E. Intracellular calcium homeostasis. Annu Rev Biochem. 1987;56:395–433. doi: 10.1146/annurev.bi.56.070187.002143. [DOI] [PubMed] [Google Scholar]
- 42.Heizmann CW. Par albumin, an intracellular calcium-binding protein; distribution, properties and possible roles in mammalian cells. Experientia. 1984;40(9):910–21. doi: 10.1007/BF01946439. [DOI] [PubMed] [Google Scholar]
- 43.Vecellio M, Schwaller B, Meyer M, Hunziker W, Celio MR. Alterations in Purkinje cell spines of calbindin D-28 k and parvalbumin knock-out mice. Eur J Neurosci. 2000;12(3):945–54. doi: 10.1046/j.1460-9568.2000.00986.x. [DOI] [PubMed] [Google Scholar]
- 44.Choi JH, Lee CH, Yoo KY, et al. Age-related changes in calbindin d28k, parvalbumin, and calretinin immunoreactivity in the dog main olfactory bulb. Cell Mol Neurobiol. 2010;30(1):1–12. doi: 10.1007/s10571-009-9425-z. [DOI] [PMC free article] [PubMed] [Google Scholar]
- 45.Carter DS, Harrison AJ, Falenski KW, Blair RE, DeLorenzo RJ. Long-term decrease in calbindin-D28K expression in the hippocampus of epileptic rats following pilocarpine-induced status epilepticus. Epilepsy Res. 2008;79(2–3):213–23. doi: 10.1016/j.eplepsyres.2008.02.006. [DOI] [PMC free article] [PubMed] [Google Scholar]
- 46.Gopinath G, Banerjee R, Gopinath PG. Effect of internal irradiation on the maturing Purkinje cells in the rat. A Golgi study. J Neurol Sci. 1987;78(1):93–109. doi: 10.1016/0022-510x(87)90082-7. [DOI] [PubMed] [Google Scholar]
- 47.Miyazaki T, Fukaya M, Shimizu H, Watanabe M. Subtype switching of vesicular glutamate transporters at parallel fibre-Purkinje cell synapses in developing mouse cerebellum. Eur J Neurosci. 2003;17(12):2563–72. doi: 10.1046/j.1460-9568.2003.02698.x. [DOI] [PubMed] [Google Scholar]
- 48.Ni Y, Parpura V. Dual regulation of Ca2+-dependent glutamate release from astrocytes: vesicular glutamate transporters and cytosolic glutamate levels. Glia. 2009 doi: 10.1002/glia.20849. [DOI] [PMC free article] [PubMed] [Google Scholar]


